Pipelay Vessel Operator Market Analysis, Size, and Forecast 2026-2030: APAC (China, Japan, and India), Europe (UK, Germany, and France), North America (US, Canada, and Mexico), Middle East and Africa (Saudi Arabia, South Africa, and UAE), South America (Brazil, Argentina, and Colombia), and Rest of World (ROW)

Pipelay Vessel Operator Market Analysis, Size, and Forecast 2026-2030:
APAC (China, Japan, and India), Europe (UK, Germany, and France), North America (US, Canada, and Mexico), Middle East and Africa (Saudi Arabia, South Africa, and UAE), South America (Brazil, Argentina, and Colombia), and Rest of World (ROW)

Published: Dec 2025 292 Pages SKU: IRTNTR70119

Market Overview at a Glance

$66.6 Mn
Market Opportunity
4%
CAGR 2025 - 2030
52.6%
APAC Growth
$160.3 Mn
J lay barges segment 2024

Pipelay Vessel Operator Market Size 2026-2030

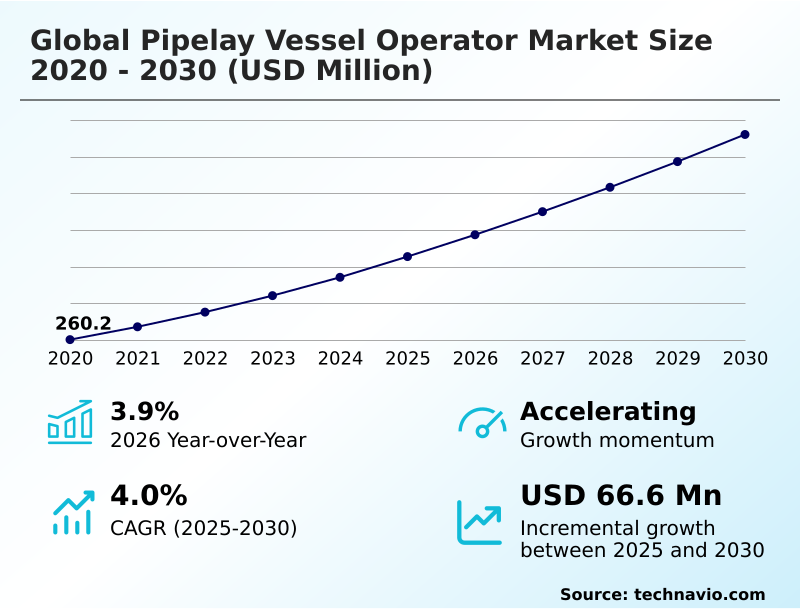
The pipelay vessel operator market size is valued to increase by USD 66.6 million, at a CAGR of 4% from 2025 to 2030. Rising demand for oil and gas globally will drive the pipelay vessel operator market.

Major Market Trends & Insights

  • APAC dominated the market and accounted for a 52.6% growth during the forecast period.
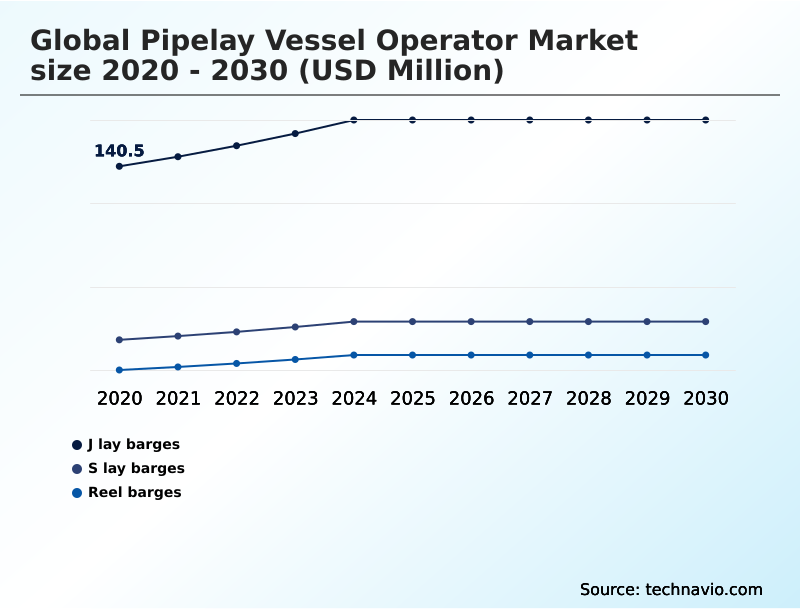
  • By Product - J lay barges segment was valued at USD 160.3 million in 2024
  • By Application - Oil and gas segment accounted for the largest market revenue share in 2024

Market Size & Forecast

  • Market Opportunities: USD 111.9 million
  • Market Future Opportunities: USD 66.6 million
  • CAGR from 2025 to 2030 : 4%

Market Summary

  • The pipelay vessel operator market is undergoing a significant transformation, driven by the dual demands of energy security and the global energy transition. Operators are moving beyond traditional shallow water operations to facilitate complex deepwater and ultra-deepwater projects, which are essential for accessing new hydrocarbon reserves.
  • These specialized fleets, equipped with advanced technologies like J-lay barges and S-lay barges, are the linchpins of offshore infrastructure development. In a typical business scenario, an energy firm planning a new subsea field development must evaluate vessel capabilities for flexible pipe installation and rigid pipe installation to optimize capital expenditure and long-term operational costs.
  • Success hinges on selecting operators whose assets align with the project's specific geological and environmental challenges. Furthermore, the market's scope is expanding to include services for the offshore wind and carbon capture sectors, requiring the installation of subsea power cables and CO2 transport pipelines, underscoring the versatile and critical role of pipelay vessels in the evolving energy landscape.
  • This diversification is crucial as the industry navigates a complex future, balancing conventional energy needs with sustainable development goals.

What will be the Size of the Pipelay Vessel Operator Market during the forecast period?

Get Key Insights on Market Forecast (PDF) Request Free Sample

How is the Pipelay Vessel Operator Market Segmented?

The pipelay vessel operator industry research report provides comprehensive data (region-wise segment analysis), with forecasts and estimates in "USD million" for the period 2026-2030, as well as historical data from 2020-2024 for the following segments.

  • Product
    • J lay barges
    • S lay barges
    • Reel barges
  • Application
    • Oil and gas
    • Power
    • Others
  • Type
    • Shallow water operations
    • Deep water operations
  • Geography
    • APAC
      • China
      • Japan
      • India
    • Europe
      • UK
      • Germany
      • France
    • North America
      • US
      • Canada
      • Mexico
    • Middle East and Africa
      • Saudi Arabia
      • South Africa
      • UAE
    • South America
      • Brazil
      • Argentina
      • Colombia
    • Rest of World (ROW)

By Product Insights

The j lay barges segment is estimated to witness significant growth during the forecast period.

J-lay barges represent a critical asset for deepwater drilling projects, designed for subsea pipeline repair techniques in hostile environments.

This method, involving a nearly vertical pipe ramp, is essential for ultra-deepwater drilling and subsea construction, minimizing bending stress and enhancing pipeline integrity management.

The technique reduces pipe fatigue during offshore pipeline installation by up to 25% compared to other methods.

As upstream oil and gas companies push into more challenging deepwater basin exploration, the demand for vessels capable of this precise, albeit slower, installation process grows.

This segment's evolution is driven by the need for reliable infrastructure to support both deepwater hydrocarbon developments and emerging offshore renewable energy projects, requiring robust solutions for subsea infrastructure development.

Request Free Sample

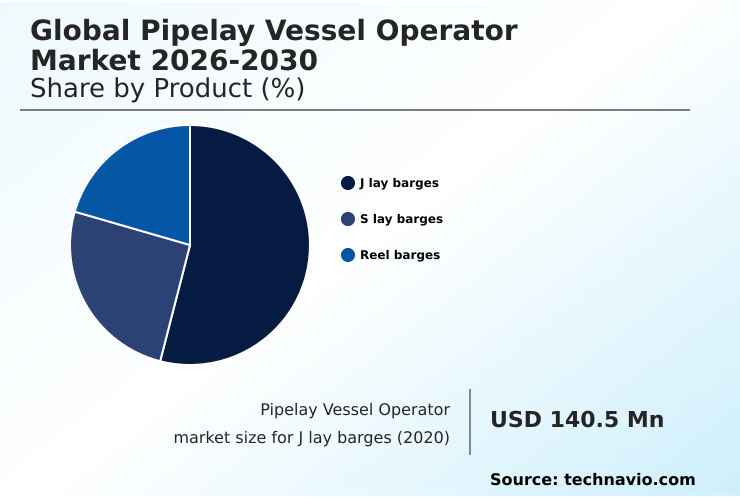
The J lay barges segment was valued at USD 160.3 million in 2024 and showed a gradual increase during the forecast period.

Request Free Sample

Regional Analysis

APAC is estimated to contribute 52.6% to the growth of the global market during the forecast period.Technavio’s analysts have elaborately explained the regional trends and drivers that shape the market during the forecast period.

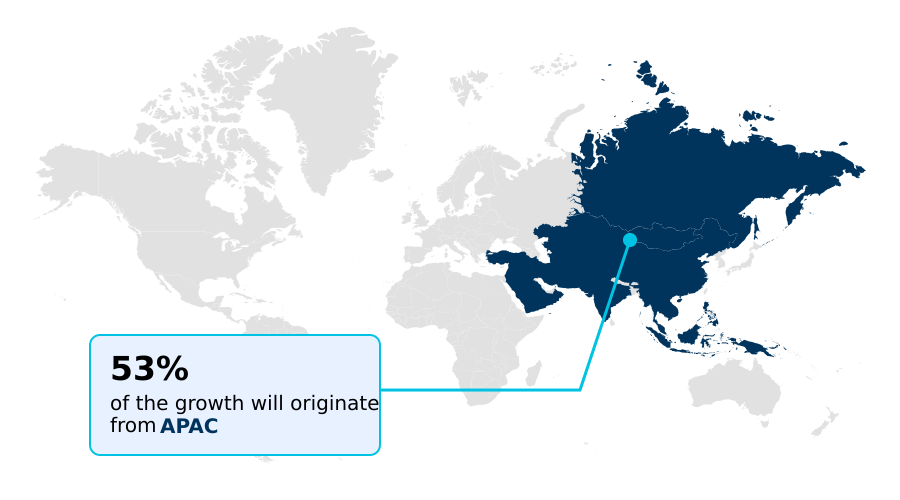
See How Pipelay Vessel Operator Market Demand is Rising in APAC Request Free Sample

The geographic landscape is dominated by deepwater activity in regions like South America and West Africa, which together account for over 52% of new large-scale project sanctions.

Concurrently, APAC is the fastest-growing region, driven by offshore block liberalization and new greenfield well exploration. The global energy transition is reshaping demand, with European offshore wind farm installation projects now comprising a significant market segment.

This shift requires operators to adapt fleets for subsea cable laying alongside traditional offshore platform installation. Subsea tie-back projects in mature basins like the North Sea and Gulf of Mexico provide consistent demand, focusing on maximizing existing offshore energy infrastructure.

Investment in carbon capture infrastructure is creating new opportunities, particularly in North America and Europe.

Market Dynamics

Our researchers analyzed the data with 2025 as the base year, along with the key drivers, trends, and challenges. A holistic analysis of drivers will help companies refine their marketing strategies to gain a competitive advantage.

  • Strategic planning in the global pipelay vessel operator market 2026-2030 requires a deep understanding of multiple operational variables. When evaluating deepwater pipeline installation methods, decision-makers must weigh s-lay versus j-lay efficiency for specific project depths and conditions.
  • The overall cost of pipelay vessel operations is a critical factor, influenced heavily by the sophistication of the pipelay vessel dynamic positioning and onboard systems. As the industry evolves, the role of a pipelay vessel for renewable energy, particularly for cable laying, is becoming a significant revenue stream.
  • Concurrently, developing robust subsea pipeline repair techniques and effective offshore pipeline corrosion protection strategies are essential for asset longevity. Projects incorporating flexible pipe installation in deepwater often achieve faster completion times than those using rigid pipes. Technological innovations in pipelay vessels, such as integrating automation in pipelay operations and advanced remote monitoring for pipelay vessels, are key differentiators.
  • Proactive compliance in offshore pipeline projects and stringent safety protocols for pipelay operations are non-negotiable. Furthermore, a focus on reducing operational costs in pipelaying is paramount. As projects become more complex, the environmental impact of subsea pipelines is under greater scrutiny, influencing vessel selection.
  • Finally, providing high-quality training for pipelay vessel crew ensures both safety and efficiency, as the reel-lay method for small pipelines and pipelay support vessel specifications become more specialized.

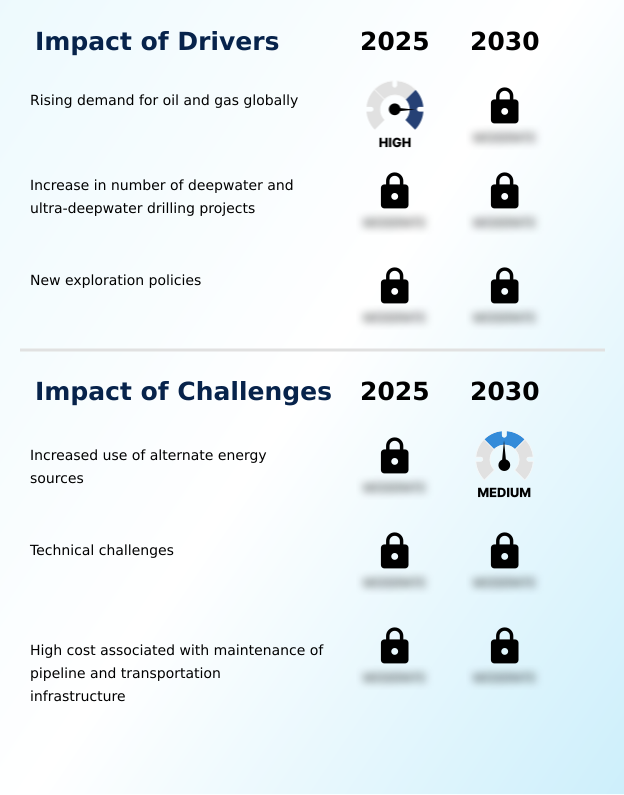
What are the key market drivers leading to the rise in the adoption of Pipelay Vessel Operator Industry?

  • The rising global demand for oil and gas serves as a key market driver, stimulating investment in exploration and production infrastructure.

  • Rising global energy demand and a renewed focus on energy security initiatives are primary market drivers. The increase in deepwater and ultra-deepwater drilling projects, particularly in pre-salt field development zones, creates sustained demand for high-specification vessels.
  • Favorable hydrocarbon exploration policies and the liberalization of offshore blocks have accelerated exploration timelines by over 15% in certain regions. This has led to a surge in greenfield well exploration and subsea tie-back projects, requiring extensive offshore pipeline installation.
  • The strategic importance of liquefied natural gas (LNG) transport is also fueling investments in related subsea infrastructure.
  • These factors collectively propel the need for advanced pipelay fleets capable of supporting large-scale offshore construction campaigns and ensuring the integrity of new and mature oilfield life extension projects.

What are the market trends shaping the Pipelay Vessel Operator Industry?

  • The increasing integration of automation within the oil and gas industry is a notable upcoming market trend, enhancing operational efficiency and safety.

  • The market is witnessing a significant trend towards automation and digitalization to enhance project execution. The adoption of the Internet of Things (IoT) in midstream oil and gas operations allows for real-time monitoring of pipelaying activities, with some operators reporting a 20% reduction in equipment downtime through predictive maintenance.
  • This integration of technology facilitates more efficient decommissioning operations and pipeline replacement programs. Technological innovations boosting productivity are evident in new vessel designs that combine J-lay and reel-lay capabilities, improving operational flexibility. Furthermore, the use of advanced analytics in subsea project management optimizes vessel deployment and logistics, leading to project cost savings of up to 12%.
  • These advancements are critical as operators expand into floating offshore wind technology and more complex subsea electrical interconnectors.

What challenges does the Pipelay Vessel Operator Industry face during its growth?

  • The growing adoption of alternative energy sources presents a significant challenge to the industry's growth trajectory.

  • Operators face significant challenges from the increasing use of alternative energy sources, which diverts investment from traditional hydrocarbon projects. Technical challenges associated with harsh environment operations and deepwater pipeline installation methods persist, with unexpected geological conditions contributing to project cost overruns in 1 out of every 5 deepwater projects.
  • The high cost of pipeline maintenance and infrastructure, coupled with stringent environmental regulations, puts pressure on margins. Moreover, the industry grapples with a shortage of skilled labor proficient in managing new technologies, which can impede the adoption of efficiency-gaining systems.
  • Navigating complex local content requirements and geopolitical risks in key operational regions further complicates offshore supply chain logistics and project financing, making risk management a critical competency.

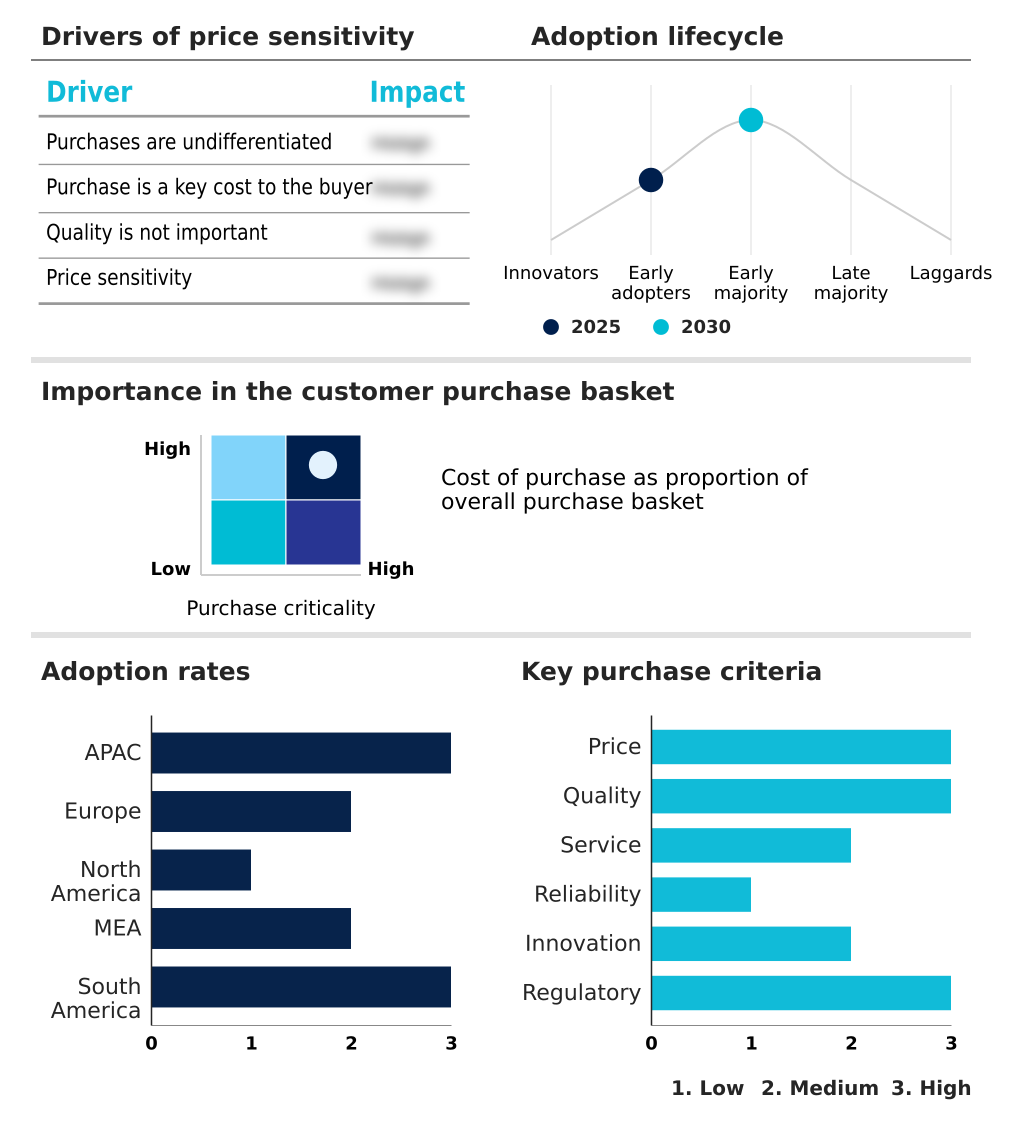
Exclusive Technavio Analysis on Customer Landscape

The pipelay vessel operator market forecasting report includes the adoption lifecycle of the market, covering from the innovator’s stage to the laggard’s stage. It focuses on adoption rates in different regions based on penetration. Furthermore, the pipelay vessel operator market report also includes key purchase criteria and drivers of price sensitivity to help companies evaluate and develop their market growth analysis strategies.

Customer Landscape of Pipelay Vessel Operator Industry

Competitive Landscape

Companies are implementing various strategies, such as strategic alliances, pipelay vessel operator market forecast, partnerships, mergers and acquisitions, geographical expansion, and product/service launches, to enhance their presence in the industry.

Allseas Group SA - Delivers engineering-led offshore construction solutions, integrating automation and IoT technologies to optimize pipeline installation efficiency and project safety.

The industry research and growth report includes detailed analyses of the competitive landscape of the market and information about key companies, including:

  • Allseas Group SA
  • Boskalis
  • BOURBON Maritime
  • CIMIC Group
  • Hanwha Group
  • Havila Shipping ASA
  • Hyundai Heavy Industries Group
  • John Swire and Sons Ltd.
  • McDermott International Ltd.
  • New DOF ASA
  • Royal IHC
  • Saipem S.p.A.
  • Siem Offshore Inc.
  • Subsea 7 SA
  • TechnipFMC plc
  • Tidewater Inc.
  • Van Oord nv

Qualitative and quantitative analysis of companies has been conducted to help clients understand the wider business environment as well as the strengths and weaknesses of key industry players. Data is qualitatively analyzed to categorize companies as pure play, category-focused, industry-focused, and diversified; it is quantitatively analyzed to categorize companies as dominant, leading, strong, tentative, and weak.

Recent Development and News in Pipelay vessel operator market

  • In September, 2024, Allseas Group SA announced the commissioning of a new vessel featuring advanced automated welding systems and enhanced dynamic positioning, designed to reduce installation times for deepwater projects.
  • In November, 2024, Subsea 7 SA secured a major SURF contract from Petrobras for the development of a pre-salt field offshore Brazil, valued at approximately $900 million.
  • In February, 2025, TechnipFMC plc and Saipem S.p.A. formed a strategic joint venture to deliver integrated engineering, procurement, construction, and installation services for offshore carbon capture and storage (CCS) pipeline projects globally.
  • In April, 2025, McDermott International Ltd. announced the successful completion of a complex pipeline installation project in the US Gulf of Mexico, utilizing innovative remote monitoring technologies that improved project efficiency by 15%.

Dive into Technavio’s robust research methodology, blending expert interviews, extensive data synthesis, and validated models for unparalleled Pipelay Vessel Operator Market insights. See full methodology.

Market Scope
Page number 292
Base year 2025
Historic period 2020-2024
Forecast period 2026-2030
Growth momentum & CAGR Accelerate at a CAGR of 4%
Market growth 2026-2030 USD 66.6 million
Market structure Fragmented
YoY growth 2025-2026(%) 3.9%
Key countries China, Japan, India, South Korea, Australia, Indonesia, UK, Germany, France, Italy, Spain, The Netherlands, US, Canada, Mexico, Saudi Arabia, South Africa, UAE, Turkey, Israel, Brazil, Argentina and Colombia
Competitive landscape Leading Companies, Market Positioning of Companies, Competitive Strategies, and Industry Risks

Request Free Sample

Research Analyst Overview

  • The pipelay vessel operator market is defined by high-capital assets and specialized technical expertise. Fleets are differentiated by their core systems, including J-lay barges, S-lay barges, and reel barges, which are deployed for shallow water operations or deep water operations based on project requirements.
  • The effectiveness of these assets hinges on components like pipe tensioning systems, automated welding systems, and stinger fabrication. For boardroom decisions, the choice between mobilizing pipelay support vessels (PLSVs) for complex deepwater drilling projects versus utilizing derrick lay barges for more conventional offshore platform installation represents a significant capital allocation choice.
  • Advanced operators are integrating remotely operated vehicles (ROVs) and wellhead protection systems to mitigate risk in ultra-deepwater drilling. Fleets with advanced dive support vessels capable of executing complex subsea production systems and mooring systems installations achieve a capital efficiency improvement of up to 10% on large-scale projects.
  • The market's trajectory is increasingly influenced by subsea infrastructure development for both hydrocarbon and renewable energy, demanding proficiency in subsea umbilicals risers and flowlines (SURF), flexible pipe installation, and rigid pipe installation.

What are the Key Data Covered in this Pipelay Vessel Operator Market Research and Growth Report?

  • What is the expected growth of the Pipelay Vessel Operator Market between 2026 and 2030?

    • USD 66.6 million, at a CAGR of 4%

  • What segmentation does the market report cover?

    • The report is segmented by Product (J lay barges, S lay barges, and Reel barges), Application (Oil and gas, Power, and Others), Type (Shallow water operations, and Deep water operations) and Geography (APAC, Europe, North America, Middle East and Africa, South America)

  • Which regions are analyzed in the report?

    • APAC, Europe, North America, Middle East and Africa and South America

  • What are the key growth drivers and market challenges?

    • Rising demand for oil and gas globally, Increased use of alternate energy sources

  • Who are the major players in the Pipelay Vessel Operator Market?

    • Allseas Group SA, Boskalis, BOURBON Maritime, CIMIC Group, Hanwha Group, Havila Shipping ASA, Hyundai Heavy Industries Group, John Swire and Sons Ltd., McDermott International Ltd., New DOF ASA, Royal IHC, Saipem S.p.A., Siem Offshore Inc., Subsea 7 SA, TechnipFMC plc, Tidewater Inc. and Van Oord nv

Market Research Insights

  • The market is shaped by a dynamic interplay between deepwater E&P investment and the expanding needs of the energy transition. The execution of brownfield project execution and subsea infrastructure inspection, repair, and maintenance (IRM) provides a stable demand floor. Operators employing advanced subsea project management methodologies see up to a 15% reduction in project schedule overruns compared to traditional approaches.
  • As national oil companies (NOCs) and international oil companies (IOCs) pursue harsh environment operations, vessels with superior dynamic positioning systems command premium charter rates, reflecting a market where technological capability directly translates to commercial advantage.
  • Moreover, adherence to stringent local content requirements can improve contract win rates by over 20% in key developing markets, highlighting the importance of strategic regional partnerships in the offshore supply chain logistics.

We can help! Our analysts can customize this pipelay vessel operator market research report to meet your requirements.

Get in touch

1. Executive Summary

1.1 Market overview

Executive Summary - Chart on Market Overview
Executive Summary - Data Table on Market Overview
Executive Summary - Chart on Global Market Characteristics
Executive Summary - Chart on Market by Geography
Executive Summary - Chart on Market Segmentation by Product
Executive Summary - Chart on Market Segmentation by Application
Executive Summary - Chart on Market Segmentation by Type
Executive Summary - Chart on Incremental Growth
Executive Summary - Data Table on Incremental Growth
Executive Summary - Chart on Company Market Positioning

2. Technavio Analysis

2.1 Analysis of price sensitivity, lifecycle, customer purchase basket, adoption rates, and purchase criteria

2.2 Criticality of inputs and Factors of differentiation

Chart on Overview on criticality of inputs and factors of differentiation

2.3 Factors of disruption

Chart on Overview on factors of disruption

2.4 Impact of drivers and challenges

Chart on Impact of drivers and challenges in 2025 and 2030

3. Market Landscape

3.1 Market ecosystem

Chart on Parent Market
Data Table on - Parent Market

3.2 Market characteristics

Chart on Market characteristics analysis

3.3 Value chain analysis

Chart on Value chain analysis

4. Market Sizing

4.1 Market definition

Data Table on Offerings of companies included in the market definition

4.2 Market segment analysis

Market segments

4.3 Market size 2025

4.4 Market outlook: Forecast for 2025-2030

Chart on Global - Market size and forecast 2025-2030 ($ million)
Data Table on Global - Market size and forecast 2025-2030 ($ million)
Chart on Global Market: Year-over-year growth 2025-2030 (%)
Data Table on Global Market: Year-over-year growth 2025-2030 (%)

5. Historic Market Size

5.1 Global Pipelay Vessel Operator Market 2020 - 2024

Historic Market Size - Data Table on Global Pipelay Vessel Operator Market 2020 - 2024 ($ million)

5.2 Product segment analysis 2020 - 2024

Historic Market Size - Product Segment 2020 - 2024 ($ million)

5.3 Application segment analysis 2020 - 2024

Historic Market Size - Application Segment 2020 - 2024 ($ million)

5.4 Type segment analysis 2020 - 2024

Historic Market Size - Type Segment 2020 - 2024 ($ million)

5.5 Geography segment analysis 2020 - 2024

Historic Market Size - Geography Segment 2020 - 2024 ($ million)

5.6 Country segment analysis 2020 - 2024

Historic Market Size - Country Segment 2020 - 2024 ($ million)

6. Qualitative Analysis

6.1 The AI impact on Global Pipelay Vessel Operator Market

7. Five Forces Analysis

7.1 Five forces summary

Five forces analysis - Comparison between 2025 and 2030

7.2 Bargaining power of buyers

Bargaining power of buyers - Impact of key factors 2025 and 2030

7.3 Bargaining power of suppliers

Bargaining power of suppliers - Impact of key factors in 2025 and 2030

7.4 Threat of new entrants

Threat of new entrants - Impact of key factors in 2025 and 2030

7.5 Threat of substitutes

Threat of substitutes - Impact of key factors in 2025 and 2030

7.6 Threat of rivalry

Threat of rivalry - Impact of key factors in 2025 and 2030

7.7 Market condition

Chart on Market condition - Five forces 2025 and 2030

8. Market Segmentation by Product

8.1 Market segments

Chart on Product - Market share 2025-2030 (%)
Data Table on Product - Market share 2025-2030 (%)

8.2 Comparison by Product

Chart on Comparison by Product
Data Table on Comparison by Product

8.3 J lay barges - Market size and forecast 2025-2030

Chart on J lay barges - Market size and forecast 2025-2030 ($ million)
Data Table on J lay barges - Market size and forecast 2025-2030 ($ million)
Chart on J lay barges - Year-over-year growth 2025-2030 (%)
Data Table on J lay barges - Year-over-year growth 2025-2030 (%)

8.4 S lay barges - Market size and forecast 2025-2030

Chart on S lay barges - Market size and forecast 2025-2030 ($ million)
Data Table on S lay barges - Market size and forecast 2025-2030 ($ million)
Chart on S lay barges - Year-over-year growth 2025-2030 (%)
Data Table on S lay barges - Year-over-year growth 2025-2030 (%)

8.5 Reel barges - Market size and forecast 2025-2030

Chart on Reel barges - Market size and forecast 2025-2030 ($ million)
Data Table on Reel barges - Market size and forecast 2025-2030 ($ million)
Chart on Reel barges - Year-over-year growth 2025-2030 (%)
Data Table on Reel barges - Year-over-year growth 2025-2030 (%)

8.6 Market opportunity by Product

Market opportunity by Product ($ million)
Data Table on Market opportunity by Product ($ million)

9. Market Segmentation by Application

9.1 Market segments

Chart on Application - Market share 2025-2030 (%)
Data Table on Application - Market share 2025-2030 (%)

9.2 Comparison by Application

Chart on Comparison by Application
Data Table on Comparison by Application

9.3 Oil and gas - Market size and forecast 2025-2030

Chart on Oil and gas - Market size and forecast 2025-2030 ($ million)
Data Table on Oil and gas - Market size and forecast 2025-2030 ($ million)
Chart on Oil and gas - Year-over-year growth 2025-2030 (%)
Data Table on Oil and gas - Year-over-year growth 2025-2030 (%)

9.4 Power - Market size and forecast 2025-2030

Chart on Power - Market size and forecast 2025-2030 ($ million)
Data Table on Power - Market size and forecast 2025-2030 ($ million)
Chart on Power - Year-over-year growth 2025-2030 (%)
Data Table on Power - Year-over-year growth 2025-2030 (%)

9.5 Others - Market size and forecast 2025-2030

Chart on Others - Market size and forecast 2025-2030 ($ million)
Data Table on Others - Market size and forecast 2025-2030 ($ million)
Chart on Others - Year-over-year growth 2025-2030 (%)
Data Table on Others - Year-over-year growth 2025-2030 (%)

9.6 Market opportunity by Application

Market opportunity by Application ($ million)
Data Table on Market opportunity by Application ($ million)

10. Market Segmentation by Type

10.1 Market segments

Chart on Type - Market share 2025-2030 (%)
Data Table on Type - Market share 2025-2030 (%)

10.2 Comparison by Type

Chart on Comparison by Type
Data Table on Comparison by Type

10.3 Shallow water operations - Market size and forecast 2025-2030

Chart on Shallow water operations - Market size and forecast 2025-2030 ($ million)
Data Table on Shallow water operations - Market size and forecast 2025-2030 ($ million)
Chart on Shallow water operations - Year-over-year growth 2025-2030 (%)
Data Table on Shallow water operations - Year-over-year growth 2025-2030 (%)

10.4 Deep water operations - Market size and forecast 2025-2030

Chart on Deep water operations - Market size and forecast 2025-2030 ($ million)
Data Table on Deep water operations - Market size and forecast 2025-2030 ($ million)
Chart on Deep water operations - Year-over-year growth 2025-2030 (%)
Data Table on Deep water operations - Year-over-year growth 2025-2030 (%)

10.5 Market opportunity by Type

Market opportunity by Type ($ million)
Data Table on Market opportunity by Type ($ million)

11. Customer Landscape

11.1 Customer landscape overview

Analysis of price sensitivity, lifecycle, customer purchase basket, adoption rates, and purchase criteria

12. Geographic Landscape

12.1 Geographic segmentation

Chart on Market share by geography 2025-2030 (%)
Data Table on Market share by geography 2025-2030 (%)

12.2 Geographic comparison

Chart on Geographic comparison
Data Table on Geographic comparison

12.3 APAC - Market size and forecast 2025-2030

Chart on APAC - Market size and forecast 2025-2030 ($ million)
Data Table on APAC - Market size and forecast 2025-2030 ($ million)
Chart on APAC - Year-over-year growth 2025-2030 (%)
Data Table on APAC - Year-over-year growth 2025-2030 (%)
Chart on Regional Comparison - APAC
Data Table on Regional Comparison - APAC

12.3.1 China - Market size and forecast 2025-2030

Chart on China - Market size and forecast 2025-2030 ($ million)
Data Table on China - Market size and forecast 2025-2030 ($ million)
Chart on China - Year-over-year growth 2025-2030 (%)
Data Table on China - Year-over-year growth 2025-2030 (%)

12.3.2 Japan - Market size and forecast 2025-2030

Chart on Japan - Market size and forecast 2025-2030 ($ million)
Data Table on Japan - Market size and forecast 2025-2030 ($ million)
Chart on Japan - Year-over-year growth 2025-2030 (%)
Data Table on Japan - Year-over-year growth 2025-2030 (%)

12.3.3 India - Market size and forecast 2025-2030

Chart on India - Market size and forecast 2025-2030 ($ million)
Data Table on India - Market size and forecast 2025-2030 ($ million)
Chart on India - Year-over-year growth 2025-2030 (%)
Data Table on India - Year-over-year growth 2025-2030 (%)

12.3.4 South Korea - Market size and forecast 2025-2030

Chart on South Korea - Market size and forecast 2025-2030 ($ million)
Data Table on South Korea - Market size and forecast 2025-2030 ($ million)
Chart on South Korea - Year-over-year growth 2025-2030 (%)
Data Table on South Korea - Year-over-year growth 2025-2030 (%)

12.3.5 Australia - Market size and forecast 2025-2030

Chart on Australia - Market size and forecast 2025-2030 ($ million)
Data Table on Australia - Market size and forecast 2025-2030 ($ million)
Chart on Australia - Year-over-year growth 2025-2030 (%)
Data Table on Australia - Year-over-year growth 2025-2030 (%)

12.3.6 Indonesia - Market size and forecast 2025-2030

Chart on Indonesia - Market size and forecast 2025-2030 ($ million)
Data Table on Indonesia - Market size and forecast 2025-2030 ($ million)
Chart on Indonesia - Year-over-year growth 2025-2030 (%)
Data Table on Indonesia - Year-over-year growth 2025-2030 (%)

12.4 Europe - Market size and forecast 2025-2030

Chart on Europe - Market size and forecast 2025-2030 ($ million)
Data Table on Europe - Market size and forecast 2025-2030 ($ million)
Chart on Europe - Year-over-year growth 2025-2030 (%)
Data Table on Europe - Year-over-year growth 2025-2030 (%)
Chart on Regional Comparison - Europe
Data Table on Regional Comparison - Europe

12.4.1 UK - Market size and forecast 2025-2030

Chart on UK - Market size and forecast 2025-2030 ($ million)
Data Table on UK - Market size and forecast 2025-2030 ($ million)
Chart on UK - Year-over-year growth 2025-2030 (%)
Data Table on UK - Year-over-year growth 2025-2030 (%)

12.4.2 Germany - Market size and forecast 2025-2030

Chart on Germany - Market size and forecast 2025-2030 ($ million)
Data Table on Germany - Market size and forecast 2025-2030 ($ million)
Chart on Germany - Year-over-year growth 2025-2030 (%)
Data Table on Germany - Year-over-year growth 2025-2030 (%)

12.4.3 France - Market size and forecast 2025-2030

Chart on France - Market size and forecast 2025-2030 ($ million)
Data Table on France - Market size and forecast 2025-2030 ($ million)
Chart on France - Year-over-year growth 2025-2030 (%)
Data Table on France - Year-over-year growth 2025-2030 (%)

12.4.4 Italy - Market size and forecast 2025-2030

Chart on Italy - Market size and forecast 2025-2030 ($ million)
Data Table on Italy - Market size and forecast 2025-2030 ($ million)
Chart on Italy - Year-over-year growth 2025-2030 (%)
Data Table on Italy - Year-over-year growth 2025-2030 (%)

12.4.5 Spain - Market size and forecast 2025-2030

Chart on Spain - Market size and forecast 2025-2030 ($ million)
Data Table on Spain - Market size and forecast 2025-2030 ($ million)
Chart on Spain - Year-over-year growth 2025-2030 (%)
Data Table on Spain - Year-over-year growth 2025-2030 (%)

12.4.6 The Netherlands - Market size and forecast 2025-2030

Chart on The Netherlands - Market size and forecast 2025-2030 ($ million)
Data Table on The Netherlands - Market size and forecast 2025-2030 ($ million)
Chart on The Netherlands - Year-over-year growth 2025-2030 (%)
Data Table on The Netherlands - Year-over-year growth 2025-2030 (%)

12.5 North America - Market size and forecast 2025-2030

Chart on North America - Market size and forecast 2025-2030 ($ million)
Data Table on North America - Market size and forecast 2025-2030 ($ million)
Chart on North America - Year-over-year growth 2025-2030 (%)
Data Table on North America - Year-over-year growth 2025-2030 (%)
Chart on Regional Comparison - North America
Data Table on Regional Comparison - North America

12.5.1 US - Market size and forecast 2025-2030

Chart on US - Market size and forecast 2025-2030 ($ million)
Data Table on US - Market size and forecast 2025-2030 ($ million)
Chart on US - Year-over-year growth 2025-2030 (%)
Data Table on US - Year-over-year growth 2025-2030 (%)

12.5.2 Canada - Market size and forecast 2025-2030

Chart on Canada - Market size and forecast 2025-2030 ($ million)
Data Table on Canada - Market size and forecast 2025-2030 ($ million)
Chart on Canada - Year-over-year growth 2025-2030 (%)
Data Table on Canada - Year-over-year growth 2025-2030 (%)

12.5.3 Mexico - Market size and forecast 2025-2030

Chart on Mexico - Market size and forecast 2025-2030 ($ million)
Data Table on Mexico - Market size and forecast 2025-2030 ($ million)
Chart on Mexico - Year-over-year growth 2025-2030 (%)
Data Table on Mexico - Year-over-year growth 2025-2030 (%)

12.6 Middle East and Africa - Market size and forecast 2025-2030

Chart on Middle East and Africa - Market size and forecast 2025-2030 ($ million)
Data Table on Middle East and Africa - Market size and forecast 2025-2030 ($ million)
Chart on Middle East and Africa - Year-over-year growth 2025-2030 (%)
Data Table on Middle East and Africa - Year-over-year growth 2025-2030 (%)
Chart on Regional Comparison - Middle East and Africa
Data Table on Regional Comparison - Middle East and Africa

12.6.1 Saudi Arabia - Market size and forecast 2025-2030

Chart on Saudi Arabia - Market size and forecast 2025-2030 ($ million)
Data Table on Saudi Arabia - Market size and forecast 2025-2030 ($ million)
Chart on Saudi Arabia - Year-over-year growth 2025-2030 (%)
Data Table on Saudi Arabia - Year-over-year growth 2025-2030 (%)

12.6.2 South Africa - Market size and forecast 2025-2030

Chart on South Africa - Market size and forecast 2025-2030 ($ million)
Data Table on South Africa - Market size and forecast 2025-2030 ($ million)
Chart on South Africa - Year-over-year growth 2025-2030 (%)
Data Table on South Africa - Year-over-year growth 2025-2030 (%)

12.6.3 UAE - Market size and forecast 2025-2030

Chart on UAE - Market size and forecast 2025-2030 ($ million)
Data Table on UAE - Market size and forecast 2025-2030 ($ million)
Chart on UAE - Year-over-year growth 2025-2030 (%)
Data Table on UAE - Year-over-year growth 2025-2030 (%)

12.6.4 Turkey - Market size and forecast 2025-2030

Chart on Turkey - Market size and forecast 2025-2030 ($ million)
Data Table on Turkey - Market size and forecast 2025-2030 ($ million)
Chart on Turkey - Year-over-year growth 2025-2030 (%)
Data Table on Turkey - Year-over-year growth 2025-2030 (%)

12.6.5 Israel - Market size and forecast 2025-2030

Chart on Israel - Market size and forecast 2025-2030 ($ million)
Data Table on Israel - Market size and forecast 2025-2030 ($ million)
Chart on Israel - Year-over-year growth 2025-2030 (%)
Data Table on Israel - Year-over-year growth 2025-2030 (%)

12.7 South America - Market size and forecast 2025-2030

Chart on South America - Market size and forecast 2025-2030 ($ million)
Data Table on South America - Market size and forecast 2025-2030 ($ million)
Chart on South America - Year-over-year growth 2025-2030 (%)
Data Table on South America - Year-over-year growth 2025-2030 (%)
Chart on Regional Comparison - South America
Data Table on Regional Comparison - South America

12.7.1 Brazil - Market size and forecast 2025-2030

Chart on Brazil - Market size and forecast 2025-2030 ($ million)
Data Table on Brazil - Market size and forecast 2025-2030 ($ million)
Chart on Brazil - Year-over-year growth 2025-2030 (%)
Data Table on Brazil - Year-over-year growth 2025-2030 (%)

12.7.2 Argentina - Market size and forecast 2025-2030

Chart on Argentina - Market size and forecast 2025-2030 ($ million)
Data Table on Argentina - Market size and forecast 2025-2030 ($ million)
Chart on Argentina - Year-over-year growth 2025-2030 (%)
Data Table on Argentina - Year-over-year growth 2025-2030 (%)

12.7.3 Colombia - Market size and forecast 2025-2030

Chart on Colombia - Market size and forecast 2025-2030 ($ million)
Data Table on Colombia - Market size and forecast 2025-2030 ($ million)
Chart on Colombia - Year-over-year growth 2025-2030 (%)
Data Table on Colombia - Year-over-year growth 2025-2030 (%)

12.8 Market opportunity by geography

Market opportunity by geography ($ million)
Data Tables on Market opportunity by geography ($ million)

13. Drivers, Challenges, and Opportunity

13.1 Market drivers

Rising demand for oil and gas globally
Increase in number of deepwater and ultra-deepwater drilling projects
New exploration policies

13.2 Market challenges

Increased use of alternate energy sources
Technical challenges
High cost associated with maintenance of pipeline and transportation infrastructure

13.3 Impact of drivers and challenges

Impact of drivers and challenges in 2025 and 2030

13.4 Market opportunities

Increase in automation in oil and gas industry
Increased adoption of IoT in midstream oil and gas operations
Technological innovations boosting productivity in oilfield services market

14. Competitive Landscape

14.1 Overview

14.2

Overview on criticality of inputs and factors of differentiation

14.3 Landscape disruption

Overview on factors of disruption

14.4 Industry risks

Impact of key risks on business

15. Competitive Analysis

15.1 Companies profiled

Companies covered

15.2 Company ranking index

15.3 Market positioning of companies

Matrix on companies position and classification

15.4 Allseas Group SA

Allseas Group SA - Overview
Allseas Group SA - Product / Service
Allseas Group SA - Key offerings
SWOT

15.5 Boskalis

Boskalis - Overview
Boskalis - Product / Service
Boskalis - Key offerings
SWOT

15.6 BOURBON Maritime

BOURBON Maritime - Overview
BOURBON Maritime - Product / Service
BOURBON Maritime - Key offerings
SWOT

15.7 CIMIC Group

CIMIC Group - Overview
CIMIC Group - Product / Service
CIMIC Group - Key offerings
SWOT

15.8 Hanwha Group

Hanwha Group - Overview
Hanwha Group - Product / Service
Hanwha Group - Key news
Hanwha Group - Key offerings
SWOT

15.9 Havila Shipping ASA

Havila Shipping ASA - Overview
Havila Shipping ASA - Product / Service
Havila Shipping ASA - Key offerings
SWOT

15.10 Hyundai Heavy Industries Group

Hyundai Heavy Industries Group - Overview
Hyundai Heavy Industries Group - Product / Service
Hyundai Heavy Industries Group - Key offerings
SWOT

15.11 John Swire and Sons Ltd.

John Swire and Sons Ltd. - Overview
John Swire and Sons Ltd. - Product / Service
John Swire and Sons Ltd. - Key offerings
SWOT

15.12 McDermott International Ltd.

McDermott International Ltd. - Overview
McDermott International Ltd. - Product / Service
McDermott International Ltd. - Key offerings
SWOT

15.13 New DOF ASA

New DOF ASA - Overview
New DOF ASA - Product / Service
New DOF ASA - Key offerings
SWOT

15.14 Royal IHC

Royal IHC - Overview
Royal IHC - Product / Service
Royal IHC - Key offerings
SWOT

15.15 Saipem S.p.A.

Saipem S.p.A. - Overview
Saipem S.p.A. - Business segments
Saipem S.p.A. - Key offerings
Saipem S.p.A. - Segment focus
SWOT

15.16 Subsea 7 SA

Subsea 7 SA - Overview
Subsea 7 SA - Business segments
Subsea 7 SA - Key offerings
Subsea 7 SA - Segment focus
SWOT

15.17 TechnipFMC plc

TechnipFMC plc - Overview
TechnipFMC plc - Business segments
TechnipFMC plc - Key news
TechnipFMC plc - Key offerings
TechnipFMC plc - Segment focus
SWOT

15.18 Van Oord nv

Van Oord nv - Overview
Van Oord nv - Product / Service
Van Oord nv - Key offerings
SWOT

16. Appendix

16.1 Scope of the report

Market definition
Objectives
Notes and caveats

16.2 Inclusions and exclusions checklist

Inclusions checklist
Exclusions checklist

16.3 Currency conversion rates for US$

16.4 Research methodology

16.5 Data procurement

Information sources

16.6 Data validation

16.7 Validation techniques employed for market sizing

16.8 Data synthesis

16.9 360 degree market analysis

16.10 List of abbreviations

Research Methodology

Technavio presents a detailed picture of the market by way of study, synthesis, and summation of data from multiple sources. The analysts have presented the various facets of the market with a particular focus on identifying the key industry influencers. The data thus presented is comprehensive, reliable, and the result of extensive research, both primary and secondary.

INFORMATION SOURCES

Primary sources

  • Manufacturers and suppliers
  • Channel partners
  • Industry experts
  • Strategic decision makers

Secondary sources

  • Industry journals and periodicals
  • Government data
  • Financial reports of key industry players
  • Historical data
  • Press releases

DATA ANALYSIS

Data Synthesis

  • Collation of data
  • Estimation of key figures
  • Analysis of derived insights

Data Validation

  • Triangulation with data models
  • Reference against proprietary databases
  • Corroboration with industry experts

REPORT WRITING

Qualitative

  • Market drivers
  • Market challenges
  • Market trends
  • Five forces analysis

Quantitative

  • Market size and forecast
  • Market segmentation
  • Geographical insights
  • Competitive landscape

Interested in this report?

Get your sample now to see our research methodology and insights!

Download Now

Frequently Asked Questions

Pipelay Vessel Operator market growth will increase by USD 66.6 million during 2026-2030.

The Pipelay Vessel Operator market is expected to grow at a CAGR of 4% during 2026-2030.

Pipelay Vessel Operator market is segmented by Product (J lay barges, S lay barges, Reel barges) Application (Oil and gas, Power, Others) Type (Shallow water operations, Deep water operations)

Allseas Group SA, Boskalis, BOURBON Maritime, CIMIC Group, Hanwha Group, Havila Shipping ASA, Hyundai Heavy Industries Group, John Swire and Sons Ltd., McDermott International Ltd., New DOF ASA, Royal IHC, Saipem S.p.A., Siem Offshore Inc., Subsea 7 SA, TechnipFMC plc, Tidewater Inc., Van Oord nv are a few of the key vendors in the Pipelay Vessel Operator market.

APAC will register the highest growth rate of 52.6% among the other regions. Therefore, the Pipelay Vessel Operator market in APAC is expected to garner significant business opportunities for the vendors during the forecast period.

China, Japan, India, South Korea, Australia, Indonesia, UK, Germany, France, Italy, Spain, The Netherlands, US, Canada, Mexico, Saudi Arabia, South Africa, UAE, Turkey, Israel, Brazil, Argentina, Colombia

  • Rising demand for oil and gas globally is the driving factor this market.

The Pipelay Vessel Operator market vendors should focus on grabbing business opportunities from the Product segment as it accounted for the largest market share in the base year.