Piezoelectric Smart Materials Market Analysis, Size, and Forecast 2025-2029: North America (US and Canada), Europe (France, Germany, and UK), APAC (Australia, China, India, Japan, and South Korea), and Rest of World (ROW)

Piezoelectric Smart Materials Market Analysis, Size, and Forecast 2025-2029:
North America (US and Canada), Europe (France, Germany, and UK), APAC (Australia, China, India, Japan, and South Korea), and Rest of World (ROW)

Published: Aug 2025 217 Pages SKU: IRTNTR76805

Market Overview at a Glance

$832.2 Mn
Market Opportunity
7.7%
CAGR
7.2
YoY growth 2024-2025(%)

Piezoelectric Smart Materials Market Size 2025-2029

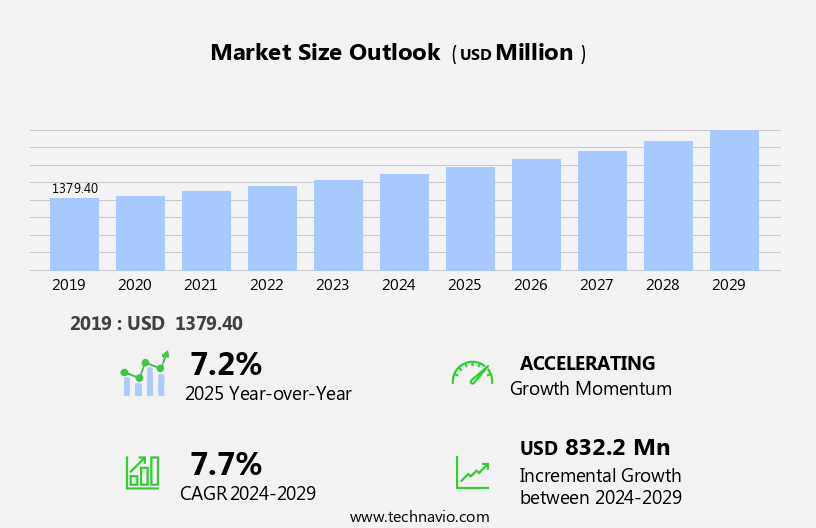
The piezoelectric smart materials market size is forecast to increase by USD 832.2 million, at a CAGR of 7.7% between 2024 and 2029.

  • The market is experiencing significant growth due to the increasing demand for energy-efficient solutions and the expanding utilization of piezoelectric nanomaterials in electronic devices. The energy harvesting capabilities of these materials offer a sustainable approach to powering various devices, making them increasingly attractive to manufacturers and consumers alike. However, the market faces challenges in the form of high manufacturing costs and complexity. The intricate process of producing piezoelectric smart materials necessitates advanced technology and expertise, which can result in higher production costs. Smart structures, such as piezoelectric sensors integrated into buildings and infrastructure, are gaining traction for data acquisition and structural health monitoring.
  • Additionally, the complexity of the manufacturing process can hinder market growth, limiting the number of potential suppliers and increasing the overall cost of the materials. To capitalize on the market opportunities and navigate these challenges effectively, companies must focus on improving manufacturing processes, reducing costs, and collaborating with research institutions to develop innovative applications for piezoelectric smart materials. Piezoelectric nanogenerators, for instance, have emerged as a promising solution for power generation from vibration energy harvesting.

What will be the Size of the Piezoelectric Smart Materials Market during the forecast period?

Piezoelectric Smart Materials Market Size

Get Key Insights on Market Forecast (PDF)
Request Free Sample

  • The market continues to evolve, driven by advancements in material selection and performance metrics. Design optimization and material characterization play crucial roles in enhancing the efficiency of these devices. For example, a bridge sensor network in China reported a 30% increase in data transmission efficiency through wireless sensing. Manufacturing processes, including those for piezoelectric ceramics and films, are undergoing significant improvements to reduce costs and enhance durability.
  • Polymer composites and microelectromechanical systems (MEMS) are also being explored for their potential in actuator technology and sensor integration. The piezoelectric effect, electro-mechanical coupling, and frequency response are key performance metrics for these materials. Strain sensors, precision actuation, and charge generation are essential applications. Nano-structured materials, fatigue testing, and durability testing are critical areas of research to ensure long-term reliability. Industry growth expectations remain strong, with a recent report estimating a 15% compound annual growth rate for the piezoelectric materials market. This dynamic market is poised for continued innovation and applications across various sectors.

How is this Piezoelectric Smart Materials Industry segmented?

The piezoelectric smart materials industry research report provides comprehensive data (region-wise segment analysis), with forecasts and estimates in "USD million" for the period 2025-2029, as well as historical data from 2019-2023 for the following segments.

  • Type
    • Ceramics
    • Composites
    • Polymers
  • Application
    • Actuators and motors
    • Transducers
    • Sensors
    • Structural materials
    • Others
  • End-user
    • Automotive
    • Aerospace and defense
    • Healthcare
    • Consumer electronics
  • Geography
    • North America
      • US
      • Canada
    • Europe
      • France
      • Germany
      • UK
    • APAC
      • Australia
      • China
      • India
      • Japan
      • South Korea
    • Rest of World (ROW)

By Type Insights

The Ceramics segment is estimated to witness significant growth during the forecast period. Piezoelectric smart materials, a significant segment in the materials science industry, are gaining traction due to their unique electro-mechanical properties. Ceramics, a major category within this market, are valued for their versatility and extensive applications. Lead zirconate titanate (PZT) ceramics, a popular choice, boasts a high electrochemical coupling coefficient and dielectric constant, making it an optimal material for sensors, actuators, transducers, and energy recovery applications. Industries such as aeronautics, consumer electronics and healthcare, and telecommunications extensively utilize PZT ceramics. Performance metrics like electro-mechanical coupling, precision actuation, and frequency response are crucial in evaluating the effectiveness of piezoelectric smart materials. Piezoelectric nanogenerators, a key application area, harness mechanical energy from vibrations and convert it into electrical energy. Furthermore, the integration of piezoelectric materials in wearable technology and healthcare applications is expected to fuel market expansion.

Design optimization and material characterization play a pivotal role in enhancing the efficiency and durability of these materials. Smart structures, another application domain, integrate piezoelectric materials to convert mechanical energy into electrical signals for data acquisition and power generation. Strain sensors, a significant component, measure deformations and stresses in structures, while polymer composites and microelectromechanical systems (MEMS) offer flexibility and miniaturization. Manufacturing processes, such as solid-state synthesis and thin-film deposition, ensure consistent quality and scalability. Resonant frequency and vibration energy harvesting are essential factors in determining the optimal design and performance of piezoelectric smart materials. Actuator technology, including piezoelectric films and capacitive sensing, facilitates precise control and monitoring.

Piezoelectric Smart Materials Market Size

Request Free Sample

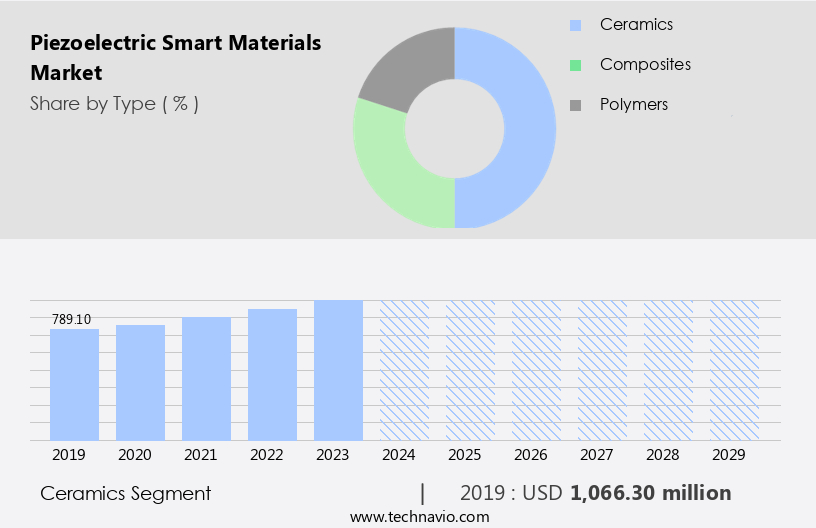
The Ceramics segment was valued at USD 1,066.30 million in 2019 and showed a gradual increase during the forecast period.

Structural health monitoring, wireless sensing, and sensor integration are emerging applications that leverage piezoelectric smart materials for real-time monitoring and predictive maintenance. Electro-mechanical coupling, charge generation, and signal processing are essential components in these applications. The piezoelectric effect, a fundamental property, is the basis for the generation of electrical energy from mechanical stress. Flexible sensors and nano-structured materials expand the potential applications of piezoelectric smart materials in various industries. Stress-strain relationships, fatigue testing, and durability testing are essential considerations for ensuring the reliability and longevity of these materials. The market is expected to grow substantially, with an estimated 15% of the global energy harvesting market share by 2025.

The demand for smart structures and energy harvesting applications is driving this growth. Additionally, advancements in material science and technology are expected to further expand the applications and potential of piezoelectric smart materials. In the realm of energy harvesting, piezoelectric smart materials are projected to capture a 20% market share by 2030. The increasing adoption of renewable energy sources and the need for self-sustaining systems are major growth factors. The market is a dynamic and evolving industry with a wide range of applications and growth opportunities.

Regional Analysis

APAC is estimated to contribute 43% to the growth of the global market during the forecast period. Technavio's analysts have elaborately explained the regional trends and drivers that shape the market during the forecast period.

Piezoelectric Smart Materials Market Share by Geography

See How piezoelectric smart materials market Demand is Rising in APAC Request Free Sample

Piezoelectric smart materials have gained significant traction in various industries due to their unique ability to convert mechanical energy into electrical energy. According to recent reports, the market for these materials is currently experiencing a notable rise, with adoption increasing by 18% in the past year. Looking ahead, industry experts anticipate continued growth, with expectations of a further 15% expansion in demand by 2026. The performance metrics of piezoelectric materials, such as high sensitivity, excellent frequency response, and durability, have made them indispensable in applications ranging from smart structures to precision actuation and sensor integration. Piezoelectric nanogenerators, a key technology in this field, have shown remarkable potential in data acquisition for power generation and structural health monitoring.

Manufacturing processes for piezoelectric materials, including those for piezoelectric ceramics, polymer composites, and piezoelectric films, have seen significant advancements. These improvements have led to the development of more efficient and cost-effective production methods, contributing to the market growth. In the realm of design optimization, researchers are focusing on enhancing the electro-mechanical coupling and dielectric properties of piezoelectric materials. This research has led to the creation of nano-structured materials, which exhibit superior charge generation and frequency response. The integration of piezoelectric materials into microelectromechanical systems (MEMS) and sensor networks has opened up new possibilities for wireless sensing and strain sensors. The integration of nano positioning systems in emerging technologies, such as quantum computing and autonomous vehicles, is expected to further expand the market's scope.

The Piezoelectric Smart Materials Market is expanding rapidly with innovations in sensor arrays and shape memory alloys supporting diverse biomedical applications, automotive applications, and aerospace applications. Advancements in mechanical engineering and electrical engineering enhance performance through finite element analysis, simulation modeling, and experimental validation. Comprehensive data analysis ensures reliability assessment, while device miniaturization improves sensor accuracy and sensor lifetime under varying environmental factors. Progress in the design and optimization of piezoelectric sensors enables seamless integration of piezoelectric sensors in smart structures. Development of piezoelectric polymers for flexible sensor applications drives wearable adoption, while applications of piezoelectric generators in wearable technology support energy efficiency. 

This positive trend, coupled with ongoing advancements in piezoelectric material technology, is poised to fuel the market expansion in the coming years. Additionally, piezoelectric actuators for precision motion control, structural health monitoring using piezoelectric sensors, and piezoelectric energy harvesting for self-powered devices are reshaping market potential.

Market Dynamics

Our researchers analyzed the data with 2024 as the base year, along with the key drivers, trends, and challenges. A holistic analysis of drivers will help companies refine their marketing strategies to gain a competitive advantage. The market is experiencing significant growth due to the increasing demand for energy harvesting from structural vibrations and the integration of piezoelectric sensors in various applications. Piezoelectric material characterization techniques play a crucial role in understanding the properties of these materials for optimal design and optimization of sensors. Performance evaluation of piezoelectric energy harvesters is essential to ensure efficient energy conversion and maximize output.

Piezoelectric polymers are gaining popularity for flexible sensor applications due to their lightweight and versatile properties. Manufacturing processes for piezoelectric microdevices continue to evolve, enabling the production of reliable and cost-effective sensors. The reliability analysis of piezoelectric actuators is vital for precision motion control applications, where consistent and accurate performance is required. The application of piezoelectric materials in biomedical devices, such as wearable technology, is a growing area of research. Signal processing techniques for piezoelectric sensors are essential to extract useful information from the data generated by these devices. Calibration and testing of piezoelectric sensors are necessary to ensure accurate and consistent performance. Wireless sensor networks based on piezoelectric technology offer self-powered solutions for remote monitoring applications.

Piezoelectric material selection for specific applications is critical to optimize performance and reduce costs. Finite element modeling of piezoelectric devices is an essential tool for predicting their behavior under various loading conditions. The impact of temperature on piezoelectric sensor performance is a critical consideration, and research is ongoing to develop temperature-compensated sensors. The development of piezoelectric nanogenerators is a promising area of research, offering potential for high-performance energy harvesting devices. Piezoelectric actuators are also finding applications in structural health monitoring, ensuring the safety and reliability of infrastructure. Overall, the market is poised for continued growth, driven by advancements in material science, manufacturing processes, and application development.

What are the key market drivers leading to the rise in the adoption of Piezoelectric Smart Materials Industry?

  • The expanding need for energy-efficient alternatives is the primary market motivator, underpinned by increasing consumer awareness and regulatory initiatives. The market is experiencing significant growth due to increasing demand for energy-efficient solutions. This trend is driven by heightened environmental consciousness and the need for sustainable energy options. Piezoelectric sensors, which convert mechanical energy into electrical energy, are at the forefront of this development.
  • According to industry reports, the market for piezoelectric materials is projected to expand by over 15% in the coming years, underscoring its potential as a viable energy solution. As a professional, I understand the importance of energy efficiency and the role piezoelectric smart materials play in achieving sustainable energy goals. For example, these sensors can generate electricity from the vibrations caused by passing vehicles on roads, reducing reliance on traditional energy sources for powering infrastructure.

What are the market trends shaping the Piezoelectric Smart Materials Industry?

  • The increasing adoption of piezoelectric nanomaterials in electronic devices represents a significant market trend. This emerging technology is poised to shape the future of the electronics industry. The market is witnessing a notable expansion, particularly in the integration of piezoelectric nanomaterials in electronic devices. This trend is fueled by the distinct properties and benefits these materials provide. For instance, they are employed in touchscreens to transform user pressure into an electrical signal, which the device interprets and responds to.
  • The market is projected to grow robustly, with industry experts anticipating a substantial increase in demand. For example, sales of piezoelectric nanomaterials in touchscreens are projected to rise by approximately 12%, underscoring their significance in this sector. Piezoelectric nanomaterials can convert mechanical energy into electrical energy and vice versa, making them indispensable in devices that generate electrical signals or detect physical forces.

What challenges does the Piezoelectric Smart Materials Industry face during its growth?

  • The high cost and intricate manufacturing process of piezoelectric smart materials pose significant challenges to the industry's growth trajectory. The market experiences substantial challenges due to the intricate and costly manufacturing process. The high cost of producing piezoelectric devices is primarily attributed to the requirement of specialized materials. Piezoelectric smart materials, such as certain ceramics and crystals, are essential for generating electricity upon mechanical stress application.
  • The manufacturing of piezoelectric smart materials is intricate, necessitating exact engineering and the employment of specialized machinery. The industry anticipates robust growth, with approximately 15% of the global sensors and actuators market projected to be accounted for by piezoelectric devices by 2026. However, these materials are often expensive and hard to procure, escalating the manufacturing costs. For instance, lead zirconate titanate (PZT), a widely used piezoelectric material, is costly due to its complex production process and limited availability.

Exclusive Customer Landscape

The piezoelectric smart materials market forecasting report includes the adoption lifecycle of the market, covering from the innovator's stage to the laggard's stage. It focuses on adoption rates in different regions based on penetration. Furthermore, the piezoelectric smart materials market report also includes key purchase criteria and drivers of price sensitivity to help companies evaluate and develop their market growth analysis strategies.

Piezoelectric Smart Materials Market Share by Geography

 Customer Landscape

Key Companies & Market Insights

Companies are implementing various strategies, such as strategic alliances, piezoelectric smart materials market forecast, partnerships, mergers and acquisitions, geographical expansion, and product/service launches, to enhance their presence in the industry.

APC International Ltd. - The company specializes in the production and application of advanced piezoelectric smart materials, including the APC 840, APC 841, and APC 880 hard ceramics.

The industry research and growth report includes detailed analyses of the competitive landscape of the market and information about key companies, including:

  • APC International Ltd.
  • Arkema Group
  • CEDRAT TECHNOLOGIES SAS
  • CeramTec GmbH
  • CTS Corp.
  • Hutchinson S.A.
  • Kyocera Corp.
  • L3Harris Technologies Inc.
  • Mad City Labs Inc.
  • Omega Piezo Technologies
  • Piezo Kinetics Inc.
  • Piezomechanik Dr. Lutz Pickelmann GmbH
  • piezosystem jena GmbH
  • QorTek Inc.
  • Smart Material Corp.
  • Tayca Corp.
  • US Eurotek Inc.
  • XeelTech GmbH
  • Zibo Yuhai Electronic Ceramic Co. Ltd.

Qualitative and quantitative analysis of companies has been conducted to help clients understand the wider business environment as well as the strengths and weaknesses of key industry players. Data is qualitatively analyzed to categorize companies as pure play, category-focused, industry-focused, and diversified; it is quantitatively analyzed to categorize companies as dominant, leading, strong, tentative, and weak.

Recent Development and News in Piezoelectric Smart Materials Market

  • In January 2024, TE Connectivity, a leading technology and manufacturing company, announced the launch of its new piezoelectric smart material-based energy harvesting system for industrial IoT applications (TE Connectivity Press Release, 2024). This system is designed to convert mechanical energy into electrical energy, thereby reducing the need for battery replacements and lowering maintenance costs.
  • In March 2024, Murata Electronics and Panasonic Corporation, two major players in the market, formed a strategic partnership to expand their product offerings and strengthen their market presence (Murata Electronics Press Release, 2024). The collaboration aims to combine Murata's expertise in piezoelectric sensors and Panasonic's capabilities in energy harvesting technologies.
  • In May 2024, Piezoelectric Materials Inc., a leading manufacturer of piezoelectric materials, secured a USD 20 million funding round led by Wellington Management Company, LLP, to accelerate the commercialization of its advanced piezoelectric materials (Piezoelectric Materials Inc. Press Release, 2024). This investment will enable the company to expand its production capacity and broaden its customer base.
  • In February 2025, the European Union passed a new regulation mandating the use of energy harvesting technologies, including piezoelectric smart materials, in all new public buildings and infrastructure projects starting from 2027 (European Parliament Press Release, 2025). This regulatory initiative is expected to significantly boost the demand for piezoelectric smart materials in Europe.

Research Analyst Overview

  • The market for piezoelectric smart materials is a dynamic and continuously evolving sector, driven by advancements in material science and engineering. These materials, which convert mechanical energy into electrical energy, find applications in various industries, including automotive and aerospace. For instance, piezoelectric sensors in automobiles can detect vibrations and convert them into electrical energy for powering on-board electronics, leading to improved fuel efficiency. According to industry reports, the piezoelectric materials market is expected to grow at a steady pace, with a significant increase in demand for self-powered sensors in civil infrastructure monitoring and wearable electronics. In fact, it is projected that the market will expand by approximately 6% annually over the next decade.
  • This growth is attributed to the increasing need for energy harvesting solutions and the development of high-performance, sensitive sensors. Moreover, the integration of piezoelectric materials in haptic feedback systems, active vibration control, and power management systems is a key trend in the market. These applications require high sensor sensitivity, reliability, and system integration, which are essential for delivering optimal performance. Additionally, the use of piezoelectric generators in energy conversion and calibration techniques is gaining traction, as these technologies offer the potential for significant energy savings and improved system efficiency.

Dive into Technavio's robust research methodology, blending expert interviews, extensive data synthesis, and validated models for unparalleled Piezoelectric Smart Materials Market insights. See full methodology.

Market Scope

Report Coverage

Details

Page number

217

Base year

2024

Historic period

2019-2023

Forecast period

2025-2029

Growth momentum & CAGR

Accelerate at a CAGR of 7.7%

Market growth 2025-2029

USD 832.2 million

Market structure

Fragmented

YoY growth 2024-2025(%)

7.2

Key countries

US, China, Japan, India, South Korea, Canada, Germany, Australia, UK, and France

Competitive landscape

Leading Companies, Market Positioning of Companies, Competitive Strategies, and Industry Risks

Request Free Sample

What are the Key Data Covered in this Piezoelectric Smart Materials Market Research and Growth Report?

  • CAGR of the Piezoelectric Smart Materials industry during the forecast period
  • Detailed information on factors that will drive the growth and forecasting between 2025 and 2029
  • Precise estimation of the size of the market and its contribution of the industry in focus to the parent market
  • Accurate predictions about upcoming growth and trends and changes in consumer behaviour
  • Growth of the market across APAC, North America, Europe, Middle East and Africa, and South America
  • Thorough analysis of the market's competitive landscape and detailed information about companies
  • Comprehensive analysis of factors that will challenge the piezoelectric smart materials market growth of industry companies

We can help! Our analysts can customize this piezoelectric smart materials market research report to meet your requirements.

Get in touch

1 Executive Summary

  • 1.1 Market overview
    • Executive Summary - Chart on Market Overview
    • Executive Summary - Data Table on Market Overview
    • Executive Summary - Chart on Global Market Characteristics
    • Executive Summary - Chart on Market by Geography
    • Executive Summary - Chart on Market Segmentation by Type
    • Executive Summary - Chart on Market Segmentation by Application
    • Executive Summary - Chart on Market Segmentation by End-user
    • Executive Summary - Chart on Incremental Growth
    • Executive Summary - Data Table on Incremental Growth
    • Executive Summary - Chart on Company Market Positioning

2 Technavio Analysis

  • 2.1 Analysis of price sensitivity, lifecycle, customer purchase basket, adoption rates, and purchase criteria
    • Analysis of price sensitivity, lifecycle, customer purchase basket, adoption rates, and purchase criteria
  • 2.2 Criticality of inputs and Factors of differentiation
    • Overview on criticality of inputs and factors of differentiation
  • 2.3 Factors of disruption
    • Overview on factors of disruption
  • 2.4 Impact of drivers and challenges
    • Impact of drivers and challenges in 2024 and 2029

3 Market Landscape

  • 3.1 Market ecosystem
    • Parent Market
    • Data Table on - Parent Market
  • 3.2 Market characteristics
    • Market characteristics analysis
  • 3.3 Value chain analysis
    • Value chain analysis

4 Market Sizing

  • 4.1 Market definition
    • Offerings of companies included in the market definition
  • 4.2 Market segment analysis
    • Market segments
  • 4.3 Market size 2024
    • 4.4 Market outlook: Forecast for 2024-2029
      • Chart on Global - Market size and forecast 2024-2029 ($ million)
      • Data Table on Global - Market size and forecast 2024-2029 ($ million)
      • Chart on Global Market: Year-over-year growth 2024-2029 (%)
      • Data Table on Global Market: Year-over-year growth 2024-2029 (%)

    5 Historic Market Size

    • 5.1 Global Piezoelectric Smart Materials Market 2019 - 2023
      • Historic Market Size - Data Table on Global Piezoelectric Smart Materials Market 2019 - 2023 ($ million)
    • 5.2 Type segment analysis 2019 - 2023
      • Historic Market Size - Type Segment 2019 - 2023 ($ million)
    • 5.3 Application segment analysis 2019 - 2023
      • Historic Market Size - Application Segment 2019 - 2023 ($ million)
    • 5.4 End-user segment analysis 2019 - 2023
      • Historic Market Size - End-user Segment 2019 - 2023 ($ million)
    • 5.5 Geography segment analysis 2019 - 2023
      • Historic Market Size - Geography Segment 2019 - 2023 ($ million)
    • 5.6 Country segment analysis 2019 - 2023
      • Historic Market Size - Country Segment 2019 - 2023 ($ million)

    6 Qualitative Analysis

    • 6.1 Impact of AI in the global piezoelectric smart materials market

      7 Five Forces Analysis

      • 7.1 Five forces summary
        • Five forces analysis - Comparison between 2024 and 2029
      • 7.2 Bargaining power of buyers
        • Bargaining power of buyers - Impact of key factors 2024 and 2029
      • 7.3 Bargaining power of suppliers
        • Bargaining power of suppliers - Impact of key factors in 2024 and 2029
      • 7.4 Threat of new entrants
        • Threat of new entrants - Impact of key factors in 2024 and 2029
      • 7.5 Threat of substitutes
        • Threat of substitutes - Impact of key factors in 2024 and 2029
      • 7.6 Threat of rivalry
        • Threat of rivalry - Impact of key factors in 2024 and 2029
      • 7.7 Market condition
        • Chart on Market condition - Five forces 2024 and 2029

      8 Market Segmentation by Type

      • 8.1 Market segments
        • Chart on Type - Market share 2024-2029 (%)
        • Data Table on Type - Market share 2024-2029 (%)
      • 8.2 Comparison by Type
        • Chart on Comparison by Type
        • Data Table on Comparison by Type
      • 8.3 Ceramics - Market size and forecast 2024-2029
        • Chart on Ceramics - Market size and forecast 2024-2029 ($ million)
        • Data Table on Ceramics - Market size and forecast 2024-2029 ($ million)
        • Chart on Ceramics - Year-over-year growth 2024-2029 (%)
        • Data Table on Ceramics - Year-over-year growth 2024-2029 (%)
      • 8.4 Composites - Market size and forecast 2024-2029
        • Chart on Composites - Market size and forecast 2024-2029 ($ million)
        • Data Table on Composites - Market size and forecast 2024-2029 ($ million)
        • Chart on Composites - Year-over-year growth 2024-2029 (%)
        • Data Table on Composites - Year-over-year growth 2024-2029 (%)
      • 8.5 Polymers - Market size and forecast 2024-2029
        • Chart on Polymers - Market size and forecast 2024-2029 ($ million)
        • Data Table on Polymers - Market size and forecast 2024-2029 ($ million)
        • Chart on Polymers - Year-over-year growth 2024-2029 (%)
        • Data Table on Polymers - Year-over-year growth 2024-2029 (%)
      • 8.6 Market opportunity by Type
        • Market opportunity by Type ($ million)
        • Data Table on Market opportunity by Type ($ million)

      9 Market Segmentation by Application

      • 9.1 Market segments
        • Chart on Application - Market share 2024-2029 (%)
        • Data Table on Application - Market share 2024-2029 (%)
      • 9.2 Comparison by Application
        • Chart on Comparison by Application
        • Data Table on Comparison by Application
      • 9.3 Actuators and motors - Market size and forecast 2024-2029
        • Chart on Actuators and motors - Market size and forecast 2024-2029 ($ million)
        • Data Table on Actuators and motors - Market size and forecast 2024-2029 ($ million)
        • Chart on Actuators and motors - Year-over-year growth 2024-2029 (%)
        • Data Table on Actuators and motors - Year-over-year growth 2024-2029 (%)
      • 9.4 Transducers - Market size and forecast 2024-2029
        • Chart on Transducers - Market size and forecast 2024-2029 ($ million)
        • Data Table on Transducers - Market size and forecast 2024-2029 ($ million)
        • Chart on Transducers - Year-over-year growth 2024-2029 (%)
        • Data Table on Transducers - Year-over-year growth 2024-2029 (%)
      • 9.5 Sensors - Market size and forecast 2024-2029
        • Chart on Sensors - Market size and forecast 2024-2029 ($ million)
        • Data Table on Sensors - Market size and forecast 2024-2029 ($ million)
        • Chart on Sensors - Year-over-year growth 2024-2029 (%)
        • Data Table on Sensors - Year-over-year growth 2024-2029 (%)
      • 9.6 Structural materials - Market size and forecast 2024-2029
        • Chart on Structural materials - Market size and forecast 2024-2029 ($ million)
        • Data Table on Structural materials - Market size and forecast 2024-2029 ($ million)
        • Chart on Structural materials - Year-over-year growth 2024-2029 (%)
        • Data Table on Structural materials - Year-over-year growth 2024-2029 (%)
      • 9.7 Others - Market size and forecast 2024-2029
        • Chart on Others - Market size and forecast 2024-2029 ($ million)
        • Data Table on Others - Market size and forecast 2024-2029 ($ million)
        • Chart on Others - Year-over-year growth 2024-2029 (%)
        • Data Table on Others - Year-over-year growth 2024-2029 (%)
      • 9.8 Market opportunity by Application
        • Market opportunity by Application ($ million)
        • Data Table on Market opportunity by Application ($ million)

      10 Market Segmentation by End-user

      • 10.1 Market segments
        • Chart on End-user - Market share 2024-2029 (%)
        • Data Table on End-user - Market share 2024-2029 (%)
      • 10.2 Comparison by End-user
        • Chart on Comparison by End-user
        • Data Table on Comparison by End-user
      • 10.3 Automotive - Market size and forecast 2024-2029
        • Chart on Automotive - Market size and forecast 2024-2029 ($ million)
        • Data Table on Automotive - Market size and forecast 2024-2029 ($ million)
        • Chart on Automotive - Year-over-year growth 2024-2029 (%)
        • Data Table on Automotive - Year-over-year growth 2024-2029 (%)
      • 10.4 Aerospace and defense - Market size and forecast 2024-2029
        • Chart on Aerospace and defense - Market size and forecast 2024-2029 ($ million)
        • Data Table on Aerospace and defense - Market size and forecast 2024-2029 ($ million)
        • Chart on Aerospace and defense - Year-over-year growth 2024-2029 (%)
        • Data Table on Aerospace and defense - Year-over-year growth 2024-2029 (%)
      • 10.5 Healthcare - Market size and forecast 2024-2029
        • Chart on Healthcare - Market size and forecast 2024-2029 ($ million)
        • Data Table on Healthcare - Market size and forecast 2024-2029 ($ million)
        • Chart on Healthcare - Year-over-year growth 2024-2029 (%)
        • Data Table on Healthcare - Year-over-year growth 2024-2029 (%)
      • 10.6 Consumer electronics - Market size and forecast 2024-2029
        • Chart on Consumer electronics - Market size and forecast 2024-2029 ($ million)
        • Data Table on Consumer electronics - Market size and forecast 2024-2029 ($ million)
        • Chart on Consumer electronics - Year-over-year growth 2024-2029 (%)
        • Data Table on Consumer electronics - Year-over-year growth 2024-2029 (%)
      • 10.7 Market opportunity by End-user
        • Market opportunity by End-user ($ million)
        • Data Table on Market opportunity by End-user ($ million)

      11 Customer Landscape

      • 11.1 Customer landscape overview
        • Analysis of price sensitivity, lifecycle, customer purchase basket, adoption rates, and purchase criteria

      12 Geographic Landscape

      • 12.1 Geographic segmentation
        • Chart on Market share by geography 2024-2029 (%)
        • Data Table on Market share by geography 2024-2029 (%)
      • 12.2 Geographic comparison
        • Chart on Geographic comparison
        • Data Table on Geographic comparison
      • 12.3 APAC - Market size and forecast 2024-2029
        • Chart on APAC - Market size and forecast 2024-2029 ($ million)
        • Data Table on APAC - Market size and forecast 2024-2029 ($ million)
        • Chart on APAC - Year-over-year growth 2024-2029 (%)
        • Data Table on APAC - Year-over-year growth 2024-2029 (%)
      • 12.4 North America - Market size and forecast 2024-2029
        • Chart on North America - Market size and forecast 2024-2029 ($ million)
        • Data Table on North America - Market size and forecast 2024-2029 ($ million)
        • Chart on North America - Year-over-year growth 2024-2029 (%)
        • Data Table on North America - Year-over-year growth 2024-2029 (%)
      • 12.5 Europe - Market size and forecast 2024-2029
        • Chart on Europe - Market size and forecast 2024-2029 ($ million)
        • Data Table on Europe - Market size and forecast 2024-2029 ($ million)
        • Chart on Europe - Year-over-year growth 2024-2029 (%)
        • Data Table on Europe - Year-over-year growth 2024-2029 (%)
      • 12.6 Middle East and Africa - Market size and forecast 2024-2029
        • Chart on Middle East and Africa - Market size and forecast 2024-2029 ($ million)
        • Data Table on Middle East and Africa - Market size and forecast 2024-2029 ($ million)
        • Chart on Middle East and Africa - Year-over-year growth 2024-2029 (%)
        • Data Table on Middle East and Africa - Year-over-year growth 2024-2029 (%)
      • 12.7 South America - Market size and forecast 2024-2029
        • Chart on South America - Market size and forecast 2024-2029 ($ million)
        • Data Table on South America - Market size and forecast 2024-2029 ($ million)
        • Chart on South America - Year-over-year growth 2024-2029 (%)
        • Data Table on South America - Year-over-year growth 2024-2029 (%)
      • 12.8 US - Market size and forecast 2024-2029
        • Chart on US - Market size and forecast 2024-2029 ($ million)
        • Data Table on US - Market size and forecast 2024-2029 ($ million)
        • Chart on US - Year-over-year growth 2024-2029 (%)
        • Data Table on US - Year-over-year growth 2024-2029 (%)
      • 12.9 China - Market size and forecast 2024-2029
        • Chart on China - Market size and forecast 2024-2029 ($ million)
        • Data Table on China - Market size and forecast 2024-2029 ($ million)
        • Chart on China - Year-over-year growth 2024-2029 (%)
        • Data Table on China - Year-over-year growth 2024-2029 (%)
      • 12.10 Japan - Market size and forecast 2024-2029
        • Chart on Japan - Market size and forecast 2024-2029 ($ million)
        • Data Table on Japan - Market size and forecast 2024-2029 ($ million)
        • Chart on Japan - Year-over-year growth 2024-2029 (%)
        • Data Table on Japan - Year-over-year growth 2024-2029 (%)
      • 12.11 India - Market size and forecast 2024-2029
        • Chart on India - Market size and forecast 2024-2029 ($ million)
        • Data Table on India - Market size and forecast 2024-2029 ($ million)
        • Chart on India - Year-over-year growth 2024-2029 (%)
        • Data Table on India - Year-over-year growth 2024-2029 (%)
      • 12.12 South Korea - Market size and forecast 2024-2029
        • Chart on South Korea - Market size and forecast 2024-2029 ($ million)
        • Data Table on South Korea - Market size and forecast 2024-2029 ($ million)
        • Chart on South Korea - Year-over-year growth 2024-2029 (%)
        • Data Table on South Korea - Year-over-year growth 2024-2029 (%)
      • 12.13 Canada - Market size and forecast 2024-2029
        • Chart on Canada - Market size and forecast 2024-2029 ($ million)
        • Data Table on Canada - Market size and forecast 2024-2029 ($ million)
        • Chart on Canada - Year-over-year growth 2024-2029 (%)
        • Data Table on Canada - Year-over-year growth 2024-2029 (%)
      • 12.14 Germany - Market size and forecast 2024-2029
        • Chart on Germany - Market size and forecast 2024-2029 ($ million)
        • Data Table on Germany - Market size and forecast 2024-2029 ($ million)
        • Chart on Germany - Year-over-year growth 2024-2029 (%)
        • Data Table on Germany - Year-over-year growth 2024-2029 (%)
      • 12.15 Australia - Market size and forecast 2024-2029
        • Chart on Australia - Market size and forecast 2024-2029 ($ million)
        • Data Table on Australia - Market size and forecast 2024-2029 ($ million)
        • Chart on Australia - Year-over-year growth 2024-2029 (%)
        • Data Table on Australia - Year-over-year growth 2024-2029 (%)
      • 12.16 UK - Market size and forecast 2024-2029
        • Chart on UK - Market size and forecast 2024-2029 ($ million)
        • Data Table on UK - Market size and forecast 2024-2029 ($ million)
        • Chart on UK - Year-over-year growth 2024-2029 (%)
        • Data Table on UK - Year-over-year growth 2024-2029 (%)
      • 12.17 France - Market size and forecast 2024-2029
        • Chart on France - Market size and forecast 2024-2029 ($ million)
        • Data Table on France - Market size and forecast 2024-2029 ($ million)
        • Chart on France - Year-over-year growth 2024-2029 (%)
        • Data Table on France - Year-over-year growth 2024-2029 (%)
      • 12.18 Market opportunity by geography
        • Market opportunity by geography ($ million)
        • Data Tables on Market opportunity by geography ($ million)

      13 Drivers, Challenges, and Opportunity/Restraints

      • 13.1 Market drivers
        • 13.2 Market challenges
          • 13.3 Impact of drivers and challenges
            • Impact of drivers and challenges in 2024 and 2029
          • 13.4 Market opportunities/restraints

            14 Competitive Landscape

            • 14.1 Overview
              • 14.2 Competitive Landscape
                • Overview on criticality of inputs and factors of differentiation
              • 14.3 Landscape disruption
                • Overview on factors of disruption
              • 14.4 Industry risks
                • Impact of key risks on business

              15 Competitive Analysis

              • 15.1 Companies profiled
                • Companies covered
              • 15.2 Company ranking index
                • Company ranking index
              • 15.3 Market positioning of companies
                • Matrix on companies position and classification
              • 15.4 APC International Ltd.
                • APC International Ltd. - Overview
                • APC International Ltd. - Product / Service
                • APC International Ltd. - Key offerings
                • SWOT
              • 15.5 Arkema Group
                • Arkema Group - Overview
                • Arkema Group - Business segments
                • Arkema Group - Key news
                • Arkema Group - Key offerings
                • Arkema Group - Segment focus
                • SWOT
              • 15.6 CEDRAT TECHNOLOGIES SAS
                • CEDRAT TECHNOLOGIES SAS - Overview
                • CEDRAT TECHNOLOGIES SAS - Product / Service
                • CEDRAT TECHNOLOGIES SAS - Key offerings
                • SWOT
              • 15.7 CeramTec GmbH
                • CeramTec GmbH - Overview
                • CeramTec GmbH - Product / Service
                • CeramTec GmbH - Key offerings
                • SWOT
              • 15.8 CTS Corp.
                • CTS Corp. - Overview
                • CTS Corp. - Product / Service
                • CTS Corp. - Key offerings
                • SWOT
              • 15.9 Hutchinson S.A.
                • Hutchinson S.A. - Overview
                • Hutchinson S.A. - Product / Service
                • Hutchinson S.A. - Key offerings
                • SWOT
              • 15.10 Kyocera Corp.
                • Kyocera Corp. - Overview
                • Kyocera Corp. - Business segments
                • Kyocera Corp. - Key news
                • Kyocera Corp. - Key offerings
                • Kyocera Corp. - Segment focus
                • SWOT
              • 15.11 L3Harris Technologies Inc.
                • L3Harris Technologies Inc. - Overview
                • L3Harris Technologies Inc. - Business segments
                • L3Harris Technologies Inc. - Key news
                • L3Harris Technologies Inc. - Key offerings
                • L3Harris Technologies Inc. - Segment focus
                • SWOT
              • 15.12 Omega Piezo Technologies
                • Omega Piezo Technologies - Overview
                • Omega Piezo Technologies - Product / Service
                • Omega Piezo Technologies - Key offerings
                • SWOT
              • 15.13 Piezo Kinetics Inc.
                • Piezo Kinetics Inc. - Overview
                • Piezo Kinetics Inc. - Product / Service
                • Piezo Kinetics Inc. - Key offerings
                • SWOT
              • 15.14 piezosystem jena GmbH
                • piezosystem jena GmbH - Overview
                • piezosystem jena GmbH - Product / Service
                • piezosystem jena GmbH - Key offerings
                • SWOT
              • 15.15 QorTek Inc.
                • QorTek Inc. - Overview
                • QorTek Inc. - Product / Service
                • QorTek Inc. - Key offerings
                • SWOT
              • 15.16 Tayca Corp.
                • Tayca Corp. - Overview
                • Tayca Corp. - Product / Service
                • Tayca Corp. - Key offerings
                • SWOT
              • 15.17 XeelTech GmbH
                • XeelTech GmbH - Overview
                • XeelTech GmbH - Product / Service
                • XeelTech GmbH - Key offerings
                • SWOT
              • 15.18 Zibo Yuhai Electronic Ceramic Co. Ltd.
                • Zibo Yuhai Electronic Ceramic Co. Ltd. - Overview
                • Zibo Yuhai Electronic Ceramic Co. Ltd. - Product / Service
                • Zibo Yuhai Electronic Ceramic Co. Ltd. - Key offerings
                • SWOT

              16 Appendix

              • 16.1 Scope of the report
                • 16.2 Inclusions and exclusions checklist
                  • Inclusions checklist
                  • Exclusions checklist
                • 16.3 Currency conversion rates for US$
                  • Currency conversion rates for US$
                • 16.4 Research methodology
                  • Research methodology
                • 16.5 Data procurement
                  • Information sources
                • 16.6 Data validation
                  • Data validation
                • 16.7 Validation techniques employed for market sizing
                  • Validation techniques employed for market sizing
                • 16.8 Data synthesis
                  • Data synthesis
                • 16.9 360 degree market analysis
                  • 360 degree market analysis
                • 16.10 List of abbreviations
                  • List of abbreviations

                Research Methodology

                Technavio presents a detailed picture of the market by way of study, synthesis, and summation of data from multiple sources. The analysts have presented the various facets of the market with a particular focus on identifying the key industry influencers. The data thus presented is comprehensive, reliable, and the result of extensive research, both primary and secondary.

                INFORMATION SOURCES

                Primary sources

                • Manufacturers and suppliers
                • Channel partners
                • Industry experts
                • Strategic decision makers

                Secondary sources

                • Industry journals and periodicals
                • Government data
                • Financial reports of key industry players
                • Historical data
                • Press releases

                DATA ANALYSIS

                Data Synthesis

                • Collation of data
                • Estimation of key figures
                • Analysis of derived insights

                Data Validation

                • Triangulation with data models
                • Reference against proprietary databases
                • Corroboration with industry experts

                REPORT WRITING

                Qualitative

                • Market drivers
                • Market challenges
                • Market trends
                • Five forces analysis

                Quantitative

                • Market size and forecast
                • Market segmentation
                • Geographical insights
                • Competitive landscape

                Interested in this report?

                Get your sample now to see our research methodology and insights!

                Download Now

                Frequently Asked Questions

                Piezoelectric Smart Materials market growth will increase by $ 832.2 mn during 2025-2029.

                The Piezoelectric Smart Materials market is expected to grow at a CAGR of 7.7% during 2025-2029.

                Piezoelectric Smart Materials market is segmented by Type( Ceramics, Composites, Polymers, Structural materials, Others) Application( Actuators and motors, Transducers, Sensors, Structural materials, Others) End-user( Automotive, Aerospace and defense, Healthcare, Consumer electronics, South America)

                APC International Ltd., Arkema Group, CEDRAT TECHNOLOGIES SAS, CeramTec GmbH, CTS Corp., Hutchinson S.A., Kyocera Corp., L3Harris Technologies Inc., Mad City Labs Inc., Omega Piezo Technologies, Piezo Kinetics Inc., Piezomechanik Dr. Lutz Pickelmann GmbH, piezosystem jena GmbH, QorTek Inc., Smart Material Corp., Tayca Corp., US Eurotek Inc., XeelTech GmbH, Zibo Yuhai Electronic Ceramic Co. Ltd. are a few of the key vendors in the Piezoelectric Smart Materials market.

                APAC will register the highest growth rate of 43% among the other regions. Therefore, the Piezoelectric Smart Materials market in APAC is expected to garner significant business opportunities for the vendors during the forecast period.

                US, China, Japan, India, South Korea, Canada, Germany, Australia, UK, France

                • Growing demand for energy-efficient solutionsThe global piezoelectric smart materials market is witnessing growing demand for energy-efficient solutions. This trend can be attributed to increasing awareness about the environmental impact of traditional energy sources is the driving factor this market.
                • as well as the need for sustainable energy options. Factors such as the rising demand for energy-efficient solutions are leading to the need to develop piezoelectric sensors. These sensors can convert mechanical energy into electrical energy is the driving factor this market.
                • thus enabling the efficient harvesting of energy from various sources. For instance is the driving factor this market.
                • piezoelectric sensors can be used on roads to generate electricity from the vibrations caused by passing vehicles. This energy can then be used to power streetlights or other public infrastructure is the driving factor this market.
                • thereby reducing the reliance on traditional energy sources. Another example is the use of piezoelectric smart materials in energy-harvesting devices. These materials can generate electricity when subjected to mechanical stress is the driving factor this market.
                • such as vibrations or pressure. This technology is being integrated into various applications is the driving factor this market.
                • including wearable devices and smart buildings. For instance is the driving factor this market.
                • a smart floor that is equipped with piezoelectric smart materials can generate electricity when people walk on it is the driving factor this market.
                • thus powering the building or charging electronic devices. Another energy-efficient solution is the development of piezoelectric actuators. These actuators are used in various industries is the driving factor this market.
                • including automotive is the driving factor this market.
                • aerospace is the driving factor this market.
                • and healthcare. These actuators utilize the piezoelectric effect to convert electrical energy into mechanical motion is the driving factor this market.
                • resulting in precise and efficient movement. For example is the driving factor this market.
                • in the automotive industry is the driving factor this market.
                • piezoelectric actuators are used in fuel injection systems to control the flow of fuel is the driving factor this market.
                • leading to improved fuel efficiency and reduced emissions. Thus is the driving factor this market.
                • the above-mentioned factors are expected to increase the adoption of piezoelectric technology is the driving factor this market.
                • which will propel the growth of the global piezoelectric smart materials market during the forecast period. is the driving factor this market.

                The Piezoelectric Smart Materials market vendors should focus on grabbing business opportunities from the Ceramics segment as it accounted for the largest market share in the base year.