Physiotherapy Market Analysis, Size, and Forecast 2026-2030: North America (US, Canada, and Mexico), Europe (Germany, UK, and France), APAC (China, Japan, and India), South America (Brazil, Argentina, and Colombia), Middle East and Africa (South Africa, Saudi Arabia, and UAE), Asia, Rest of World (ROW)

Physiotherapy Market Analysis, Size, and Forecast 2026-2030:
North America (US, Canada, and Mexico), Europe (Germany, UK, and France), APAC (China, Japan, and India), South America (Brazil, Argentina, and Colombia), Middle East and Africa (South Africa, Saudi Arabia, and UAE), Asia, Rest of World (ROW)

Published: Mar 2026 284 Pages SKU: IRTNTR44636

Market Overview at a Glance

$16.65 B
Market Opportunity
5.1%
CAGR 2025 - 2030
40.6%
North America Growth
$31.86 B
Musculoskeletal segment 2024

Physiotherapy Market Size 2026-2030

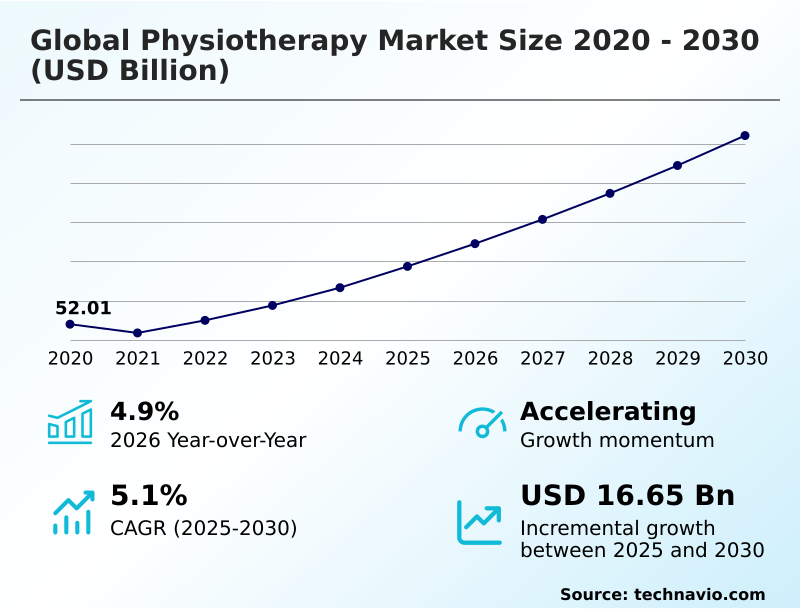
The physiotherapy market size is valued to increase by USD 16.65 billion, at a CAGR of 5.1% from 2025 to 2030. Integration AI-driven predictive rehabilitation and personalised treatment algorithms will drive the physiotherapy market.

Major Market Trends & Insights

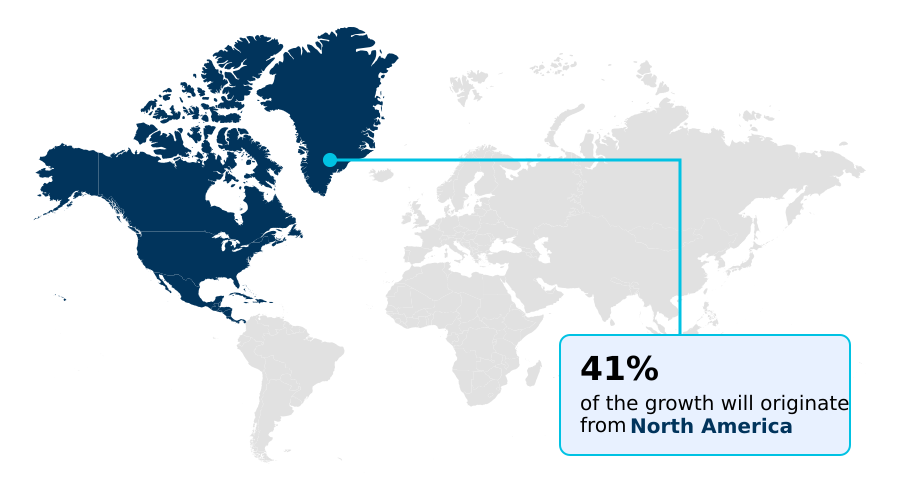
  • North America dominated the market and accounted for a 40.6% growth during the forecast period.
  • By Application - Musculoskeletal segment was valued at USD 31.86 billion in 2024
  • By Type - Physiotherapy services segment accounted for the largest market revenue share in 2024

Market Size & Forecast

  • Market Opportunities: USD 24.01 billion
  • Market Future Opportunities: USD 16.65 billion
  • CAGR from 2025 to 2030 : 5.1%

Market Summary

  • The physiotherapy market is undergoing a significant transformation, moving beyond traditional manual interventions to a sophisticated, technology-enabled ecosystem. This evolution is driven by a global aging population and a higher incidence of chronic conditions, shifting physiotherapy from an elective service to a crucial component of long-term care.
  • A key trend is the integration of advanced technologies like wearable biofeedback devices and AI-driven predictive rehabilitation to enhance treatment precision and patient outcomes. For instance, a large healthcare network can implement remote therapeutic monitoring to manage post-operative recovery for a high volume of patients, reducing hospital readmissions and improving operational efficiency.
  • This shift to data-driven, value-based care is reshaping clinical workflows. However, the industry faces challenges, including a critical shortage of skilled therapists and navigating complex reimbursement models. The increasing competition from alternative wellness providers also pressures firms to differentiate through superior clinical results and specialized expertise in areas like pelvic floor physical therapy and geriatric frailty management.

What will be the Size of the Physiotherapy Market during the forecast period?

Get Key Insights on Market Forecast (PDF) Request Free Sample

How is the Physiotherapy Market Segmented?

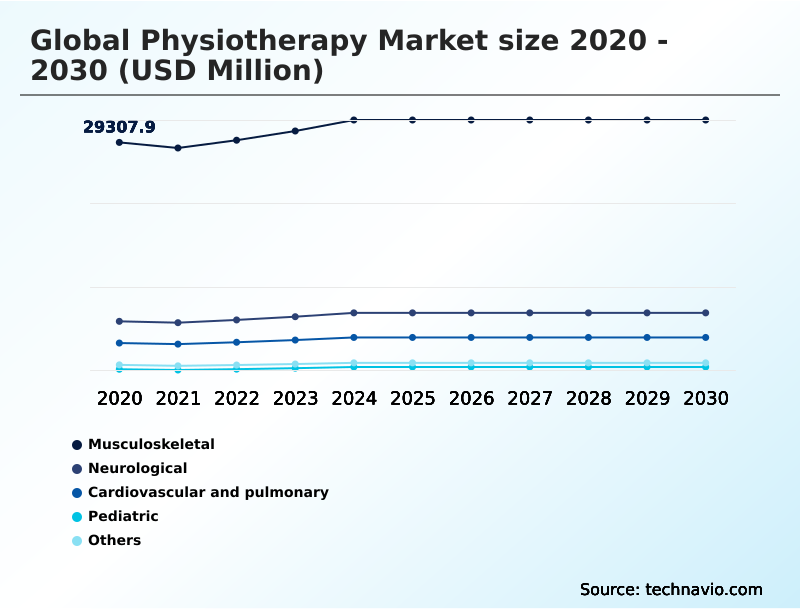
The physiotherapy industry research report provides comprehensive data (region-wise segment analysis), with forecasts and estimates in "USD million" for the period 2026-2030, as well as historical data from 2020-2024 for the following segments.

  • Application
    • Musculoskeletal
    • Neurological
    • Cardiovascular and pulmonary
    • Pediatric
    • Others
  • Type
    • Physiotherapy services
    • Physiotherapy equipment and accessories
  • Age group
    • Adults
    • Elderly
    • Children
  • Geography
    • North America
      • US
      • Canada
      • Mexico
    • Europe
      • Germany
      • UK
      • France
    • Asia
    • Rest of World (ROW)

By Application Insights

The musculoskeletal segment is estimated to witness significant growth during the forecast period.

The musculoskeletal segment is the primary revenue driver in the physiotherapy market, focusing on restoring function to muscles, bones, and ligaments.

This area addresses the rising prevalence of chronic conditions and age-related degenerative disorders, with a growing emphasis on personalized rehabilitation protocols that blend clinical intervention with home-based exercise.

Advanced imaging integration has become a critical standard, with practitioners utilizing diagnostic ultrasound and real-time motion-tracking software to refine manual therapy and exercise prescriptions.

This data-driven approach, which includes the use of myofascial release techniques, is crucial as musculoskeletal physiotherapy is increasingly seen as a cost-effective alternative to surgery.

The adoption of a biopsychosocial model of care addresses both physical and psychological barriers, improving outcomes by over 15% in patient adherence.

Request Free Sample

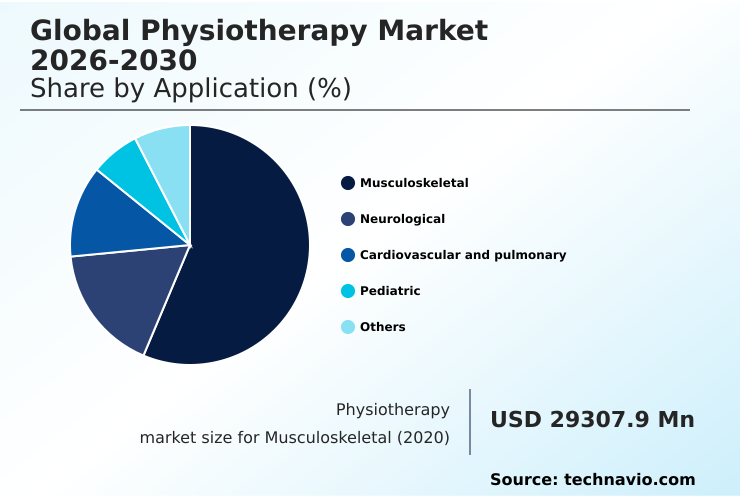
The Musculoskeletal segment was valued at USD 31.86 billion in 2024 and showed a gradual increase during the forecast period.

Request Free Sample

Regional Analysis

North America is estimated to contribute 40.6% to the growth of the global market during the forecast period.Technavio’s analysts have elaborately explained the regional trends and drivers that shape the market during the forecast period.

See How Physiotherapy Market Demand is Rising in North America Request Free Sample

The market's geographic landscape is characterized by varied adoption rates and regional priorities. In North America, the focus is on integrating advanced technologies to manage chronic conditions, with a strong emphasis on musculoskeletal disorder treatment.

Europe is defined by comprehensive public healthcare systems concentrating on geriatric frailty management and the implementation of a multi-disciplinary health integration approach.

Meanwhile, Asia is experiencing the fastest growth, driven by healthcare modernization and a rising middle class seeking quality care. This regional push includes the development of gender-specific musculoskeletal care centers, reflecting a global trend toward specialization.

The implementation of AI has been shown to improve diagnostic accuracy by up to 25%, a crucial factor for providers in competitive markets. Continuous patient monitoring is becoming standard in developed regions, improving outcomes and operational efficiency.

Market Dynamics

Our researchers analyzed the data with 2025 as the base year, along with the key drivers, trends, and challenges. A holistic analysis of drivers will help companies refine their marketing strategies to gain a competitive advantage.

  • The physiotherapy market's evolution is evident in the detailed examination of specific treatment pathways and their operational impact. For instance, analyzing the cost of physiotherapy equipment for clinics reveals a strategic shift towards modular systems that integrate multiple modalities, reducing capital expenditure.
  • When comparing electrotherapy and ultrasound therapy, providers are using data to determine which is more effective for specific conditions, optimizing treatment plans and patient throughput. The effectiveness of virtual reality in physiotherapy is particularly notable in pediatric and neurological applications, where it has been shown to improve engagement and adherence.
  • Similarly, the role of physiotherapy in chronic pain management is expanding, with a focus on non-pharmacological interventions. The benefits of hydrotherapy for arthritis are well-documented, making it a key offering in geriatric care facilities. The return on investment for robotic exoskeletons in spinal cord injury rehabilitation is becoming clearer, justifying their high initial cost with long-term functional gains.
  • Furthermore, establishing clear physiotherapy billing codes for remote monitoring has unlocked new revenue streams and improved access to care, with some clinics reporting a 15% increase in patient management capacity without adding staff. The integration of physiotherapy with corporate wellness programs is also proving effective for sports injury prevention and managing clinician burnout in physiotherapy clinics by diversifying service offerings.

What are the key market drivers leading to the rise in the adoption of Physiotherapy Industry?

  • The integration of AI-driven predictive rehabilitation and personalized treatment algorithms is a key driver for market growth.

  • Market growth is significantly propelled by technological innovation and new care delivery frameworks. The integration of predictive rehabilitation algorithms allows therapists to forecast recovery trajectories with greater accuracy, optimizing treatment plans from the outset.
  • Automated postural assessment tools are streamlining diagnostics, enabling a single clinician to process patient assessments 40% faster than manual methods. This efficiency is critical in addressing workforce shortages.
  • The expansion of remote care, supported by a favorable value-based reimbursement landscape, is a primary driver. These systems facilitate continuous progress tracking, which is essential for achieving documented functional outcomes.
  • The development of motor learning strategies within these platforms is enhancing the effectiveness of remote interventions, improving patient recovery times by an average of 10-15% compared to non-monitored home programs.

What are the market trends shaping the Physiotherapy Industry?

  • A surging incidence of chronic musculoskeletal disorders and geriatric frailty, compounded by lifestyle-induced health issues, is a primary trend shaping the market.

  • Key trends are reshaping the physiotherapy market, driven by demographic shifts and evolving healthcare philosophies. The rising incidence of chronic conditions necessitates a move towards comprehensive chronic disease physical management, while an aging population creates high demand for specialized fall prevention programs. This has elevated the importance of first-contact practitioner roles to streamline patient access and reduce healthcare system loads.
  • The emphasis on value-based care is accelerating the adoption of technologies that offer clinical-grade precision in tracking outcomes. Practices that integrate gamified rehabilitation interfaces report patient engagement rates that are up to 30% higher than traditional methods.
  • Moreover, a focus on osteoporosis management is becoming a standard offering in geriatric-focused clinics, with treatment efficacy improving by nearly 15% when combined with new diagnostic tools.

What challenges does the Physiotherapy Industry face during its growth?

  • Critical workforce shortages and a crisis of clinician burnout present a key challenge affecting industry growth.

  • The market faces significant operational and structural challenges that temper its growth potential. A critical shortage of qualified therapists creates a major bottleneck, with patient wait times in some rural areas increasing by over 50%.
  • This strain is compounded by the complexity of transitioning to new care models, where a lack of standardized patient adherence tracking metrics complicates efforts to secure consistent reimbursement. The proliferation of dry needling and other specialized services requires ongoing education, yet training budgets remain tight. Furthermore, the principles of neuroplasticity demand intensive, one-on-one therapy, which is difficult to scale.
  • Kinesiology applications are also becoming more complex, requiring advanced equipment. Some clinics report that administrative overhead associated with new compliance measures has increased non-billable hours by up to 20%, impacting overall profitability and the ability to invest in growth.

Exclusive Technavio Analysis on Customer Landscape

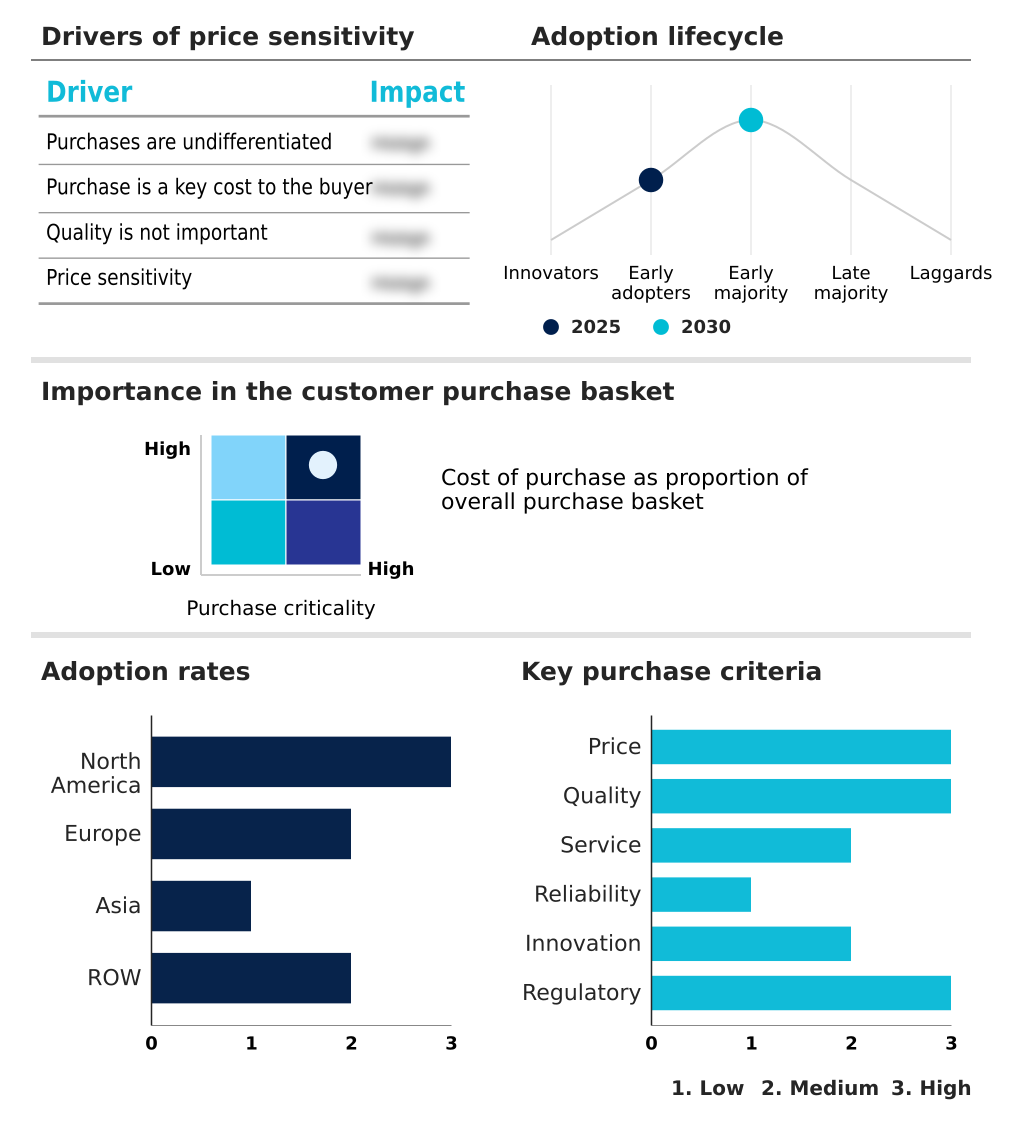
The physiotherapy market forecasting report includes the adoption lifecycle of the market, covering from the innovator’s stage to the laggard’s stage. It focuses on adoption rates in different regions based on penetration. Furthermore, the physiotherapy market report also includes key purchase criteria and drivers of price sensitivity to help companies evaluate and develop their market growth analysis strategies.

Customer Landscape of Physiotherapy Industry

Competitive Landscape

Companies are implementing various strategies, such as strategic alliances, physiotherapy market forecast, partnerships, mergers and acquisitions, geographical expansion, and product/service launches, to enhance their presence in the industry.

A. Algeo Ltd. - The company offers advanced clinical treatment solutions, including cryotherapy, shockwave therapy, and rehabilitation equipment for high-performance therapeutic outcomes.

The industry research and growth report includes detailed analyses of the competitive landscape of the market and information about key companies, including:

  • A. Algeo Ltd.
  • Accord Medical Products Ltd.
  • Arch Physiotherapy
  • CB Physiotherapy
  • Dr Spine Chiropractic Clinic
  • EMS Physio Ltd
  • Enovis Corp.
  • Enraf Nonius BV
  • GymnaUniphy NV
  • HMS Medical Systems
  • Ito Co. Ltd.
  • Mectronic Medicale S.r.l.
  • Medisport S.R.L.
  • Mettler Electronics Corp.
  • Minsu Healing Oasis LLC
  • Richmar
  • The Americare Co
  • Zelus Health Care
  • Zimmer MedizinSysteme GmbH

Qualitative and quantitative analysis of companies has been conducted to help clients understand the wider business environment as well as the strengths and weaknesses of key industry players. Data is qualitatively analyzed to categorize companies as pure play, category-focused, industry-focused, and diversified; it is quantitatively analyzed to categorize companies as dominant, leading, strong, tentative, and weak.

Recent Development and News in Physiotherapy market

  • In June, 2025, the Annual State of Pelvic Floor Physical Therapy Report highlighted a paradigm shift in the industry, uncovering how integrated pelvic health is essential for longevity and fall prevention in the aging female population.
  • In April, 2025, U.S. Physical Therapy Inc. announced the acquisition of an outpatient home care practice to provide comprehensive physical and occupational therapy services directly to patients within their residences.
  • In March, 2025, the American Physical Therapy Association published a comprehensive workforce forecast projecting that the national shortfall of physical therapist full-time equivalents would continue through 2037.
  • In February, 2025, PT Solutions Physical Therapy finalized the acquisition of OrthoCarolina’s physical therapy division and entered a strategic partnership with Novant Health to expand its service footprint across the Southeastern United States.

Dive into Technavio’s robust research methodology, blending expert interviews, extensive data synthesis, and validated models for unparalleled Physiotherapy Market insights. See full methodology.

Market Scope
Page number 284
Base year 2025
Historic period 2020-2024
Forecast period 2026-2030
Growth momentum & CAGR Accelerate at a CAGR of 5.1%
Market growth 2026-2030 USD 16651.7 million
Market structure Fragmented
YoY growth 2025-2026(%) 4.9%
Key countries US, Canada, Mexico, Germany, UK, France, Italy, Spain, The Netherlands, China, Japan, India, South Korea, Indonesia, Thailand, Brazil, South Africa, Saudi Arabia, UAE, Turkey, Argentina, Colombia and Egypt
Competitive landscape Leading Companies, Market Positioning of Companies, Competitive Strategies, and Industry Risks

Request Free Sample

Research Analyst Overview

  • The physiotherapy market is advancing through the integration of sophisticated technologies that redefine both clinical practice and business operations. The adoption of AI-driven predictive rehabilitation and wearable biofeedback devices enables a level of personalization previously unattainable, directly influencing the biopsychosocial model of care. The use of remote therapeutic monitoring and motion-tracking software is now central to delivering effective treatments.
  • Boardroom decisions are increasingly focused on the capital investment required for technologies like robotic exoskeletons and virtual reality rehabilitation systems, weighed against the benefits of improved patient outcomes and operational efficiency. The implementation of neuromodulation techniques and high-power laser therapy is becoming a competitive differentiator.
  • Firms leveraging femtech devices and smart orthotics for specialized applications such as pelvic floor physical therapy are capturing new market segments.
  • This technological shift, which includes diagnostic ultrasound and advanced electrotherapy devices, has led to a documented 20% improvement in diagnostic accuracy for complex musculoskeletal cases, forcing a strategic re-evaluation of service delivery models and compliance with evolving standards for tecar therapy and shockwave therapy.

What are the Key Data Covered in this Physiotherapy Market Research and Growth Report?

  • What is the expected growth of the Physiotherapy Market between 2026 and 2030?

    • USD 16.65 billion, at a CAGR of 5.1%

  • What segmentation does the market report cover?

    • The report is segmented by Application (Musculoskeletal, Neurological, Cardiovascular and pulmonary, Pediatric, and Others), Type (Physiotherapy services, and Physiotherapy equipment and accessories), Age Group (Adults, Elderly, and Children) and Geography (North America, Europe, Asia, Rest of World (ROW))

  • Which regions are analyzed in the report?

    • North America, Europe, Asia and Rest of World (ROW)

  • What are the key growth drivers and market challenges?

    • Integration AI-driven predictive rehabilitation and personalised treatment algorithms, Critical workforce shortages and crisis of clinician burnout

  • Who are the major players in the Physiotherapy Market?

    • A. Algeo Ltd., Accord Medical Products Ltd., Arch Physiotherapy, CB Physiotherapy, Dr Spine Chiropractic Clinic, EMS Physio Ltd, Enovis Corp., Enraf Nonius BV, GymnaUniphy NV, HMS Medical Systems, Ito Co. Ltd., Mectronic Medicale S.r.l., Medisport S.R.L., Mettler Electronics Corp., Minsu Healing Oasis LLC, Richmar, The Americare Co, Zelus Health Care and Zimmer MedizinSysteme GmbH

Market Research Insights

  • Market dynamics are increasingly shaped by a strategic shift toward a value-based healthcare model, where documented functional outcomes hold more weight than service volume. The adoption of direct access physiotherapy, where patients can see a practitioner without a referral, has improved service utilization by over 20% in some regions.
  • This transition is supported by technology, with hybrid care models blending in-clinic and remote sessions. For providers, this pivot means that investments in technologies that track patient adherence and functional independence metrics are no longer optional.
  • Firms that successfully integrate these tools can demonstrate superior outcomes, with some achieving a 10% greater alignment with value-based reimbursement criteria compared to those using traditional methods, creating a distinct competitive advantage.

We can help! Our analysts can customize this physiotherapy market research report to meet your requirements.

Get in touch

1. Executive Summary

1.1 Market overview

Executive Summary - Chart on Market Overview
Executive Summary - Data Table on Market Overview
Executive Summary - Chart on Global Market Characteristics
Executive Summary - Chart on Market by Geography
Executive Summary - Chart on Market Segmentation by Application
Executive Summary - Chart on Market Segmentation by Type
Executive Summary - Chart on Market Segmentation by Age Group
Executive Summary - Chart on Incremental Growth
Executive Summary - Data Table on Incremental Growth
Executive Summary - Chart on Company Market Positioning

2. Technavio Analysis

2.1 Analysis of price sensitivity, lifecycle, customer purchase basket, adoption rates, and purchase criteria

2.2 Criticality of inputs and Factors of differentiation

Chart on Overview on criticality of inputs and factors of differentiation

2.3 Factors of disruption

Chart on Overview on factors of disruption

2.4 Impact of drivers and challenges

Chart on Impact of drivers and challenges in 2025 and 2030

3. Market Landscape

3.1 Market ecosystem

Chart on Parent Market
Data Table on - Parent Market

3.2 Market characteristics

Chart on Market characteristics analysis

3.3 Value chain analysis

Chart on Value chain analysis

4. Market Sizing

4.1 Market definition

Data Table on Offerings of companies included in the market definition

4.2 Market segment analysis

Market segments

4.3 Market size 2025

4.4 Market outlook: Forecast for 2025-2030

Chart on Global - Market size and forecast 2025-2030 ($ million)
Data Table on Global - Market size and forecast 2025-2030 ($ million)
Chart on Global Market: Year-over-year growth 2025-2030 (%)
Data Table on Global Market: Year-over-year growth 2025-2030 (%)

5. Historic Market Size

5.1 Global Physiotherapy Market 2020 - 2024

Historic Market Size - Data Table on Global Physiotherapy Market 2020 - 2024 ($ million)

5.2 Application segment analysis 2020 - 2024

Historic Market Size - Application Segment 2020 - 2024 ($ million)

5.3 Type segment analysis 2020 - 2024

Historic Market Size - Type Segment 2020 - 2024 ($ million)

5.4 Age Group segment analysis 2020 - 2024

Historic Market Size - Age Group Segment 2020 - 2024 ($ million)

5.5 Geography segment analysis 2020 - 2024

Historic Market Size - Geography Segment 2020 - 2024 ($ million)

5.6 Country segment analysis 2020 - 2024

Historic Market Size - Country Segment 2020 - 2024 ($ million)

6. Qualitative Analysis

6.1 Impact of AI in global physiotherapy market

7. Five Forces Analysis

7.1 Five forces summary

Five forces analysis - Comparison between 2025 and 2030

7.2 Bargaining power of buyers

Bargaining power of buyers - Impact of key factors 2025 and 2030

7.3 Bargaining power of suppliers

Bargaining power of suppliers - Impact of key factors in 2025 and 2030

7.4 Threat of new entrants

Threat of new entrants - Impact of key factors in 2025 and 2030

7.5 Threat of substitutes

Threat of substitutes - Impact of key factors in 2025 and 2030

7.6 Threat of rivalry

Threat of rivalry - Impact of key factors in 2025 and 2030

7.7 Market condition

Chart on Market condition - Five forces 2025 and 2030

8. Market Segmentation by Application

8.1 Market segments

Chart on Application - Market share 2025-2030 (%)
Data Table on Application - Market share 2025-2030 (%)

8.2 Comparison by Application

Chart on Comparison by Application
Data Table on Comparison by Application

8.3 Musculoskeletal - Market size and forecast 2025-2030

Chart on Musculoskeletal - Market size and forecast 2025-2030 ($ million)
Data Table on Musculoskeletal - Market size and forecast 2025-2030 ($ million)
Chart on Musculoskeletal - Year-over-year growth 2025-2030 (%)
Data Table on Musculoskeletal - Year-over-year growth 2025-2030 (%)

8.4 Neurological - Market size and forecast 2025-2030

Chart on Neurological - Market size and forecast 2025-2030 ($ million)
Data Table on Neurological - Market size and forecast 2025-2030 ($ million)
Chart on Neurological - Year-over-year growth 2025-2030 (%)
Data Table on Neurological - Year-over-year growth 2025-2030 (%)

8.5 Cardiovascular and pulmonary - Market size and forecast 2025-2030

Chart on Cardiovascular and pulmonary - Market size and forecast 2025-2030 ($ million)
Data Table on Cardiovascular and pulmonary - Market size and forecast 2025-2030 ($ million)
Chart on Cardiovascular and pulmonary - Year-over-year growth 2025-2030 (%)
Data Table on Cardiovascular and pulmonary - Year-over-year growth 2025-2030 (%)

8.6 Pediatric - Market size and forecast 2025-2030

Chart on Pediatric - Market size and forecast 2025-2030 ($ million)
Data Table on Pediatric - Market size and forecast 2025-2030 ($ million)
Chart on Pediatric - Year-over-year growth 2025-2030 (%)
Data Table on Pediatric - Year-over-year growth 2025-2030 (%)

8.7 Others - Market size and forecast 2025-2030

Chart on Others - Market size and forecast 2025-2030 ($ million)
Data Table on Others - Market size and forecast 2025-2030 ($ million)
Chart on Others - Year-over-year growth 2025-2030 (%)
Data Table on Others - Year-over-year growth 2025-2030 (%)

8.8 Market opportunity by Application

Market opportunity by Application ($ million)
Data Table on Market opportunity by Application ($ million)

9. Market Segmentation by Type

9.1 Market segments

Chart on Type - Market share 2025-2030 (%)
Data Table on Type - Market share 2025-2030 (%)

9.2 Comparison by Type

Chart on Comparison by Type
Data Table on Comparison by Type

9.3 Physiotherapy services - Market size and forecast 2025-2030

Chart on Physiotherapy services - Market size and forecast 2025-2030 ($ million)
Data Table on Physiotherapy services - Market size and forecast 2025-2030 ($ million)
Chart on Physiotherapy services - Year-over-year growth 2025-2030 (%)
Data Table on Physiotherapy services - Year-over-year growth 2025-2030 (%)

9.4 Physiotherapy equipment and accessories - Market size and forecast 2025-2030

Chart on Physiotherapy equipment and accessories - Market size and forecast 2025-2030 ($ million)
Data Table on Physiotherapy equipment and accessories - Market size and forecast 2025-2030 ($ million)
Chart on Physiotherapy equipment and accessories - Year-over-year growth 2025-2030 (%)
Data Table on Physiotherapy equipment and accessories - Year-over-year growth 2025-2030 (%)

9.5 Market opportunity by Type

Market opportunity by Type ($ million)
Data Table on Market opportunity by Type ($ million)

10. Market Segmentation by Age Group

10.1 Market segments

Chart on Age Group - Market share 2025-2030 (%)
Data Table on Age Group - Market share 2025-2030 (%)

10.2 Comparison by Age Group

Chart on Comparison by Age Group
Data Table on Comparison by Age Group

10.3 Adults - Market size and forecast 2025-2030

Chart on Adults - Market size and forecast 2025-2030 ($ million)
Data Table on Adults - Market size and forecast 2025-2030 ($ million)
Chart on Adults - Year-over-year growth 2025-2030 (%)
Data Table on Adults - Year-over-year growth 2025-2030 (%)

10.4 Elderly - Market size and forecast 2025-2030

Chart on Elderly - Market size and forecast 2025-2030 ($ million)
Data Table on Elderly - Market size and forecast 2025-2030 ($ million)
Chart on Elderly - Year-over-year growth 2025-2030 (%)
Data Table on Elderly - Year-over-year growth 2025-2030 (%)

10.5 Children - Market size and forecast 2025-2030

Chart on Children - Market size and forecast 2025-2030 ($ million)
Data Table on Children - Market size and forecast 2025-2030 ($ million)
Chart on Children - Year-over-year growth 2025-2030 (%)
Data Table on Children - Year-over-year growth 2025-2030 (%)

10.6 Market opportunity by Age Group

Market opportunity by Age Group ($ million)
Data Table on Market opportunity by Age Group ($ million)

11. Customer Landscape

11.1 Customer landscape overview

Analysis of price sensitivity, lifecycle, customer purchase basket, adoption rates, and purchase criteria

12. Geographic Landscape

12.1 Geographic segmentation

Chart on Market share by geography 2025-2030 (%)
Data Table on Market share by geography 2025-2030 (%)

12.2 Geographic comparison

Chart on Geographic comparison
Data Table on Geographic comparison

12.3 North America - Market size and forecast 2025-2030

Chart on North America - Market size and forecast 2025-2030 ($ million)
Data Table on North America - Market size and forecast 2025-2030 ($ million)
Chart on North America - Year-over-year growth 2025-2030 (%)
Data Table on North America - Year-over-year growth 2025-2030 (%)
Chart on Regional Comparison - North America
Data Table on Regional Comparison - North America

12.3.1 US - Market size and forecast 2025-2030

Chart on US - Market size and forecast 2025-2030 ($ million)
Data Table on US - Market size and forecast 2025-2030 ($ million)
Chart on US - Year-over-year growth 2025-2030 (%)
Data Table on US - Year-over-year growth 2025-2030 (%)

12.3.2 Canada - Market size and forecast 2025-2030

Chart on Canada - Market size and forecast 2025-2030 ($ million)
Data Table on Canada - Market size and forecast 2025-2030 ($ million)
Chart on Canada - Year-over-year growth 2025-2030 (%)
Data Table on Canada - Year-over-year growth 2025-2030 (%)

12.3.3 Mexico - Market size and forecast 2025-2030

Chart on Mexico - Market size and forecast 2025-2030 ($ million)
Data Table on Mexico - Market size and forecast 2025-2030 ($ million)
Chart on Mexico - Year-over-year growth 2025-2030 (%)
Data Table on Mexico - Year-over-year growth 2025-2030 (%)

12.4 Europe - Market size and forecast 2025-2030

Chart on Europe - Market size and forecast 2025-2030 ($ million)
Data Table on Europe - Market size and forecast 2025-2030 ($ million)
Chart on Europe - Year-over-year growth 2025-2030 (%)
Data Table on Europe - Year-over-year growth 2025-2030 (%)
Chart on Regional Comparison - Europe
Data Table on Regional Comparison - Europe

12.4.1 Germany - Market size and forecast 2025-2030

Chart on Germany - Market size and forecast 2025-2030 ($ million)
Data Table on Germany - Market size and forecast 2025-2030 ($ million)
Chart on Germany - Year-over-year growth 2025-2030 (%)
Data Table on Germany - Year-over-year growth 2025-2030 (%)

12.4.2 UK - Market size and forecast 2025-2030

Chart on UK - Market size and forecast 2025-2030 ($ million)
Data Table on UK - Market size and forecast 2025-2030 ($ million)
Chart on UK - Year-over-year growth 2025-2030 (%)
Data Table on UK - Year-over-year growth 2025-2030 (%)

12.4.3 France - Market size and forecast 2025-2030

Chart on France - Market size and forecast 2025-2030 ($ million)
Data Table on France - Market size and forecast 2025-2030 ($ million)
Chart on France - Year-over-year growth 2025-2030 (%)
Data Table on France - Year-over-year growth 2025-2030 (%)

12.4.4 Italy - Market size and forecast 2025-2030

Chart on Italy - Market size and forecast 2025-2030 ($ million)
Data Table on Italy - Market size and forecast 2025-2030 ($ million)
Chart on Italy - Year-over-year growth 2025-2030 (%)
Data Table on Italy - Year-over-year growth 2025-2030 (%)

12.4.5 Spain - Market size and forecast 2025-2030

Chart on Spain - Market size and forecast 2025-2030 ($ million)
Data Table on Spain - Market size and forecast 2025-2030 ($ million)
Chart on Spain - Year-over-year growth 2025-2030 (%)
Data Table on Spain - Year-over-year growth 2025-2030 (%)

12.4.6 The Netherlands - Market size and forecast 2025-2030

Chart on The Netherlands - Market size and forecast 2025-2030 ($ million)
Data Table on The Netherlands - Market size and forecast 2025-2030 ($ million)
Chart on The Netherlands - Year-over-year growth 2025-2030 (%)
Data Table on The Netherlands - Year-over-year growth 2025-2030 (%)

12.5 Asia - Market size and forecast 2025-2030

Chart on Asia - Market size and forecast 2025-2030 ($ million)
Data Table on Asia - Market size and forecast 2025-2030 ($ million)
Chart on Asia - Year-over-year growth 2025-2030 (%)
Data Table on Asia - Year-over-year growth 2025-2030 (%)
Chart on Regional Comparison - Asia
Data Table on Regional Comparison - Asia

12.5.1 China - Market size and forecast 2025-2030

Chart on China - Market size and forecast 2025-2030 ($ million)
Data Table on China - Market size and forecast 2025-2030 ($ million)
Chart on China - Year-over-year growth 2025-2030 (%)
Data Table on China - Year-over-year growth 2025-2030 (%)

12.5.2 Japan - Market size and forecast 2025-2030

Chart on Japan - Market size and forecast 2025-2030 ($ million)
Data Table on Japan - Market size and forecast 2025-2030 ($ million)
Chart on Japan - Year-over-year growth 2025-2030 (%)
Data Table on Japan - Year-over-year growth 2025-2030 (%)

12.5.3 India - Market size and forecast 2025-2030

Chart on India - Market size and forecast 2025-2030 ($ million)
Data Table on India - Market size and forecast 2025-2030 ($ million)
Chart on India - Year-over-year growth 2025-2030 (%)
Data Table on India - Year-over-year growth 2025-2030 (%)

12.5.4 South Korea - Market size and forecast 2025-2030

Chart on South Korea - Market size and forecast 2025-2030 ($ million)
Data Table on South Korea - Market size and forecast 2025-2030 ($ million)
Chart on South Korea - Year-over-year growth 2025-2030 (%)
Data Table on South Korea - Year-over-year growth 2025-2030 (%)

12.5.5 Indonesia - Market size and forecast 2025-2030

Chart on Indonesia - Market size and forecast 2025-2030 ($ million)
Data Table on Indonesia - Market size and forecast 2025-2030 ($ million)
Chart on Indonesia - Year-over-year growth 2025-2030 (%)
Data Table on Indonesia - Year-over-year growth 2025-2030 (%)

12.5.6 Thailand - Market size and forecast 2025-2030

Chart on Thailand - Market size and forecast 2025-2030 ($ million)
Data Table on Thailand - Market size and forecast 2025-2030 ($ million)
Chart on Thailand - Year-over-year growth 2025-2030 (%)
Data Table on Thailand - Year-over-year growth 2025-2030 (%)

12.6 Rest of World (ROW) - Market size and forecast 2025-2030

Chart on Rest of World (ROW) - Market size and forecast 2025-2030 ($ million)
Data Table on Rest of World (ROW) - Market size and forecast 2025-2030 ($ million)
Chart on Rest of World (ROW) - Year-over-year growth 2025-2030 (%)
Data Table on Rest of World (ROW) - Year-over-year growth 2025-2030 (%)
Chart on Regional Comparison - Rest of World (ROW)
Data Table on Regional Comparison - Rest of World (ROW)

12.6.1 Brazil - Market size and forecast 2025-2030

Chart on Brazil - Market size and forecast 2025-2030 ($ million)
Data Table on Brazil - Market size and forecast 2025-2030 ($ million)
Chart on Brazil - Year-over-year growth 2025-2030 (%)
Data Table on Brazil - Year-over-year growth 2025-2030 (%)

12.6.2 South Africa - Market size and forecast 2025-2030

Chart on South Africa - Market size and forecast 2025-2030 ($ million)
Data Table on South Africa - Market size and forecast 2025-2030 ($ million)
Chart on South Africa - Year-over-year growth 2025-2030 (%)
Data Table on South Africa - Year-over-year growth 2025-2030 (%)

12.6.3 Saudi Arabia - Market size and forecast 2025-2030

Chart on Saudi Arabia - Market size and forecast 2025-2030 ($ million)
Data Table on Saudi Arabia - Market size and forecast 2025-2030 ($ million)
Chart on Saudi Arabia - Year-over-year growth 2025-2030 (%)
Data Table on Saudi Arabia - Year-over-year growth 2025-2030 (%)

12.6.4 UAE - Market size and forecast 2025-2030

Chart on UAE - Market size and forecast 2025-2030 ($ million)
Data Table on UAE - Market size and forecast 2025-2030 ($ million)
Chart on UAE - Year-over-year growth 2025-2030 (%)
Data Table on UAE - Year-over-year growth 2025-2030 (%)

12.6.5 Turkey - Market size and forecast 2025-2030

Chart on Turkey - Market size and forecast 2025-2030 ($ million)
Data Table on Turkey - Market size and forecast 2025-2030 ($ million)
Chart on Turkey - Year-over-year growth 2025-2030 (%)
Data Table on Turkey - Year-over-year growth 2025-2030 (%)

12.6.6 Argentina - Market size and forecast 2025-2030

Chart on Argentina - Market size and forecast 2025-2030 ($ million)
Data Table on Argentina - Market size and forecast 2025-2030 ($ million)
Chart on Argentina - Year-over-year growth 2025-2030 (%)
Data Table on Argentina - Year-over-year growth 2025-2030 (%)

12.6.7 Colombia - Market size and forecast 2025-2030

Chart on Colombia - Market size and forecast 2025-2030 ($ million)
Data Table on Colombia - Market size and forecast 2025-2030 ($ million)
Chart on Colombia - Year-over-year growth 2025-2030 (%)
Data Table on Colombia - Year-over-year growth 2025-2030 (%)

12.6.8 Egypt - Market size and forecast 2025-2030

Chart on Egypt - Market size and forecast 2025-2030 ($ million)
Data Table on Egypt - Market size and forecast 2025-2030 ($ million)
Chart on Egypt - Year-over-year growth 2025-2030 (%)
Data Table on Egypt - Year-over-year growth 2025-2030 (%)

12.7 Market opportunity by geography

Market opportunity by geography ($ million)
Data Tables on Market opportunity by geography ($ million)

13. Drivers, Challenges, and Opportunity

13.1 Market drivers

Integration AI-driven predictive rehabilitation and personalised treatment algorithms
Wearable biofeedback ecosystems and remote therapeutic monitoring
Evolution of geriatric functional independence and rise of longevity-focused care

13.2 Market challenges

Critical workforce shortages and crisis of clinician burnout
Reimbursement volatility and complexity of value-based care transition
Intensifying competition from non-traditional and alternative wellness providers

13.3 Impact of drivers and challenges

Impact of drivers and challenges in 2025 and 2030

13.4 Market opportunities

Surging incidence of chronic musculoskeletal disorders and geriatric frailty
Expansion of value-based care and multi-disciplinary health integration
Institutionalization of pelvic health and gender-specific musculoskeletal care

14. Competitive Landscape

14.1 Overview

14.2

Overview on criticality of inputs and factors of differentiation

14.3 Landscape disruption

Overview on factors of disruption

14.4 Industry risks

Impact of key risks on business

15. Competitive Analysis

15.1 Companies profiled

Companies covered

15.2 Company ranking index

15.3 Market positioning of companies

Matrix on companies position and classification

15.4 A. Algeo Ltd.

A. Algeo Ltd. - Overview
A. Algeo Ltd. - Product / Service
A. Algeo Ltd. - Key offerings
SWOT

15.5 Accord Medical Products Ltd.

Accord Medical Products Ltd. - Overview
Accord Medical Products Ltd. - Product / Service
Accord Medical Products Ltd. - Key offerings
SWOT

15.6 Arch Physiotherapy

Arch Physiotherapy - Overview
Arch Physiotherapy - Product / Service
Arch Physiotherapy - Key offerings
SWOT

15.7 Dr Spine Chiropractic Clinic

Dr Spine Chiropractic Clinic - Overview
Dr Spine Chiropractic Clinic - Product / Service
Dr Spine Chiropractic Clinic - Key offerings
SWOT

15.8 Enovis Corp.

Enovis Corp. - Overview
Enovis Corp. - Business segments
Enovis Corp. - Key news
Enovis Corp. - Key offerings
Enovis Corp. - Segment focus
SWOT

15.9 Enraf Nonius BV

Enraf Nonius BV - Overview
Enraf Nonius BV - Product / Service
Enraf Nonius BV - Key offerings
SWOT

15.10 GymnaUniphy NV

GymnaUniphy NV - Overview
GymnaUniphy NV - Product / Service
GymnaUniphy NV - Key offerings
SWOT

15.11 HMS Medical Systems

HMS Medical Systems - Overview
HMS Medical Systems - Product / Service
HMS Medical Systems - Key offerings
SWOT

15.12 Ito Co. Ltd.

Ito Co. Ltd. - Overview
Ito Co. Ltd. - Product / Service
Ito Co. Ltd. - Key offerings
SWOT

15.13 Mectronic Medicale S.r.l.

Mectronic Medicale S.r.l. - Overview
Mectronic Medicale S.r.l. - Product / Service
Mectronic Medicale S.r.l. - Key offerings
SWOT

15.14 Minsu Healing Oasis LLC

Minsu Healing Oasis LLC - Overview
Minsu Healing Oasis LLC - Product / Service
Minsu Healing Oasis LLC - Key offerings
SWOT

15.15 Richmar

Richmar - Overview
Richmar - Product / Service
Richmar - Key offerings
SWOT

15.16 The Americare Co

The Americare Co - Overview
The Americare Co - Product / Service
The Americare Co - Key offerings
SWOT

15.17 Zelus Health Care

Zelus Health Care - Overview
Zelus Health Care - Product / Service
Zelus Health Care - Key offerings
SWOT

15.18 Zimmer MedizinSysteme GmbH

Zimmer MedizinSysteme GmbH - Overview
Zimmer MedizinSysteme GmbH - Product / Service
Zimmer MedizinSysteme GmbH - Key offerings
SWOT

16. Appendix

16.1 Scope of the report

Market definition
Objectives
Notes and caveats

16.2 Inclusions and exclusions checklist

Inclusions checklist
Exclusions checklist

16.3 Currency conversion rates for US$

16.4 Research methodology

16.5 Data procurement

Information sources

16.6 Data validation

16.7 Validation techniques employed for market sizing

16.8 Data synthesis

16.9 360 degree market analysis

16.10 List of abbreviations

Research Methodology

Technavio presents a detailed picture of the market by way of study, synthesis, and summation of data from multiple sources. The analysts have presented the various facets of the market with a particular focus on identifying the key industry influencers. The data thus presented is comprehensive, reliable, and the result of extensive research, both primary and secondary.

INFORMATION SOURCES

Primary sources

  • Manufacturers and suppliers
  • Channel partners
  • Industry experts
  • Strategic decision makers

Secondary sources

  • Industry journals and periodicals
  • Government data
  • Financial reports of key industry players
  • Historical data
  • Press releases

DATA ANALYSIS

Data Synthesis

  • Collation of data
  • Estimation of key figures
  • Analysis of derived insights

Data Validation

  • Triangulation with data models
  • Reference against proprietary databases
  • Corroboration with industry experts

REPORT WRITING

Qualitative

  • Market drivers
  • Market challenges
  • Market trends
  • Five forces analysis

Quantitative

  • Market size and forecast
  • Market segmentation
  • Geographical insights
  • Competitive landscape

Interested in this report?

Get your sample now to see our research methodology and insights!

Download Now

Frequently Asked Questions

Physiotherapy market growth will increase by USD 16651.7 million during 2026-2030.

The Physiotherapy market is expected to grow at a CAGR of 5.1% during 2026-2030.

Physiotherapy market is segmented by Application (Musculoskeletal, Neurological, Cardiovascular and pulmonary, Pediatric, Others) Type (Physiotherapy services, Physiotherapy equipment and accessories) Age group (Adults, Elderly, Children)

A. Algeo Ltd., Accord Medical Products Ltd., Arch Physiotherapy, CB Physiotherapy, Dr Spine Chiropractic Clinic, EMS Physio Ltd, Enovis Corp., Enraf Nonius BV, GymnaUniphy NV, HMS Medical Systems, Ito Co. Ltd., Mectronic Medicale S.r.l., Medisport S.R.L., Mettler Electronics Corp., Minsu Healing Oasis LLC, Richmar, The Americare Co, Zelus Health Care, Zimmer MedizinSysteme GmbH are a few of the key vendors in the Physiotherapy market.

North America will register the highest growth rate of 40.6% among the other regions. Therefore, the Physiotherapy market in North America is expected to garner significant business opportunities for the vendors during the forecast period.

US, Canada, Mexico, Germany, UK, France, Italy, Spain, The Netherlands, China, Japan, India, South Korea, Indonesia, Thailand, Brazil, South Africa, Saudi Arabia, UAE, Turkey, Argentina, Colombia, Egypt

  • Integration AI-driven predictive rehabilitation and personalised treatment algorithms is the driving factor this market.

The Physiotherapy market vendors should focus on grabbing business opportunities from the Application segment as it accounted for the largest market share in the base year.
RIA - Research AI Assistant
Ask RIA