Photo Printing And Merchandise Market Analysis, Size, and Forecast 2025-2029: North America (US, Canada, and Mexico), Europe (Germany, UK, and France), APAC (China, Japan, and India), South America (Brazil, Argentina, and Colombia), Middle East and Africa (UAE, Saudi Arabia, and South Africa), and Rest of World (ROW)

Photo Printing And Merchandise Market Analysis, Size, and Forecast 2025-2029:
North America (US, Canada, and Mexico), Europe (Germany, UK, and France), APAC (China, Japan, and India), South America (Brazil, Argentina, and Colombia), Middle East and Africa (UAE, Saudi Arabia, and South Africa), and Rest of World (ROW)

Published: Dec 2025 299 Pages SKU: IRTNTR43676

Market Overview at a Glance

$7.39 B
Market Opportunity
5.4%
CAGR 2024 - 2029
40.9%
North America Growth
$16.78 B
Online segment 2023

Photo Printing And Merchandise Market Size 2025-2029

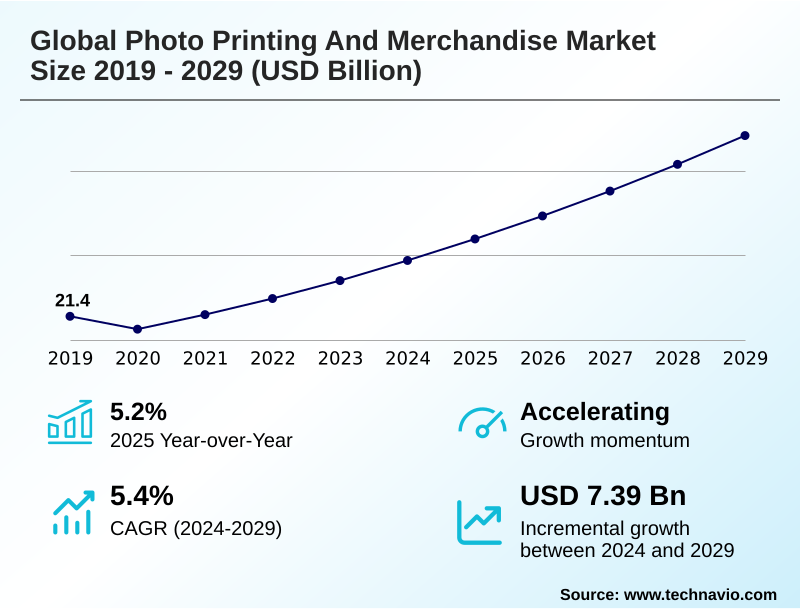
The photo printing and merchandise market size is valued to increase by USD 7.39 billion, at a CAGR of 5.4% from 2024 to 2029. Rise in gifting culture will drive the photo printing and merchandise market.

Major Market Trends & Insights

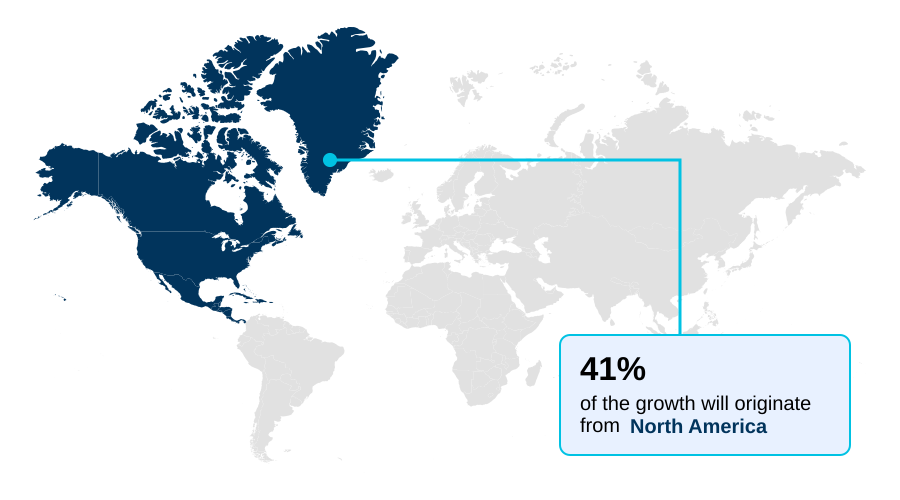
  • North America dominated the market and accounted for a 40.9% growth during the forecast period.
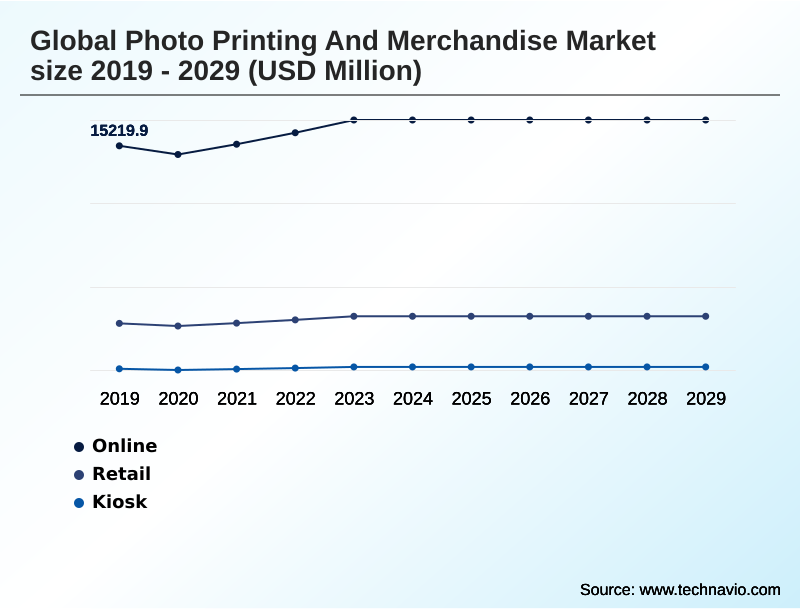
  • By Distribution Channel - Online segment was valued at USD 16.78 billion in 2023
  • By Device - Desktop segment accounted for the largest market revenue share in 2023

Market Size & Forecast

  • Market Opportunities: USD 10.68 billion
  • Market Future Opportunities: USD 7.39 billion
  • CAGR from 2024 to 2029 : 5.4%

Market Summary

  • The photo printing and merchandise market is undergoing a significant transformation, fueled by the convergence of digital content creation and consumer demand for personalization. Core drivers include the explosive growth of user-generated content from smartphones and social media, coupled with a cultural shift towards unique, personalized gifting over mass-produced goods.
  • This creates a vast reservoir of digital assets ready for monetization. Key trends such as the rise of print-on-demand (POD) platforms and innovations in printing technologies like dye-sublimation and direct-to-garment (DTG) are lowering entry barriers and expanding product possibilities. However, the industry faces challenges from the convenience of digital-only sharing platforms and the operational complexities of extreme demand seasonality.
  • For instance, businesses must build infrastructure capable of handling holiday surges, which can lead to significant underutilization during off-peak months. Successfully navigating this requires sophisticated demand forecasting and flexible production models, where an optimized supply chain can mean the difference between profitability and loss during critical sales periods.
  • The market's future hinges on leveraging technology to simplify curation and effectively communicate the lasting value of physical products.

What will be the Size of the Photo Printing And Merchandise Market during the forecast period?

Get Key Insights on Market Forecast (PDF) Request Free Sample

How is the Photo Printing And Merchandise Market Segmented?

The photo printing and merchandise industry research report provides comprehensive data (region-wise segment analysis), with forecasts and estimates in "USD million" for the period 2025-2029, as well as historical data from 2019-2023 for the following segments.

  • Distribution channel
    • Online
    • Retail
    • Kiosk
  • Device
    • Desktop
    • Mobile
  • Product
    • Photo only
    • Wall decor
    • Photo cards
    • Photo gifts
    • Calendars
  • Geography
    • North America
      • US
      • Canada
      • Mexico
    • Europe
      • Germany
      • UK
      • France
    • APAC
      • China
      • Japan
      • India
    • South America
      • Brazil
      • Argentina
      • Colombia
    • Middle East and Africa
      • UAE
      • Saudi Arabia
      • South Africa
    • Rest of World (ROW)

By Distribution Channel Insights

The online segment is estimated to witness significant growth during the forecast period.

The online segment remains the primary channel, driven by the accessibility of web-to-print software and a consumer shift towards e-commerce.

This channel's growth is supported by a mass customization model that allows for the creation of highly personalized photo gifts and custom photo books online.

The integration of print-on-demand (POD) services via digital workflow automation enables a vast range of products, including canvas and metal wall art and custom phone cases.

The use of white-label fulfillment further democratizes the market, allowing smaller entities to offer products like personalized coffee mugs and print-on-demand t-shirts without significant capital investment.

Advanced platforms leverage dye-sublimation printing and direct-to-garment (DTG) technology, with some achieving a 15% reduction in cart abandonment through AI-driven user experience enhancements. The operational backbone relies on UV printing technology for diverse substrate applications.

Request Free Sample

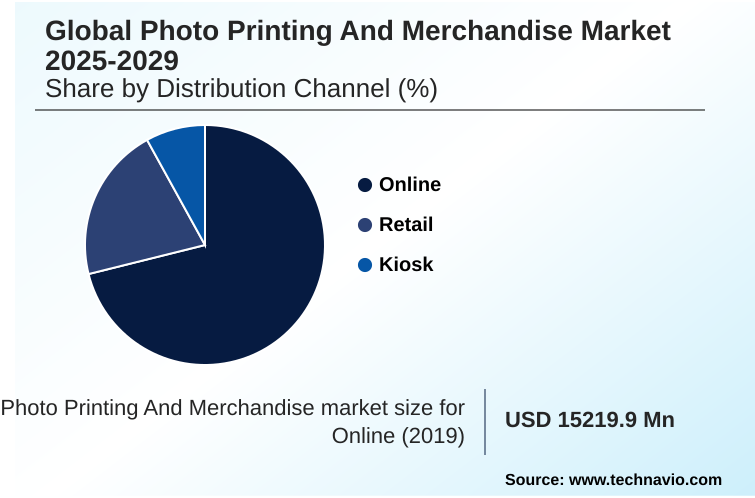
The Online segment was valued at USD 16.78 billion in 2023 and showed a gradual increase during the forecast period.

Request Free Sample

Regional Analysis

North America is estimated to contribute 40.9% to the growth of the global market during the forecast period.Technavio’s analysts have elaborately explained the regional trends and drivers that shape the market during the forecast period.

See How Photo Printing And Merchandise Market Demand is Rising in North America Request Free Sample

The geographic landscape of the market is led by North America, which accounts for over 40% of global opportunities, driven by high consumer spending on personalized wall decor and custom apparel printing.

This mature market leverages advanced e-commerce API integration and AI-powered photo curation to enhance user experience. In Europe, the focus is on high-quality output, with widespread adoption of sophisticated photo book creation tools and demand for traditional silver halide photos.

The APAC region is the fastest-growing, characterized by a mobile-first approach to creating custom greeting cards and baby photo announcement cards. Across these regions, companies adopting distributed manufacturing networks have successfully reduced shipping times by up to 60%.

This strategy is crucial for delivering diverse photo merchandise substrates and dye sublimation products, including wedding photo albums and items from direct-to-garment printing services, efficiently and cost-effectively to a global customer base.

Market Dynamics

Our researchers analyzed the data with 2024 as the base year, along with the key drivers, trends, and challenges. A holistic analysis of drivers will help companies refine their marketing strategies to gain a competitive advantage.

  • Strategic decision-making in the photo printing and merchandise market requires a deep understanding of evolving consumer behaviors and technological capabilities. Businesses must determine the best online service for photo books while also considering how to start a print-on-demand business to capture the creator economy. Technical considerations are paramount, such as evaluating dye-sublimation vs.
  • heat transfer for mugs or mastering UV printing on wood and glass for high-margin products. Success hinges on creating personalized wall art from photos and offering custom apparel printing for small business clients. The market is moving towards high-resolution metal photo prints online, supported by an automated workflow for e-commerce printing.
  • To drive sales, companies focus on curating personalized photo gift ideas for holidays and refining web-to-print software for custom stationery. Internally, implementing AI photo enhancement for better prints is becoming standard. Platforms that integrate AI-powered design assistants see user engagement times shorten by more than half compared to manual-only tools, directly impacting conversion rates.
  • This efficiency gain underscores the importance of technological adoption. Key product differentiators include layflat vs standard photo book binding and designing custom photo calendars online. For entrepreneurs, understanding how to sell photo merchandise on etsy is crucial. Operationally, an omnichannel strategy for photo retail and managing seasonal demand in printing are key challenges.
  • Firms must also navigate GDPR compliance for photo sharing sites and copyright issues with user-uploaded content to mitigate risk. Ultimately, finding the best substrate for photo printing and achieving cost-effective large format printing are fundamental to profitability.

What are the key market drivers leading to the rise in the adoption of Photo Printing And Merchandise Industry?

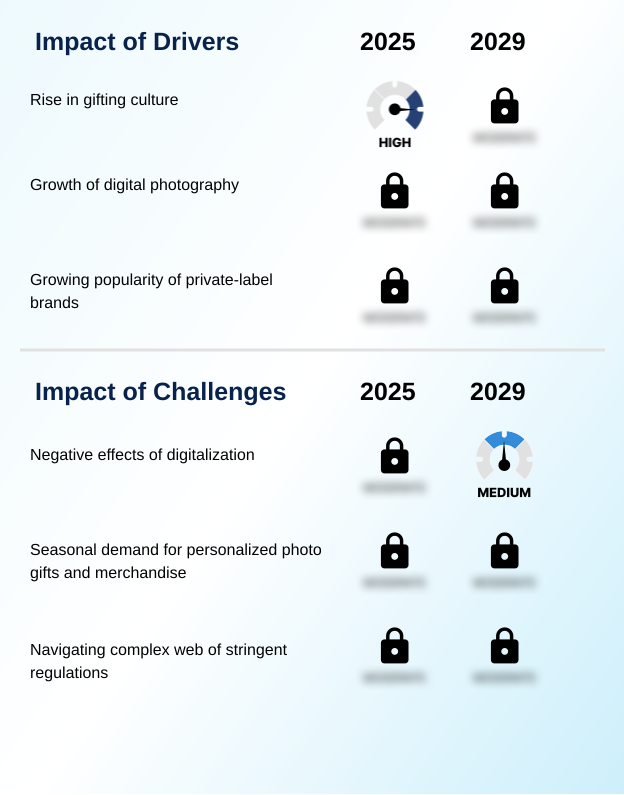
  • The rise in a global gifting culture, where personalized and meaningful items are highly valued, is a key driver for market growth.

  • Market growth is fundamentally driven by the expanding scope of personalization and the integration of sophisticated creation tools.
  • The demand for photo product personalization is broadening into new categories like personalized home goods and custom stationery printing, where platforms leveraging an AI-enhanced photo editor see a 20% increase in average order value.
  • Innovations such as interactive 3D product previews allow consumers to visualize everything from custom photo calendars to complex layflat photo books before purchase. This has been particularly effective for high-value metal and acrylic prints and large format photo prints.
  • The creator economy is also a significant driver, with artist merchandise platforms relying on seamless e-commerce print fulfillment to deliver corporate branded merchandise and customizable stationery sets.
  • The implementation of digital image enhancement algorithms at the point of upload reduces print failure rates by up to 15%, boosting both customer satisfaction and operational margins.

What are the market trends shaping the Photo Printing And Merchandise Industry?

  • A significant market trend is the growing prominence of print-on-demand services, a model that is reshaping the industry by lowering entry barriers and enabling mass customization at scale.

  • Key market trends are centered on enhancing convenience and product variety through technological integration. The omnichannel retail strategy is a dominant force, with click-and-collect services showing a 40% higher adoption rate in urban areas compared to standard delivery. This model allows consumers to order personalized blankets and pillows or a custom photo puzzle customization online and retrieve it locally.
  • Self-service photo kiosks are also being upgraded, with next-generation units reducing transaction times by 30% for same-day photo printing. In production, advancements in large format digital printing and sophisticated color management systems are enabling higher print resolution (DPI), ensuring vibrant and accurate reproduction for UV printed promotional items.
  • The use of fade-resistant inks has become a standard quality expectation for all online photo printing services, extending the life and value of personalized items available at a photo kiosk near me.

What challenges does the Photo Printing And Merchandise Industry face during its growth?

  • A key challenge affecting industry growth is the negative effect of digitalization, as free digital sharing platforms act as substitutes for physical photo products.

  • Navigating market challenges requires a focus on overcoming digital inertia and managing regulatory complexities. The primary challenge is the digital shoebox effect, where consumers are overwhelmed by content; however, platforms integrating AI-driven photo book layout software report a 25% higher project completion rate.
  • To encourage user-generated content monetization, companies are offering more intuitive photo gift creation apps for designing unique personalized gifts and personalized wall art design. A significant operational hurdle is seasonal demand forecasting, where inaccuracies can increase excess inventory costs by up to 40% in off-seasons.
  • Furthermore, ensuring data privacy compliance (GDPR) and having robust copyright infringement procedures (DMCA) are non-negotiable for building consumer trust. The strategic use of a distributed manufacturing network for custom apparel fulfillment and family photo album ideas is key to mitigating logistical risks, promoting high-quality photo printing, and offering eco-friendly printing options to a discerning global audience.

Exclusive Technavio Analysis on Customer Landscape

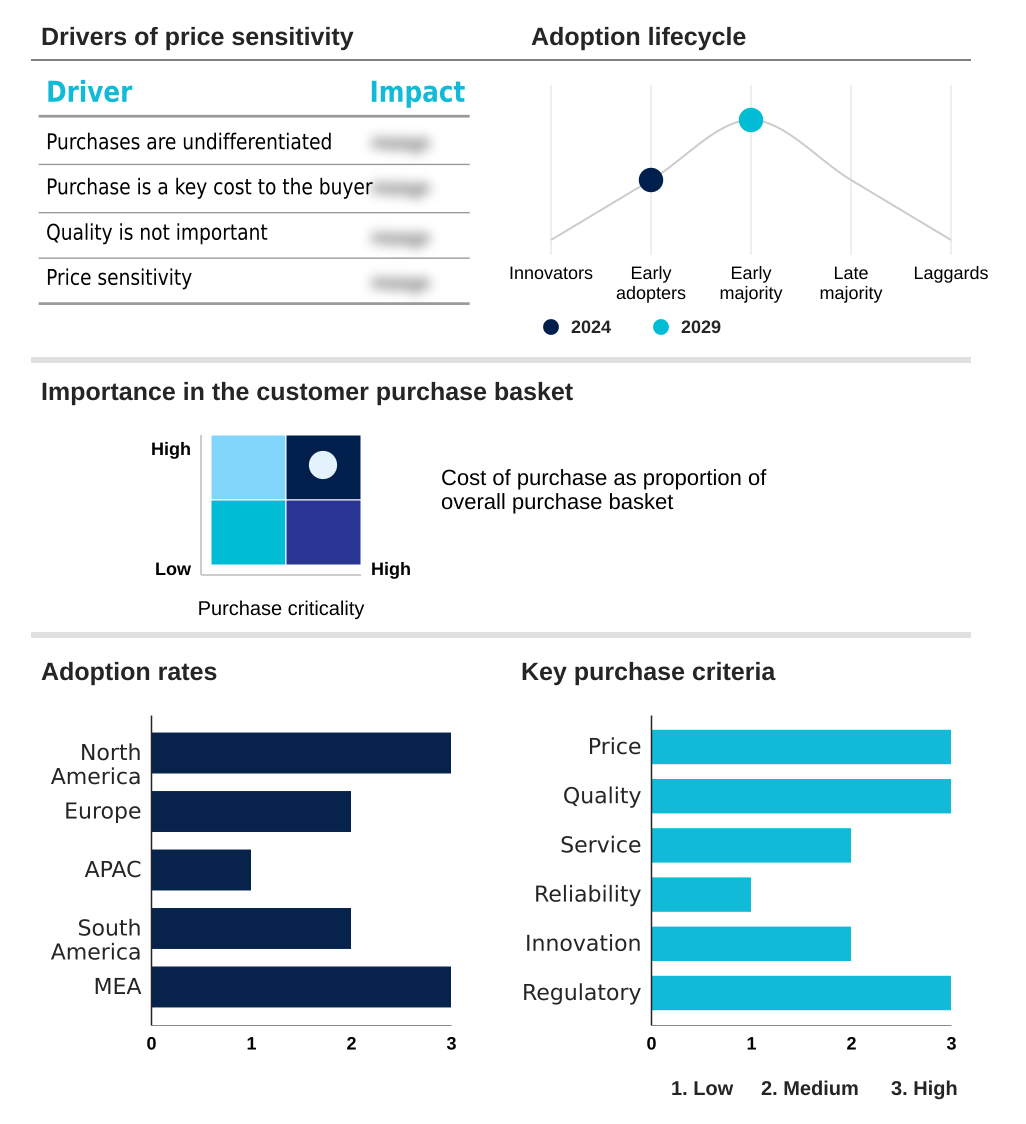
The photo printing and merchandise market forecasting report includes the adoption lifecycle of the market, covering from the innovator’s stage to the laggard’s stage. It focuses on adoption rates in different regions based on penetration. Furthermore, the photo printing and merchandise market report also includes key purchase criteria and drivers of price sensitivity to help companies evaluate and develop their market growth analysis strategies.

Customer Landscape of Photo Printing And Merchandise Industry

Competitive Landscape

Companies are implementing various strategies, such as strategic alliances, photo printing and merchandise market forecast, partnerships, mergers and acquisitions, geographical expansion, and product/service launches, to enhance their presence in the industry.

Amazon.com Inc. - A portfolio of specialized brands provides web-to-print mass customization, catering to both consumer and business needs for personalized promotional products, signage, and apparel.

The industry research and growth report includes detailed analyses of the competitive landscape of the market and information about key companies, including:

  • Amazon.com Inc.
  • American Greetings Corp.
  • Card Factory Plc
  • Cimpress Plc
  • Circle Graphics Inc.
  • District Photo Inc.
  • Eastman Kodak Co.
  • ezprints Inc.
  • Ifolor AG
  • Minted LLC
  • Nations Photo Lab
  • Perion Network Ltd.
  • Prodigi Group Ltd.
  • Shutterfly Inc.
  • Tesco Plc
  • Walgreens Boots Alliance Inc.
  • Walmart Inc.
  • Zazzle Inc.

Qualitative and quantitative analysis of companies has been conducted to help clients understand the wider business environment as well as the strengths and weaknesses of key industry players. Data is qualitatively analyzed to categorize companies as pure play, category-focused, industry-focused, and diversified; it is quantitatively analyzed to categorize companies as dominant, leading, strong, tentative, and weak.

Recent Development and News in Photo printing and merchandise market

  • In November 2024, Cimpress Plc acquires a leading AI-powered design software company to integrate generative art capabilities across its mass customization platforms, enhancing its product personalization offerings.
  • In January 2025, Shutterfly Inc. announces a strategic partnership with a major social media platform, introducing an integrated feature that allows users to order physical merchandise directly from their content feeds.
  • In April 2025, Eastman Kodak Co. launches a new line of eco-friendly photo kiosks built with recycled materials and featuring energy-efficient printing technology, targeting environmentally conscious retail partners.
  • In May 2025, Prodigi Group Ltd. expands its distributed manufacturing network into South America by opening two new automated fulfillment centers in Brazil, reducing shipping times for regional customers by an average of 60%.

Dive into Technavio’s robust research methodology, blending expert interviews, extensive data synthesis, and validated models for unparalleled Photo Printing And Merchandise Market insights. See full methodology.

Market Scope
Page number 299
Base year 2024
Historic period 2019-2023
Forecast period 2025-2029
Growth momentum & CAGR Accelerate at a CAGR of 5.4%
Market growth 2025-2029 USD 7387.4 million
Market structure Fragmented
YoY growth 2024-2025(%) 5.2%
Key countries US, Canada, Mexico, Germany, UK, France, Italy, Spain, The Netherlands, China, Japan, India, South Korea, Australia, Indonesia, Brazil, Argentina, Colombia, UAE, Saudi Arabia, South Africa, Israel and Turkey
Competitive landscape Leading Companies, Market Positioning of Companies, Competitive Strategies, and Industry Risks

Request Free Sample

Research Analyst Overview

  • The photo printing and merchandise market is defined by its synthesis of technology and consumer sentiment, where the value of a product is tied to personal memory. The industry's operational core is shifting toward a mass customization model, enabled by technologies like dye-sublimation printing, direct-to-garment (DTG), and sophisticated web-to-print software.
  • Print-on-demand (POD) services are particularly transformative, facilitating market entry for smaller players through white-label fulfillment. For boardroom consideration, the growing consumer demand for sustainability is directly impacting product strategy, forcing a re-evaluation of photo merchandise substrates and supply chains. Companies are now investing in eco-friendly materials and transparent production processes.
  • The implementation of digital workflow automation and job-ganging software has become critical for managing costs, with some operators achieving a 30% reduction in material waste. This efficiency is vital in a market where firms must offer everything from photo book creation tools and personalized wall decor to custom apparel printing.
  • Future success will depend on continued innovation, including the use of AI-powered photo curation and UV printing technology, to meet evolving consumer expectations for unique and meaningful products.

What are the Key Data Covered in this Photo Printing And Merchandise Market Research and Growth Report?

  • What is the expected growth of the Photo Printing And Merchandise Market between 2025 and 2029?

    • USD 7.39 billion, at a CAGR of 5.4%

  • What segmentation does the market report cover?

    • The report is segmented by Distribution Channel (Online, Retail, and Kiosk), Device (Desktop, and Mobile), Product (Photo only, Wall decor, Photo cards, Photo gifts, and Calendars) and Geography (North America, Europe, APAC, South America, Middle East and Africa)

  • Which regions are analyzed in the report?

    • North America, Europe, APAC, South America and Middle East and Africa

  • What are the key growth drivers and market challenges?

    • Rise in gifting culture, Negative effects of digitalization

  • Who are the major players in the Photo Printing And Merchandise Market?

    • Amazon.com Inc., American Greetings Corp., Card Factory Plc, Cimpress Plc, Circle Graphics Inc., District Photo Inc., Eastman Kodak Co., ezprints Inc., Ifolor AG, Minted LLC, Nations Photo Lab, Perion Network Ltd., Prodigi Group Ltd., Shutterfly Inc., Tesco Plc, Walgreens Boots Alliance Inc., Walmart Inc. and Zazzle Inc.

Market Research Insights

  • Market dynamics are increasingly shaped by omnichannel strategies, which have demonstrated a 25% higher customer retention rate compared to purely online models. The integration of e-commerce API integration with in-store pickup options enhances consumer convenience for personalized photo gifts and wedding photo albums.
  • Furthermore, the adoption of automated workflows in production has reduced order processing errors by over 90%, improving efficiency for direct-to-garment printing services and the creation of baby photo announcement cards. The ability to offer a diverse range of dye sublimation products, custom greeting cards, and unique personalized gifts is critical.
  • These advancements allow vendors to capitalize on the demand for high-quality, customized items like canvas and metal wall art while maintaining operational excellence and profitability. The focus remains on a seamless user journey from digital design to physical product.

We can help! Our analysts can customize this photo printing and merchandise market research report to meet your requirements.

Get in touch

1. Executive Summary

1.1 Market overview

Executive Summary - Chart on Market Overview
Executive Summary - Data Table on Market Overview
Executive Summary - Chart on Global Market Characteristics
Executive Summary - Chart on Market by Geography
Executive Summary - Chart on Market Segmentation by Distribution Channel
Executive Summary - Chart on Market Segmentation by Device
Executive Summary - Chart on Market Segmentation by Product
Executive Summary - Chart on Incremental Growth
Executive Summary - Data Table on Incremental Growth
Executive Summary - Chart on Company Market Positioning

2. Technavio Analysis

2.1 Analysis of price sensitivity, lifecycle, customer purchase basket, adoption rates, and purchase criteria

2.2 Criticality of inputs and Factors of differentiation

Chart on Overview on criticality of inputs and factors of differentiation

2.3 Factors of disruption

Chart on Overview on factors of disruption

2.4 Impact of drivers and challenges

Chart on Impact of drivers and challenges in 2024 and 2029

3. Market Landscape

3.1 Market ecosystem

Chart on Parent Market
Data Table on - Parent Market

3.2 Market characteristics

Chart on Market characteristics analysis

3.3 Value chain analysis

Chart on Value chain analysis

4. Market Sizing

4.1 Market definition

Data Table on Offerings of companies included in the market definition

4.2 Market segment analysis

Market segments

4.3 Market size 2024

4.4 Market outlook: Forecast for 2024-2029

Chart on Global - Market size and forecast 2024-2029 ($ million)
Data Table on Global - Market size and forecast 2024-2029 ($ million)
Chart on Global Market: Year-over-year growth 2024-2029 (%)
Data Table on Global Market: Year-over-year growth 2024-2029 (%)

5. Historic Market Size

5.1 Global Photo Printing And Merchandise Market 2019 - 2023

Historic Market Size - Data Table on Global Photo Printing And Merchandise Market 2019 - 2023 ($ million)

5.2 Distribution Channel segment analysis 2019 - 2023

Historic Market Size - Distribution Channel Segment 2019 - 2023 ($ million)

5.3 Device segment analysis 2019 - 2023

Historic Market Size - Device Segment 2019 - 2023 ($ million)

5.4 Product segment analysis 2019 - 2023

Historic Market Size - Product Segment 2019 - 2023 ($ million)

5.5 Geography segment analysis 2019 - 2023

Historic Market Size - Geography Segment 2019 - 2023 ($ million)

5.6 Country segment analysis 2019 - 2023

Historic Market Size - Country Segment 2019 - 2023 ($ million)

6. Qualitative Analysis

6.1 The AI impact on global photo printing and merchandise market

7. Five Forces Analysis

7.1 Five forces summary

Five forces analysis - Comparison between 2024 and 2029

7.2 Bargaining power of buyers

Bargaining power of buyers - Impact of key factors 2024 and 2029

7.3 Bargaining power of suppliers

Bargaining power of suppliers - Impact of key factors in 2024 and 2029

7.4 Threat of new entrants

Threat of new entrants - Impact of key factors in 2024 and 2029

7.5 Threat of substitutes

Threat of substitutes - Impact of key factors in 2024 and 2029

7.6 Threat of rivalry

Threat of rivalry - Impact of key factors in 2024 and 2029

7.7 Market condition

Chart on Market condition - Five forces 2024 and 2029

8. Market Segmentation by Distribution Channel

8.1 Market segments

Chart on Distribution Channel - Market share 2024-2029 (%)
Data Table on Distribution Channel - Market share 2024-2029 (%)

8.2 Comparison by Distribution Channel

Chart on Comparison by Distribution Channel
Data Table on Comparison by Distribution Channel

8.3 Online - Market size and forecast 2024-2029

Chart on Online - Market size and forecast 2024-2029 ($ million)
Data Table on Online - Market size and forecast 2024-2029 ($ million)
Chart on Online - Year-over-year growth 2024-2029 (%)
Data Table on Online - Year-over-year growth 2024-2029 (%)

8.4 Retail - Market size and forecast 2024-2029

Chart on Retail - Market size and forecast 2024-2029 ($ million)
Data Table on Retail - Market size and forecast 2024-2029 ($ million)
Chart on Retail - Year-over-year growth 2024-2029 (%)
Data Table on Retail - Year-over-year growth 2024-2029 (%)

8.5 Kiosk - Market size and forecast 2024-2029

Chart on Kiosk - Market size and forecast 2024-2029 ($ million)
Data Table on Kiosk - Market size and forecast 2024-2029 ($ million)
Chart on Kiosk - Year-over-year growth 2024-2029 (%)
Data Table on Kiosk - Year-over-year growth 2024-2029 (%)

8.6 Market opportunity by Distribution Channel

Market opportunity by Distribution Channel ($ million)
Data Table on Market opportunity by Distribution Channel ($ million)

9. Market Segmentation by Device

9.1 Market segments

Chart on Device - Market share 2024-2029 (%)
Data Table on Device - Market share 2024-2029 (%)

9.2 Comparison by Device

Chart on Comparison by Device
Data Table on Comparison by Device

9.3 Desktop - Market size and forecast 2024-2029

Chart on Desktop - Market size and forecast 2024-2029 ($ million)
Data Table on Desktop - Market size and forecast 2024-2029 ($ million)
Chart on Desktop - Year-over-year growth 2024-2029 (%)
Data Table on Desktop - Year-over-year growth 2024-2029 (%)

9.4 Mobile - Market size and forecast 2024-2029

Chart on Mobile - Market size and forecast 2024-2029 ($ million)
Data Table on Mobile - Market size and forecast 2024-2029 ($ million)
Chart on Mobile - Year-over-year growth 2024-2029 (%)
Data Table on Mobile - Year-over-year growth 2024-2029 (%)

9.5 Market opportunity by Device

Market opportunity by Device ($ million)
Data Table on Market opportunity by Device ($ million)

10. Market Segmentation by Product

10.1 Market segments

Chart on Product - Market share 2024-2029 (%)
Data Table on Product - Market share 2024-2029 (%)

10.2 Comparison by Product

Chart on Comparison by Product
Data Table on Comparison by Product

10.3 Photo only - Market size and forecast 2024-2029

Chart on Photo only - Market size and forecast 2024-2029 ($ million)
Data Table on Photo only - Market size and forecast 2024-2029 ($ million)
Chart on Photo only - Year-over-year growth 2024-2029 (%)
Data Table on Photo only - Year-over-year growth 2024-2029 (%)

10.4 Wall decor - Market size and forecast 2024-2029

Chart on Wall decor - Market size and forecast 2024-2029 ($ million)
Data Table on Wall decor - Market size and forecast 2024-2029 ($ million)
Chart on Wall decor - Year-over-year growth 2024-2029 (%)
Data Table on Wall decor - Year-over-year growth 2024-2029 (%)

10.5 Photo cards - Market size and forecast 2024-2029

Chart on Photo cards - Market size and forecast 2024-2029 ($ million)
Data Table on Photo cards - Market size and forecast 2024-2029 ($ million)
Chart on Photo cards - Year-over-year growth 2024-2029 (%)
Data Table on Photo cards - Year-over-year growth 2024-2029 (%)

10.6 Photo gifts - Market size and forecast 2024-2029

Chart on Photo gifts - Market size and forecast 2024-2029 ($ million)
Data Table on Photo gifts - Market size and forecast 2024-2029 ($ million)
Chart on Photo gifts - Year-over-year growth 2024-2029 (%)
Data Table on Photo gifts - Year-over-year growth 2024-2029 (%)

10.7 Calendars - Market size and forecast 2024-2029

Chart on Calendars - Market size and forecast 2024-2029 ($ million)
Data Table on Calendars - Market size and forecast 2024-2029 ($ million)
Chart on Calendars - Year-over-year growth 2024-2029 (%)
Data Table on Calendars - Year-over-year growth 2024-2029 (%)

10.8 Market opportunity by Product

Market opportunity by Product ($ million)
Data Table on Market opportunity by Product ($ million)

11. Customer Landscape

11.1 Customer landscape overview

Analysis of price sensitivity, lifecycle, customer purchase basket, adoption rates, and purchase criteria

12. Geographic Landscape

12.1 Geographic segmentation

Chart on Market share by geography 2024-2029 (%)
Data Table on Market share by geography 2024-2029 (%)

12.2 Geographic comparison

Chart on Geographic comparison
Data Table on Geographic comparison

12.3 North America - Market size and forecast 2024-2029

Chart on North America - Market size and forecast 2024-2029 ($ million)
Data Table on North America - Market size and forecast 2024-2029 ($ million)
Chart on North America - Year-over-year growth 2024-2029 (%)
Data Table on North America - Year-over-year growth 2024-2029 (%)
Chart on Regional Comparison - North America
Data Table on Regional Comparison - North America

12.3.1 US - Market size and forecast 2024-2029

Chart on US - Market size and forecast 2024-2029 ($ million)
Data Table on US - Market size and forecast 2024-2029 ($ million)
Chart on US - Year-over-year growth 2024-2029 (%)
Data Table on US - Year-over-year growth 2024-2029 (%)

12.3.2 Canada - Market size and forecast 2024-2029

Chart on Canada - Market size and forecast 2024-2029 ($ million)
Data Table on Canada - Market size and forecast 2024-2029 ($ million)
Chart on Canada - Year-over-year growth 2024-2029 (%)
Data Table on Canada - Year-over-year growth 2024-2029 (%)

12.3.3 Mexico - Market size and forecast 2024-2029

Chart on Mexico - Market size and forecast 2024-2029 ($ million)
Data Table on Mexico - Market size and forecast 2024-2029 ($ million)
Chart on Mexico - Year-over-year growth 2024-2029 (%)
Data Table on Mexico - Year-over-year growth 2024-2029 (%)

12.4 Europe - Market size and forecast 2024-2029

Chart on Europe - Market size and forecast 2024-2029 ($ million)
Data Table on Europe - Market size and forecast 2024-2029 ($ million)
Chart on Europe - Year-over-year growth 2024-2029 (%)
Data Table on Europe - Year-over-year growth 2024-2029 (%)
Chart on Regional Comparison - Europe
Data Table on Regional Comparison - Europe

12.4.1 Germany - Market size and forecast 2024-2029

Chart on Germany - Market size and forecast 2024-2029 ($ million)
Data Table on Germany - Market size and forecast 2024-2029 ($ million)
Chart on Germany - Year-over-year growth 2024-2029 (%)
Data Table on Germany - Year-over-year growth 2024-2029 (%)

12.4.2 UK - Market size and forecast 2024-2029

Chart on UK - Market size and forecast 2024-2029 ($ million)
Data Table on UK - Market size and forecast 2024-2029 ($ million)
Chart on UK - Year-over-year growth 2024-2029 (%)
Data Table on UK - Year-over-year growth 2024-2029 (%)

12.4.3 France - Market size and forecast 2024-2029

Chart on France - Market size and forecast 2024-2029 ($ million)
Data Table on France - Market size and forecast 2024-2029 ($ million)
Chart on France - Year-over-year growth 2024-2029 (%)
Data Table on France - Year-over-year growth 2024-2029 (%)

12.4.4 Italy - Market size and forecast 2024-2029

Chart on Italy - Market size and forecast 2024-2029 ($ million)
Data Table on Italy - Market size and forecast 2024-2029 ($ million)
Chart on Italy - Year-over-year growth 2024-2029 (%)
Data Table on Italy - Year-over-year growth 2024-2029 (%)

12.4.5 Spain - Market size and forecast 2024-2029

Chart on Spain - Market size and forecast 2024-2029 ($ million)
Data Table on Spain - Market size and forecast 2024-2029 ($ million)
Chart on Spain - Year-over-year growth 2024-2029 (%)
Data Table on Spain - Year-over-year growth 2024-2029 (%)

12.4.6 The Netherlands - Market size and forecast 2024-2029

Chart on The Netherlands - Market size and forecast 2024-2029 ($ million)
Data Table on The Netherlands - Market size and forecast 2024-2029 ($ million)
Chart on The Netherlands - Year-over-year growth 2024-2029 (%)
Data Table on The Netherlands - Year-over-year growth 2024-2029 (%)

12.5 APAC - Market size and forecast 2024-2029

Chart on APAC - Market size and forecast 2024-2029 ($ million)
Data Table on APAC - Market size and forecast 2024-2029 ($ million)
Chart on APAC - Year-over-year growth 2024-2029 (%)
Data Table on APAC - Year-over-year growth 2024-2029 (%)
Chart on Regional Comparison - APAC
Data Table on Regional Comparison - APAC

12.5.1 China - Market size and forecast 2024-2029

Chart on China - Market size and forecast 2024-2029 ($ million)
Data Table on China - Market size and forecast 2024-2029 ($ million)
Chart on China - Year-over-year growth 2024-2029 (%)
Data Table on China - Year-over-year growth 2024-2029 (%)

12.5.2 Japan - Market size and forecast 2024-2029

Chart on Japan - Market size and forecast 2024-2029 ($ million)
Data Table on Japan - Market size and forecast 2024-2029 ($ million)
Chart on Japan - Year-over-year growth 2024-2029 (%)
Data Table on Japan - Year-over-year growth 2024-2029 (%)

12.5.3 India - Market size and forecast 2024-2029

Chart on India - Market size and forecast 2024-2029 ($ million)
Data Table on India - Market size and forecast 2024-2029 ($ million)
Chart on India - Year-over-year growth 2024-2029 (%)
Data Table on India - Year-over-year growth 2024-2029 (%)

12.5.4 South Korea - Market size and forecast 2024-2029

Chart on South Korea - Market size and forecast 2024-2029 ($ million)
Data Table on South Korea - Market size and forecast 2024-2029 ($ million)
Chart on South Korea - Year-over-year growth 2024-2029 (%)
Data Table on South Korea - Year-over-year growth 2024-2029 (%)

12.5.5 Australia - Market size and forecast 2024-2029

Chart on Australia - Market size and forecast 2024-2029 ($ million)
Data Table on Australia - Market size and forecast 2024-2029 ($ million)
Chart on Australia - Year-over-year growth 2024-2029 (%)
Data Table on Australia - Year-over-year growth 2024-2029 (%)

12.5.6 Indonesia - Market size and forecast 2024-2029

Chart on Indonesia - Market size and forecast 2024-2029 ($ million)
Data Table on Indonesia - Market size and forecast 2024-2029 ($ million)
Chart on Indonesia - Year-over-year growth 2024-2029 (%)
Data Table on Indonesia - Year-over-year growth 2024-2029 (%)

12.6 South America - Market size and forecast 2024-2029

Chart on South America - Market size and forecast 2024-2029 ($ million)
Data Table on South America - Market size and forecast 2024-2029 ($ million)
Chart on South America - Year-over-year growth 2024-2029 (%)
Data Table on South America - Year-over-year growth 2024-2029 (%)
Chart on Regional Comparison - South America
Data Table on Regional Comparison - South America

12.6.1 Brazil - Market size and forecast 2024-2029

Chart on Brazil - Market size and forecast 2024-2029 ($ million)
Data Table on Brazil - Market size and forecast 2024-2029 ($ million)
Chart on Brazil - Year-over-year growth 2024-2029 (%)
Data Table on Brazil - Year-over-year growth 2024-2029 (%)

12.6.2 Argentina - Market size and forecast 2024-2029

Chart on Argentina - Market size and forecast 2024-2029 ($ million)
Data Table on Argentina - Market size and forecast 2024-2029 ($ million)
Chart on Argentina - Year-over-year growth 2024-2029 (%)
Data Table on Argentina - Year-over-year growth 2024-2029 (%)

12.6.3 Colombia - Market size and forecast 2024-2029

Chart on Colombia - Market size and forecast 2024-2029 ($ million)
Data Table on Colombia - Market size and forecast 2024-2029 ($ million)
Chart on Colombia - Year-over-year growth 2024-2029 (%)
Data Table on Colombia - Year-over-year growth 2024-2029 (%)

12.7 Middle East and Africa - Market size and forecast 2024-2029

Chart on Middle East and Africa - Market size and forecast 2024-2029 ($ million)
Data Table on Middle East and Africa - Market size and forecast 2024-2029 ($ million)
Chart on Middle East and Africa - Year-over-year growth 2024-2029 (%)
Data Table on Middle East and Africa - Year-over-year growth 2024-2029 (%)
Chart on Regional Comparison - Middle East and Africa
Data Table on Regional Comparison - Middle East and Africa

12.7.1 UAE - Market size and forecast 2024-2029

Chart on UAE - Market size and forecast 2024-2029 ($ million)
Data Table on UAE - Market size and forecast 2024-2029 ($ million)
Chart on UAE - Year-over-year growth 2024-2029 (%)
Data Table on UAE - Year-over-year growth 2024-2029 (%)

12.7.2 Saudi Arabia - Market size and forecast 2024-2029

Chart on Saudi Arabia - Market size and forecast 2024-2029 ($ million)
Data Table on Saudi Arabia - Market size and forecast 2024-2029 ($ million)
Chart on Saudi Arabia - Year-over-year growth 2024-2029 (%)
Data Table on Saudi Arabia - Year-over-year growth 2024-2029 (%)

12.7.3 South Africa - Market size and forecast 2024-2029

Chart on South Africa - Market size and forecast 2024-2029 ($ million)
Data Table on South Africa - Market size and forecast 2024-2029 ($ million)
Chart on South Africa - Year-over-year growth 2024-2029 (%)
Data Table on South Africa - Year-over-year growth 2024-2029 (%)

12.7.4 Israel - Market size and forecast 2024-2029

Chart on Israel - Market size and forecast 2024-2029 ($ million)
Data Table on Israel - Market size and forecast 2024-2029 ($ million)
Chart on Israel - Year-over-year growth 2024-2029 (%)
Data Table on Israel - Year-over-year growth 2024-2029 (%)

12.7.5 Turkey - Market size and forecast 2024-2029

Chart on Turkey - Market size and forecast 2024-2029 ($ million)
Data Table on Turkey - Market size and forecast 2024-2029 ($ million)
Chart on Turkey - Year-over-year growth 2024-2029 (%)
Data Table on Turkey - Year-over-year growth 2024-2029 (%)

12.8 Market opportunity by geography

Market opportunity by geography ($ million)
Data Tables on Market opportunity by geography ($ million)

13. Drivers, Challenges, and Opportunity

13.1 Market drivers

Rise in gifting culture
Growth of digital photography
Growing popularity of private-label brands

13.2 Market challenges

Negative effects of digitalization
Seasonal demand for personalized photo gifts and merchandise
Navigating complex web of stringent regulations

13.3 Impact of drivers and challenges

Impact of drivers and challenges in 2024 and 2029

13.4 Market opportunities

Growing prominence of print-on-demand services
Innovations in photo printing and merchandise
Automation of photo printing and merchandise

14. Competitive Landscape

14.1 Overview

14.2

Overview on criticality of inputs and factors of differentiation

14.3 Landscape disruption

Overview on factors of disruption

14.4 Industry risks

Impact of key risks on business

15. Competitive Analysis

15.1 Companies profiled

Companies covered

15.2 Company ranking index

15.3 Market positioning of companies

Matrix on companies position and classification

15.4 Amazon.com Inc.

Amazon.com Inc. - Overview
Amazon.com Inc. - Business segments
Amazon.com Inc. - Key news
Amazon.com Inc. - Key offerings
Amazon.com Inc. - Segment focus
SWOT

15.5 American Greetings Corp.

American Greetings Corp. - Overview
American Greetings Corp. - Product / Service
American Greetings Corp. - Key offerings
SWOT

15.6 Card Factory Plc

Card Factory Plc - Overview
Card Factory Plc - Business segments
Card Factory Plc - Key offerings
Card Factory Plc - Segment focus
SWOT

15.7 Cimpress Plc

Cimpress Plc - Overview
Cimpress Plc - Business segments
Cimpress Plc - Key offerings
Cimpress Plc - Segment focus
SWOT

15.8 Circle Graphics Inc.

Circle Graphics Inc. - Overview
Circle Graphics Inc. - Product / Service
Circle Graphics Inc. - Key offerings
SWOT

15.9 District Photo Inc.

District Photo Inc. - Overview
District Photo Inc. - Product / Service
District Photo Inc. - Key offerings
SWOT

15.10 Eastman Kodak Co.

Eastman Kodak Co. - Overview
Eastman Kodak Co. - Business segments
Eastman Kodak Co. - Key news
Eastman Kodak Co. - Key offerings
Eastman Kodak Co. - Segment focus
SWOT

15.11 Minted LLC

Minted LLC - Overview
Minted LLC - Product / Service
Minted LLC - Key offerings
SWOT

15.12 Perion Network Ltd.

Perion Network Ltd. - Overview
Perion Network Ltd. - Product / Service
Perion Network Ltd. - Key offerings
SWOT

15.13 Prodigi Group Ltd.

Prodigi Group Ltd. - Overview
Prodigi Group Ltd. - Product / Service
Prodigi Group Ltd. - Key offerings
SWOT

15.14 Shutterfly Inc.

Shutterfly Inc. - Overview
Shutterfly Inc. - Product / Service
Shutterfly Inc. - Key offerings
SWOT

15.15 Tesco Plc

Tesco Plc - Overview
Tesco Plc - Business segments
Tesco Plc - Key offerings
Tesco Plc - Segment focus
SWOT

15.16 Walgreens Boots Alliance Inc.

Walgreens Boots Alliance Inc. - Overview
Walgreens Boots Alliance Inc. - Business segments
Walgreens Boots Alliance Inc. - Key news
Walgreens Boots Alliance Inc. - Key offerings
Walgreens Boots Alliance Inc. - Segment focus
SWOT

15.17 Walmart Inc.

Walmart Inc. - Overview
Walmart Inc. - Business segments
Walmart Inc. - Key news
Walmart Inc. - Key offerings
Walmart Inc. - Segment focus
SWOT

15.18 Zazzle Inc.

Zazzle Inc. - Overview
Zazzle Inc. - Product / Service
Zazzle Inc. - Key offerings
SWOT

16. Appendix

16.1 Scope of the report

Market definition
Objectives
Notes and caveats

16.2 Inclusions and exclusions checklist

Inclusions checklist
Exclusions checklist

16.3 Currency conversion rates for US$

16.4 Research methodology

16.5 Data procurement

Information sources

16.6 Data validation

16.7 Validation techniques employed for market sizing

16.8 Data synthesis

16.9 360 degree market analysis

16.10 List of abbreviations

Research Methodology

Technavio presents a detailed picture of the market by way of study, synthesis, and summation of data from multiple sources. The analysts have presented the various facets of the market with a particular focus on identifying the key industry influencers. The data thus presented is comprehensive, reliable, and the result of extensive research, both primary and secondary.

INFORMATION SOURCES

Primary sources

  • Manufacturers and suppliers
  • Channel partners
  • Industry experts
  • Strategic decision makers

Secondary sources

  • Industry journals and periodicals
  • Government data
  • Financial reports of key industry players
  • Historical data
  • Press releases

DATA ANALYSIS

Data Synthesis

  • Collation of data
  • Estimation of key figures
  • Analysis of derived insights

Data Validation

  • Triangulation with data models
  • Reference against proprietary databases
  • Corroboration with industry experts

REPORT WRITING

Qualitative

  • Market drivers
  • Market challenges
  • Market trends
  • Five forces analysis

Quantitative

  • Market size and forecast
  • Market segmentation
  • Geographical insights
  • Competitive landscape

Interested in this report?

Get your sample now to see our research methodology and insights!

Download Now

Frequently Asked Questions

Photo Printing And Merchandise market growth will increase by USD 7387.4 million during 2025-2029.

The Photo Printing And Merchandise market is expected to grow at a CAGR of 5.4% during 2025-2029.

Photo Printing And Merchandise market is segmented by Distribution channel (Online, Retail, Kiosk) Device (Desktop, Mobile) Product (Photo only, Wall decor, Photo cards, Photo gifts, Calendars)

Amazon.com Inc., American Greetings Corp., Card Factory Plc, Cimpress Plc, Circle Graphics Inc., District Photo Inc., Eastman Kodak Co., ezprints Inc., Ifolor AG, Minted LLC, Nations Photo Lab, Perion Network Ltd., Prodigi Group Ltd., Shutterfly Inc., Tesco Plc, Walgreens Boots Alliance Inc., Walmart Inc., Zazzle Inc. are a few of the key vendors in the Photo Printing And Merchandise market.

North America will register the highest growth rate of 40.9% among the other regions. Therefore, the Photo Printing And Merchandise market in North America is expected to garner significant business opportunities for the vendors during the forecast period.

US, Canada, Mexico, Germany, UK, France, Italy, Spain, The Netherlands, China, Japan, India, South Korea, Australia, Indonesia, Brazil, Argentina, Colombia, UAE, Saudi Arabia, South Africa, Israel, Turkey

  • Rise in gifting culture is the driving factor this market.

The Photo Printing And Merchandise market vendors should focus on grabbing business opportunities from the Distribution channel segment as it accounted for the largest market share in the base year.