Personal Protective Equipment Market Analysis, Size, and Forecast 2025-2029: North America (US and Canada), Europe (France, Germany, and UK), APAC (Australia, China, India, Japan, and South Korea), and Rest of World (ROW)

Personal Protective Equipment Market Analysis, Size, and Forecast 2025-2029:
North America (US and Canada), Europe (France, Germany, and UK), APAC (Australia, China, India, Japan, and South Korea), and Rest of World (ROW)

Published: Jun 2025 236 Pages SKU: IRTNTR43304

Market Overview at a Glance

$41.43 B
Market Opportunity
8.9%
CAGR
8.0
YoY growth 2024-2025(%)

Personal Protective Equipment Market Size 2025-2029

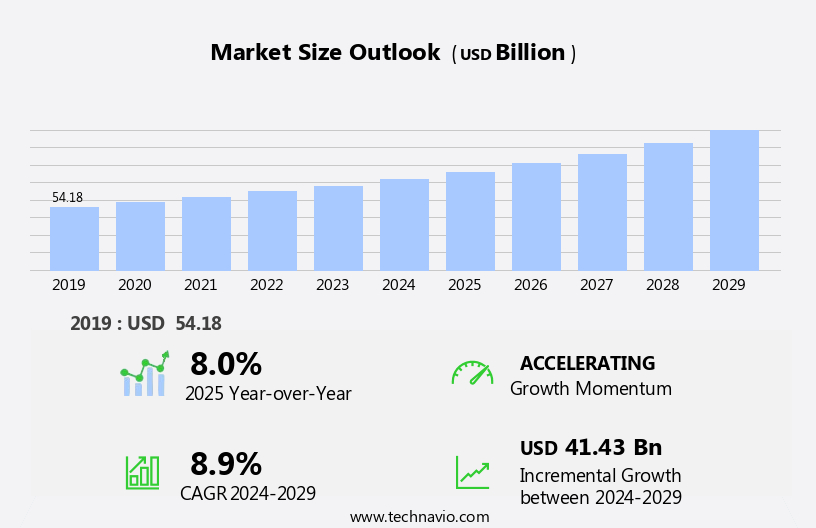
The personal protective equipment market size is forecast to increase by USD 41.43 billion at a CAGR of 8.9% between 2024 and 2029.

  • The Personal Protective Equipment (PPE) market is driven by the significant risks of physical injuries in labor-intensive industries, making safety a top priority for employers and workers alike. This demand is further fueled by the expanding distribution channels, with PPE increasingly available through retail and online platforms, making it more accessible to a wider audience. However, the market faces challenges, including low employee compliance with safety regulations, which can lead to potential risks and negate the benefits of using PPE. Aesthetics, disposable respiratory protection, and advanced technology are key areas of focus, with innovations in smart sensors and technological advancements leading to more effective protective solutions.
  • Companies seeking to capitalize on market opportunities should focus on innovative solutions that address these challenges and prioritize employee education and engagement. By staying informed of industry trends and addressing the unique needs of various industries, businesses can effectively navigate the evolving PPE market landscape. Addressing these challenges through effective communication, training, and incentives can help ensure the proper use of PPE and ultimately contribute to a safer working environment. Fall protection systems, including full body harnesses, shock absorbers, and safety belts, are essential for industries with hazardous working conditions.

What will be the Size of the Personal Protective Equipment Market during the forecast period?

Personal Protective Equipment Market Size

 Explore in-depth regional segment analysis with market size data - historical 2019-2023 and forecasts 2025-2029 - in the full report.  
Request Free Sample

The protective gear market encompasses a wide range of safety supplies, including anti-microbial treatments, arc flash protection, ballistic protection, flame retardant fabrics, impact-absorbing materials, and radiation protection. These products cater to various industries, with a significant focus on industrial safety supplies. The market is witnessing notable trends, such as the integration of e-commerce platforms for B2B sales and the adoption of sustainable materials like moisture wicking fabrics and high-visibility apparel. Online retail channels are increasingly popular, offering supply chain traceability and product lifecycle management.

Lightweight materials, water repellent fabrics, and protective footwear are also in demand. Safety clothing, including protective suits, is essential for industries with hazardous conditions, ensuring arc flash protection and radiation shielding. High-tensile materials and sustainable materials are key considerations for safety equipment manufacturers to meet evolving industry requirements. Smart personal protective equipment (PPE) market continues to evolve, driven by advancements in technology and materials that enhance safety and performance.

How is this Personal Protective Equipment Industry segmented?

The personal protective equipment industry research report provides comprehensive data (region-wise segment analysis), with forecasts and estimates in "USD billion" for the period 2025-2029, as well as historical data from 2019-2023 for the following segments.

  • End-user
    • Manufacturing
    • Construction
    • Oil and gas
    • Healthcare
    • Others
  • Product
    • Protective clothing
    • Hand and arm protection
    • Protective footwear
    • Respiratory protection
    • Others
  • Distribution Channel
    • Offline
    • Online
  • Geography
    • North America
      • US
      • Canada
    • Europe
      • France
      • Germany
      • UK
    • APAC
      • Australia
      • China
      • India
      • Japan
      • South Korea
    • Rest of World (ROW)

By End-user Insights

The Manufacturing segment is estimated to witness significant growth during the forecast period. Personal protective equipment (PPE) plays a crucial role in various industries, ensuring the safety and well-being of workers. The manufacturing sector is a significant end-user of PPE, contributing substantially to its global demand. With the manufacturing industry being the second-largest contributor to the world's GDP after services, it is essential to maintain a robust PPE market. In the US and China, the manufacturing sectors lead in output, but their contributions to their respective economies differ. In the US, manufacturing fosters innovation, productivity, trade, and consumer services. In contrast, China's manufacturing sector primarily drives economic growth and employment. PPE encompasses a wide range of products, including dust masks, chemical-resistant gloves, safety footwear, fall arrest systems, protective coveralls, and more.

OSHA compliance, ANSI and ISO standards, and certification standards ensure the quality and safety of these products. Industrial safety, construction safety, healthcare safety, and mining safety are primary sectors that rely heavily on PPE. Material science plays a vital role in the development of advanced protective solutions, such as flame-resistant clothing, insulated clothing, and impact-resistant protective garments. Manufacturing safety, emergency response, and ergonomic design are essential considerations in the production and use of PPE. Retail channels and distribution networks facilitate the availability of PPE to various industries, ensuring a continuous supply chain. PPE rental services offer cost-effective solutions for businesses, while PPE maintenance and durability testing ensure the longevity of equipment.

Safety training and regulatory compliance are ongoing priorities to ensure the effective use of PPE. PPE products include safety helmets, safety glasses, ear plugs, hearing protection, face shields, gas masks, and protective coatings. These products cater to various industries and applications, such as construction, mining, healthcare, and manufacturing. Protective apparel, including high-visibility clothing, protective coveralls, and flame-resistant clothing, is a significant segment of the PPE market. Protective footwear, including safety boots and heat-resistant gloves, provide essential protection against various workplace hazards.

The market is a vital component of various industries, ensuring the safety and well-being of workers. The manufacturing sector, being the second-largest contributor to the global GDP, plays a significant role in driving the demand for PPE. Advanced material science, regulatory compliance, and continuous innovation are essential factors shaping the evolution of the PPE market.

Personal Protective Equipment Market Size

 Download Free Sample Report

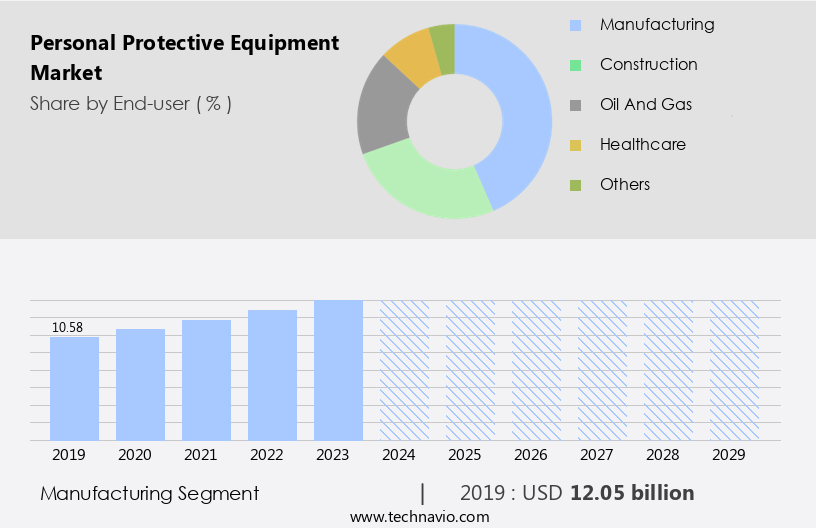
The Manufacturing segment was valued at USD 12.05 billion in 2019 and showed a gradual increase during the forecast period.

The Personal Protective Equipment (PPE) Market is witnessing strong growth as industries prioritize worker safety and compliance. The rising demand for high-quality safety apparel is driven by stricter regulatory frameworks and increased awareness of occupational hazards. In Australia, adherence to Australian Standards (AS) is critical, ensuring PPE products meet rigorous performance and safety criteria. Companies are streamlining distribution through direct sales, offering tailored solutions and faster delivery to meet industry-specific needs.

Regional Analysis

APAC is estimated to contribute 36% to the growth of the global market during the forecast period.Technavio's analysts have elaborately explained the regional trends and drivers that shape the market during the forecast period.

Personal Protective Equipment Market Share by Geography

View Free PDF Sample

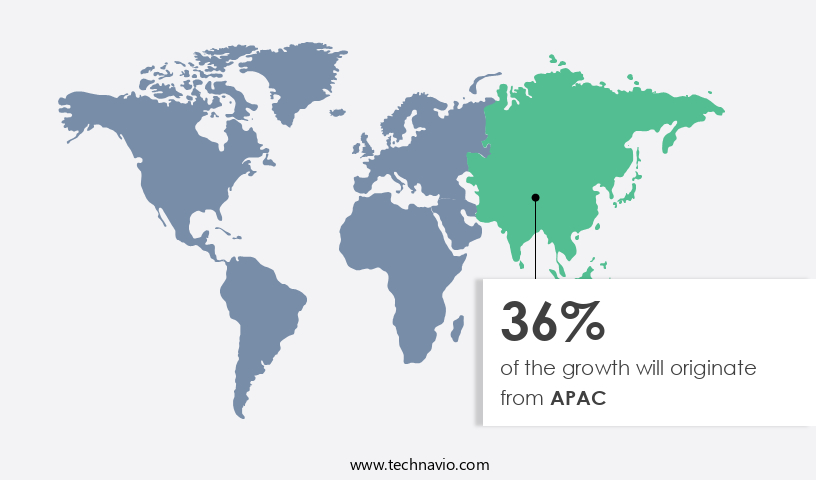
The Personal Protective Equipment (PPE) market in the Asia-Pacific (APAC) region is experiencing significant growth due to the rapid industrialization and urbanization driving expansion in the construction, automotive, and manufacturing industries. Key countries, including China, India, Japan, and Australia, are leading this growth, with improving economic conditions and increased investments in various sectors. By 2050, APAC is projected to house over 54% of the global population, and the increase in urban settlements in APAC countries contributes significantly to this demographic shift. As a result, public and private sector enterprises are expected to invest heavily in construction and manufacturing projects, capitalizing on the inexpensive labor force.

Industrial safety is a top priority, leading to increased demand for PPE such as dust masks, chemical-resistant gloves, safety footwear, and protective coveralls. OSHA compliance and ANSI standards ensure the production of high-quality, certified PPE. Distribution networks are expanding to meet the growing demand, with retail channels and PPE rental services becoming increasingly popular. Manufacturing safety is a crucial concern, with the need for protective apparel, coatings, and head protection. Material science plays a significant role in the development of advanced PPE, such as flame-resistant clothing, insulated clothing, and impact-resistant safety helmets. Ergonomic design and cut-resistant gloves are essential for maintaining worker comfort and productivity. Pharmaceuticals and healthcare facilities are investing in PPE to maintain employee safety and ensure regulatory compliance.

Safety training and regulatory compliance are essential components of PPE usage. Fall protection systems, including full body harnesses, shock absorbers, and safety belts, are vital for preventing workplace accidents. Emergency response teams rely on PPE such as gas masks, face shields, and protective garments to ensure their safety during hazardous situations. The PPE market in the APAC region is witnessing substantial growth due to the increasing industrialization and urbanization. The demand for PPE is driven by the construction, automotive, and manufacturing industries, with a focus on worker safety, comfort, and productivity. The market's evolution is shaped by factors such as OSHA and ANSI compliance, distribution networks, and advanced material science.

Market Dynamics

Our researchers analyzed the data with 2024 as the base year, along with the key drivers, trends, and challenges. A holistic analysis of drivers will help companies refine their marketing strategies to gain a competitive advantage.

What are the Personal Protective Equipment market drivers leading to the rise in the adoption of Industry?

  • In labor-intensive industries, the significant risk of physical injuries serves as the primary market driver. The Personal Protective Equipment (PPE) market is essential for industries that pose potential risks to workers, including automotive, construction, manufacturing, chemicals, and food processing. These industries are labor-intensive and can result in various injuries, such as impact-related injuries and hand injuries. Impact-related injuries may include abrasion cuts, slicing cuts, and impact cuts, which can lead to significant costs for emergency room visits, lost man-days, and compensation claims. For instance, hand injuries, which can range from lacerations to amputation, may cost between USD2,000 to USD10,000 in the US and require at least 6-10 days off from work. To mitigate these risks, various PPE solutions are available, such as safety helmets, ear plugs, foot protection, safety boots, fall protection, shock absorbers, heat-resistant gloves, and body protection in the form of protective garments.
  • These PPE solutions adhere to specific certification standards, including ANSI and ISO, to ensure thermal resistance, chemical resistance, and other essential safety features. Hearing protection, for example, may include earplugs, while safety helmets provide head protection against impact and penetration. Similarly, foot protection, such as safety boots, offers protection against electrical hazards, compression, and penetration. In summary, the PPE market plays a crucial role in ensuring worker safety and reducing potential costs associated with work-related injuries. By utilizing PPE solutions that meet ANSI and ISO certification standards, industries can protect their workforce from various hazards and maintain a safe and productive work environment.

What are the Personal Protective Equipment market trends shaping the Industry?

  • The trend in the market is shifting towards expanding distribution through both retail and online channels. This approach is essential for reaching a larger customer base and staying competitive in today's business landscape. Personal protective equipment (PPE) market is witnessing significant growth due to the increasing prioritization of manufacturing safety and emergency response needs. Companies are expanding their distribution channels, selling equipment directly and through online and retail platforms. This approach enables better access to consumers and reduces distribution, setup, and operational costs.
  • Effective supply chain management and quality control are crucial in ensuring the production of PPE adheres to EN standards for abrasion resistance, flame resistance, water resistance, and other essential features. E-commerce platforms like Amazon, IndiaMART, MedicalExpo, and Alibaba are major sales channels for various PPE types, including face shields, insulated clothing, head protection, and flame-resistant clothing. For instance, 3M sells respiratory masks on IndiaMART and Amazon, while Salus Products' masks are available on Amazon. Discounts and offers on online purchases of PPE, such as respiratory masks, are also driving demand.

How does Personal Protective Equipment market faces challenges during its growth?

  • Low employee compliance poses a significant challenge to the industry's growth by hindering productivity and potentially leading to regulatory non-compliance. As a professional and knowledgeable virtual assistant, I understand the importance of maintaining a workforce that adheres to industry standards and company policies. To mitigate this issue, implementing effective training programs, clear communication, and consistent enforcement of rules can help improve employee compliance and ultimately contribute to the industry's growth. Personal Protective Equipment (PPE) market encompasses various types of equipment designed to ensure worker safety, including eye protection, reflective materials, gas masks, cut-resistant gloves, and ergonomic designs. In the eye protection segment, ensuring comfort and fit is crucial for increasing wearer compliance, as style preferences also play a role.
  • Ergonomic designs, which prioritize worker comfort, are gaining popularity to address the issue of low wearer compliance. PPE maintenance is essential for ensuring the durability and effectiveness of equipment, and regular safety training is vital for proper usage. Regulatory compliance is a constant concern for companies, and durability testing is crucial to meet the required standards. Hand protection, including welding helmets and safety glasses, is a vital component of PPE, and rental options are available for businesses with fluctuating needs. Overall, the PPE market requires a balance between safety, comfort, and cost-effectiveness to meet the diverse needs of various industries. Compliance remains a significant challenge due to these factors, particularly in developed regions with stringent safety regulations, where non-compliance can result in financial losses and legal complications for employers. Conversely, in emerging markets, the low adoption of PPE is a challenge due to the lack of enforcement of safety regulations.

Exclusive Customer Landscape

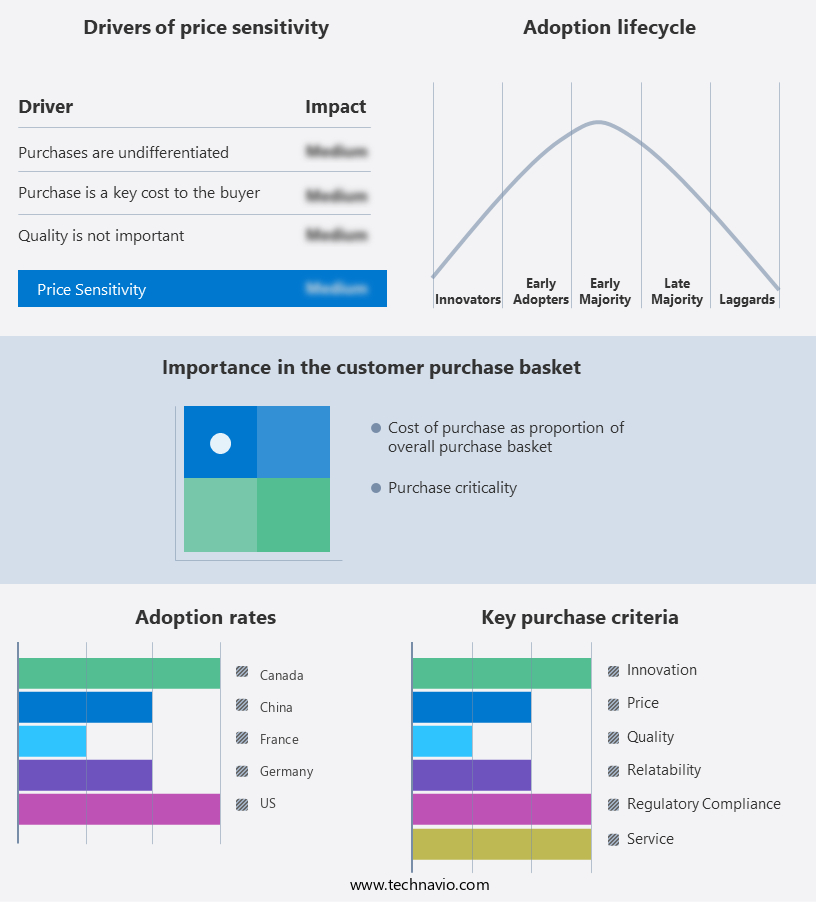
The personal protective equipment market forecasting report includes the adoption lifecycle of the market, covering from the innovator's stage to the laggard's stage. It focuses on adoption rates in different regions based on penetration. Furthermore, the personal protective equipment market report also includes key purchase criteria and drivers of price sensitivity to help companies evaluate and develop their market growth analysis strategies.

Personal Protective Equipment Market Share by Geography

 Customer Landscape

Key Companies & Market Insights

Companies are implementing various strategies, such as strategic alliances, personal protective equipment market forecast, partnerships, mergers and acquisitions, geographical expansion, and product/service launches, to enhance their presence in the industry.

3M Co. - This company specializes in providing a range of personal protective equipment.

The industry research and growth report includes detailed analyses of the competitive landscape of the market and information about key companies, including:

  • 3M Co.
  • Alpha Pro Tech Ltd.
  • Ansell Ltd.
  • Bunzl Plc
  • Delta Plus Group
  • Dragerwerk AG and Co. KGaA
  • DuPont de Nemours Inc.
  • Honeywell International Inc.
  • Kimberly Clark Corp.
  • Lakeland Industries Inc.
  • Magid Glove and Safety Manufacturing Co. LLC
  • Mallcom India Ltd.
  • Midas Safety Inc.
  • Moldex Metric
  • MSA Safety Inc.
  • Radians Inc.
  • Rock Fall UK Ltd.
  • Saf T Gard International Inc.
  • UVEX WINTER HOLDING GmbH and Co. KG
  • WW Grainger Inc.

Qualitative and quantitative analysis of companies has been conducted to help clients understand the wider business environment as well as the strengths and weaknesses of key industry players. Data is qualitatively analyzed to categorize companies as pure play, category-focused, industry-focused, and diversified; it is quantitatively analyzed to categorize companies as dominant, leading, strong, tentative, and weak.

Recent Development and News in Personal Protective Equipment Market

  • In January 2024, 3M Company, a leading manufacturer of Personal Protective Equipment (PPE), announced the launch of its new line of N95 respirators with a fitted design, aiming to enhance user comfort and efficiency (3M Press Release, 2024).
  • In March 2024, Honeywell International and DuPont announced a strategic partnership to co-develop and commercialize advanced PPE technologies, combining Honeywell's expertise in technology and DuPont's knowledge in materials science (Honeywell Press Release, 2024).
  • In April 2025, MSA Safety, a global PPE provider, completed the acquisition of Airgo Solutions, a leading manufacturer of powered air-purifying respirators, expanding its product portfolio and strengthening its position in the respiratory protection segment (MSA Safety Press Release, 2025).
  • In May 2025, the European Union approved the new PPE Regulation (EU) 2025/1155, which sets higher standards for PPE design, testing, and labeling, ensuring better protection and safety for end-users (European Commission Press Release, 2025).

Research Analyst Overview

The personal protective equipment (PPE) market is characterized by its continuous evolution and dynamic nature, with applications spanning various sectors. Industrial safety remains a significant driver, with the demand for dust masks, chemical-resistant gloves, safety footwear, and OSHA compliance dominating the landscape. Retail channels also play a crucial role in distributing PPE, offering a diverse range of products such as high-visibility clothing, protective coveralls, and safety helmets. Manufacturing safety is another critical area, with a focus on protective apparel, coatings, and equipment. Material science advances have led to the development of innovative PPE, including impact-resistant and flame-resistant materials, insulated clothing, and ergonomic designs.

Mining safety, first aid, and safety training are essential components of the market, with regulatory compliance and PPE maintenance ensuring the effectiveness of these solutions. The construction industry relies heavily on fall arrest systems, shock absorbers, and safety belts, while healthcare safety prioritizes hearing protection, ear plugs, and face shields. Distribution networks and supply chain management are vital for ensuring the availability of PPE, with ANSI and ISO certification standards and regulatory bodies enforcing quality control. Market activities are shaped by evolving patterns, with ongoing developments in protective coatings, thermal resistance, water resistance, and certification standards. The integration of technology, such as gas masks, welding helmets, and safety glasses, further enhances the functionality and effectiveness of PPE.

The PPE market continues to unfold, reflecting the ongoing commitment to safeguarding workers and ensuring regulatory compliance across diverse industries. The Internet of Things (IoT) revolutionizes healthcare facility design, enabling remote monitoring and hazard assessment.

Dive into Technavio's robust research methodology, blending expert interviews, extensive data synthesis, and validated models for unparalleled Personal Protective Equipment Market insights. See full methodology.

Market Scope

Report Coverage

Details

Page number

236

Base year

2024

Historic period

2019-2023

Forecast period

2025-2029

Growth momentum & CAGR

Accelerate at a CAGR of 8.9%

Market growth 2025-2029

USD 41.43 billion

Market structure

Fragmented

YoY growth 2024-2025(%)

8.0

Key countries

US, China, Germany, India, Canada, UK, Japan, France, South Korea, and Australia

Competitive landscape

Leading Companies, Market Positioning of Companies, Competitive Strategies, and Industry Risks

Request Free Sample

What are the Key Data Covered in this Personal Protective Equipment Market Research and Growth Report?

  • CAGR of the Personal Protective Equipment industry during the forecast period
  • Detailed information on factors that will drive the growth and forecasting between 2025 and 2029
  • Precise estimation of the size of the market and its contribution of the industry in focus to the parent market
  • Accurate predictions about upcoming growth and trends and changes in consumer behaviour
  • Growth of the market across APAC, North America, Europe, Middle East and Africa, and South America
  • Thorough analysis of the market's competitive landscape and detailed information about companies
  • Comprehensive analysis of factors that will challenge the personal protective equipment market growth of industry companies

We can help! Our analysts can customize this personal protective equipment market research report to meet your requirements.

Get in touch

1 Executive Summary

  • 1.1 Market overview
    • Executive Summary - Chart on Market Overview
    • Executive Summary - Data Table on Market Overview
    • Executive Summary - Chart on Global Market Characteristics
    • Executive Summary - Chart on Market by Geography
    • Executive Summary - Chart on Market Segmentation by End-user
    • Executive Summary - Chart on Market Segmentation by Product
    • Executive Summary - Chart on Market Segmentation by Distribution Channel
    • Executive Summary - Chart on Incremental Growth
    • Executive Summary - Data Table on Incremental Growth
    • Executive Summary - Chart on Company Market Positioning

2 Technavio Analysis

  • 2.1 Analysis of price sensitivity, lifecycle, customer purchase basket, adoption rates, and purchase criteria
    • Analysis of price sensitivity, lifecycle, customer purchase basket, adoption rates, and purchase criteria
  • 2.2 Criticality of inputs and Factors of differentiation
    • Overview on criticality of inputs and factors of differentiation
  • 2.3 Factors of disruption
    • Overview on factors of disruption
  • 2.4 Impact of drivers and challenges
    • Impact of drivers and challenges in 2024 and 2029

3 Market Landscape

  • 3.1 Market ecosystem
    • Parent Market
    • Data Table on - Parent Market
  • 3.2 Market characteristics
    • Market characteristics analysis
  • 3.3 Value chain analysis
    • Value chain analysis

4 Market Sizing

  • 4.1 Market definition
    • Offerings of companies included in the market definition
  • 4.2 Market segment analysis
    • Market segments
  • 4.3 Market size 2024
    • 4.4 Market outlook: Forecast for 2024-2029
      • Chart on Global - Market size and forecast 2024-2029 ($ million)
      • Data Table on Global - Market size and forecast 2024-2029 ($ million)
      • Chart on Global Market: Year-over-year growth 2024-2029 (%)
      • Data Table on Global Market: Year-over-year growth 2024-2029 (%)

    5 Historic Market Size

    • 5.1 Global Personal Protective Equipment Market 2019 - 2023
      • Historic Market Size - Data Table on Global Personal Protective Equipment Market 2019 - 2023 ($ million)
    • 5.2 End-user segment analysis 2019 - 2023
      • Historic Market Size - End-user Segment 2019 - 2023 ($ million)
    • 5.3 Product segment analysis 2019 - 2023
      • Historic Market Size - Product Segment 2019 - 2023 ($ million)
    • 5.4 Distribution Channel segment analysis 2019 - 2023
      • Historic Market Size - Distribution Channel Segment 2019 - 2023 ($ million)
    • 5.5 Geography segment analysis 2019 - 2023
      • Historic Market Size - Geography Segment 2019 - 2023 ($ million)
    • 5.6 Country segment analysis 2019 - 2023
      • Historic Market Size - Country Segment 2019 - 2023 ($ million)

    6 Qualitative Analysis

    • 6.1 Impact of AI in global personal protective equipment market

      7 Five Forces Analysis

      • 7.1 Five forces summary
        • Five forces analysis - Comparison between 2024 and 2029
      • 7.2 Bargaining power of buyers
        • Bargaining power of buyers - Impact of key factors 2024 and 2029
      • 7.3 Bargaining power of suppliers
        • Bargaining power of suppliers - Impact of key factors in 2024 and 2029
      • 7.4 Threat of new entrants
        • Threat of new entrants - Impact of key factors in 2024 and 2029
      • 7.5 Threat of substitutes
        • Threat of substitutes - Impact of key factors in 2024 and 2029
      • 7.6 Threat of rivalry
        • Threat of rivalry - Impact of key factors in 2024 and 2029
      • 7.7 Market condition
        • Chart on Market condition - Five forces 2024 and 2029

      8 Market Segmentation by End-user

      • 8.1 Market segments
        • Chart on End-user - Market share 2024-2029 (%)
        • Data Table on End-user - Market share 2024-2029 (%)
      • 8.2 Comparison by End-user
        • Chart on Comparison by End-user
        • Data Table on Comparison by End-user
      • 8.3 Manufacturing - Market size and forecast 2024-2029
        • Chart on Manufacturing - Market size and forecast 2024-2029 ($ million)
        • Data Table on Manufacturing - Market size and forecast 2024-2029 ($ million)
        • Chart on Manufacturing - Year-over-year growth 2024-2029 (%)
        • Data Table on Manufacturing - Year-over-year growth 2024-2029 (%)
      • 8.4 Construction - Market size and forecast 2024-2029
        • Chart on Construction - Market size and forecast 2024-2029 ($ million)
        • Data Table on Construction - Market size and forecast 2024-2029 ($ million)
        • Chart on Construction - Year-over-year growth 2024-2029 (%)
        • Data Table on Construction - Year-over-year growth 2024-2029 (%)
      • 8.5 Oil and gas - Market size and forecast 2024-2029
        • Chart on Oil and gas - Market size and forecast 2024-2029 ($ million)
        • Data Table on Oil and gas - Market size and forecast 2024-2029 ($ million)
        • Chart on Oil and gas - Year-over-year growth 2024-2029 (%)
        • Data Table on Oil and gas - Year-over-year growth 2024-2029 (%)
      • 8.6 Healthcare - Market size and forecast 2024-2029
        • Chart on Healthcare - Market size and forecast 2024-2029 ($ million)
        • Data Table on Healthcare - Market size and forecast 2024-2029 ($ million)
        • Chart on Healthcare - Year-over-year growth 2024-2029 (%)
        • Data Table on Healthcare - Year-over-year growth 2024-2029 (%)
      • 8.7 Others - Market size and forecast 2024-2029
        • Chart on Others - Market size and forecast 2024-2029 ($ million)
        • Data Table on Others - Market size and forecast 2024-2029 ($ million)
        • Chart on Others - Year-over-year growth 2024-2029 (%)
        • Data Table on Others - Year-over-year growth 2024-2029 (%)
      • 8.8 Market opportunity by End-user
        • Market opportunity by End-user ($ million)
        • Data Table on Market opportunity by End-user ($ million)

      9 Market Segmentation by Product

      • 9.1 Market segments
        • Chart on Product - Market share 2024-2029 (%)
        • Data Table on Product - Market share 2024-2029 (%)
      • 9.2 Comparison by Product
        • Chart on Comparison by Product
        • Data Table on Comparison by Product
      • 9.3 Protective clothing - Market size and forecast 2024-2029
        • Chart on Protective clothing - Market size and forecast 2024-2029 ($ million)
        • Data Table on Protective clothing - Market size and forecast 2024-2029 ($ million)
        • Chart on Protective clothing - Year-over-year growth 2024-2029 (%)
        • Data Table on Protective clothing - Year-over-year growth 2024-2029 (%)
      • 9.4 Hand and arm protection - Market size and forecast 2024-2029
        • Chart on Hand and arm protection - Market size and forecast 2024-2029 ($ million)
        • Data Table on Hand and arm protection - Market size and forecast 2024-2029 ($ million)
        • Chart on Hand and arm protection - Year-over-year growth 2024-2029 (%)
        • Data Table on Hand and arm protection - Year-over-year growth 2024-2029 (%)
      • 9.5 Protective footwear - Market size and forecast 2024-2029
        • Chart on Protective footwear - Market size and forecast 2024-2029 ($ million)
        • Data Table on Protective footwear - Market size and forecast 2024-2029 ($ million)
        • Chart on Protective footwear - Year-over-year growth 2024-2029 (%)
        • Data Table on Protective footwear - Year-over-year growth 2024-2029 (%)
      • 9.6 Respiratory protection - Market size and forecast 2024-2029
        • Chart on Respiratory protection - Market size and forecast 2024-2029 ($ million)
        • Data Table on Respiratory protection - Market size and forecast 2024-2029 ($ million)
        • Chart on Respiratory protection - Year-over-year growth 2024-2029 (%)
        • Data Table on Respiratory protection - Year-over-year growth 2024-2029 (%)
      • 9.7 Others - Market size and forecast 2024-2029
        • Chart on Others - Market size and forecast 2024-2029 ($ million)
        • Data Table on Others - Market size and forecast 2024-2029 ($ million)
        • Chart on Others - Year-over-year growth 2024-2029 (%)
        • Data Table on Others - Year-over-year growth 2024-2029 (%)
      • 9.8 Market opportunity by Product
        • Market opportunity by Product ($ million)
        • Data Table on Market opportunity by Product ($ million)

      10 Market Segmentation by Distribution Channel

      • 10.1 Market segments
        • Chart on Distribution Channel - Market share 2024-2029 (%)
        • Data Table on Distribution Channel - Market share 2024-2029 (%)
      • 10.2 Comparison by Distribution Channel
        • Chart on Comparison by Distribution Channel
        • Data Table on Comparison by Distribution Channel
      • 10.3 Offline - Market size and forecast 2024-2029
        • Chart on Offline - Market size and forecast 2024-2029 ($ million)
        • Data Table on Offline - Market size and forecast 2024-2029 ($ million)
        • Chart on Offline - Year-over-year growth 2024-2029 (%)
        • Data Table on Offline - Year-over-year growth 2024-2029 (%)
      • 10.4 Online - Market size and forecast 2024-2029
        • Chart on Online - Market size and forecast 2024-2029 ($ million)
        • Data Table on Online - Market size and forecast 2024-2029 ($ million)
        • Chart on Online - Year-over-year growth 2024-2029 (%)
        • Data Table on Online - Year-over-year growth 2024-2029 (%)
      • 10.5 Market opportunity by Distribution Channel
        • Market opportunity by Distribution Channel ($ million)
        • Data Table on Market opportunity by Distribution Channel ($ million)

      11 Customer Landscape

      • 11.1 Customer landscape overview
        • Analysis of price sensitivity, lifecycle, customer purchase basket, adoption rates, and purchase criteria

      12 Geographic Landscape

      • 12.1 Geographic segmentation
        • Chart on Market share by geography 2024-2029 (%)
        • Data Table on Market share by geography 2024-2029 (%)
      • 12.2 Geographic comparison
        • Chart on Geographic comparison
        • Data Table on Geographic comparison
      • 12.3 APAC - Market size and forecast 2024-2029
        • Chart on APAC - Market size and forecast 2024-2029 ($ million)
        • Data Table on APAC - Market size and forecast 2024-2029 ($ million)
        • Chart on APAC - Year-over-year growth 2024-2029 (%)
        • Data Table on APAC - Year-over-year growth 2024-2029 (%)
      • 12.4 North America - Market size and forecast 2024-2029
        • Chart on North America - Market size and forecast 2024-2029 ($ million)
        • Data Table on North America - Market size and forecast 2024-2029 ($ million)
        • Chart on North America - Year-over-year growth 2024-2029 (%)
        • Data Table on North America - Year-over-year growth 2024-2029 (%)
      • 12.5 Europe - Market size and forecast 2024-2029
        • Chart on Europe - Market size and forecast 2024-2029 ($ million)
        • Data Table on Europe - Market size and forecast 2024-2029 ($ million)
        • Chart on Europe - Year-over-year growth 2024-2029 (%)
        • Data Table on Europe - Year-over-year growth 2024-2029 (%)
      • 12.6 Middle East and Africa - Market size and forecast 2024-2029
        • Chart on Middle East and Africa - Market size and forecast 2024-2029 ($ million)
        • Data Table on Middle East and Africa - Market size and forecast 2024-2029 ($ million)
        • Chart on Middle East and Africa - Year-over-year growth 2024-2029 (%)
        • Data Table on Middle East and Africa - Year-over-year growth 2024-2029 (%)
      • 12.7 South America - Market size and forecast 2024-2029
        • Chart on South America - Market size and forecast 2024-2029 ($ million)
        • Data Table on South America - Market size and forecast 2024-2029 ($ million)
        • Chart on South America - Year-over-year growth 2024-2029 (%)
        • Data Table on South America - Year-over-year growth 2024-2029 (%)
      • 12.8 US - Market size and forecast 2024-2029
        • Chart on US - Market size and forecast 2024-2029 ($ million)
        • Data Table on US - Market size and forecast 2024-2029 ($ million)
        • Chart on US - Year-over-year growth 2024-2029 (%)
        • Data Table on US - Year-over-year growth 2024-2029 (%)
      • 12.9 China - Market size and forecast 2024-2029
        • Chart on China - Market size and forecast 2024-2029 ($ million)
        • Data Table on China - Market size and forecast 2024-2029 ($ million)
        • Chart on China - Year-over-year growth 2024-2029 (%)
        • Data Table on China - Year-over-year growth 2024-2029 (%)
      • 12.10 India - Market size and forecast 2024-2029
        • Chart on India - Market size and forecast 2024-2029 ($ million)
        • Data Table on India - Market size and forecast 2024-2029 ($ million)
        • Chart on India - Year-over-year growth 2024-2029 (%)
        • Data Table on India - Year-over-year growth 2024-2029 (%)
      • 12.11 Germany - Market size and forecast 2024-2029
        • Chart on Germany - Market size and forecast 2024-2029 ($ million)
        • Data Table on Germany - Market size and forecast 2024-2029 ($ million)
        • Chart on Germany - Year-over-year growth 2024-2029 (%)
        • Data Table on Germany - Year-over-year growth 2024-2029 (%)
      • 12.12 Canada - Market size and forecast 2024-2029
        • Chart on Canada - Market size and forecast 2024-2029 ($ million)
        • Data Table on Canada - Market size and forecast 2024-2029 ($ million)
        • Chart on Canada - Year-over-year growth 2024-2029 (%)
        • Data Table on Canada - Year-over-year growth 2024-2029 (%)
      • 12.13 UK - Market size and forecast 2024-2029
        • Chart on UK - Market size and forecast 2024-2029 ($ million)
        • Data Table on UK - Market size and forecast 2024-2029 ($ million)
        • Chart on UK - Year-over-year growth 2024-2029 (%)
        • Data Table on UK - Year-over-year growth 2024-2029 (%)
      • 12.14 Japan - Market size and forecast 2024-2029
        • Chart on Japan - Market size and forecast 2024-2029 ($ million)
        • Data Table on Japan - Market size and forecast 2024-2029 ($ million)
        • Chart on Japan - Year-over-year growth 2024-2029 (%)
        • Data Table on Japan - Year-over-year growth 2024-2029 (%)
      • 12.15 France - Market size and forecast 2024-2029
        • Chart on France - Market size and forecast 2024-2029 ($ million)
        • Data Table on France - Market size and forecast 2024-2029 ($ million)
        • Chart on France - Year-over-year growth 2024-2029 (%)
        • Data Table on France - Year-over-year growth 2024-2029 (%)
      • 12.16 South Korea - Market size and forecast 2024-2029
        • Chart on South Korea - Market size and forecast 2024-2029 ($ million)
        • Data Table on South Korea - Market size and forecast 2024-2029 ($ million)
        • Chart on South Korea - Year-over-year growth 2024-2029 (%)
        • Data Table on South Korea - Year-over-year growth 2024-2029 (%)
      • 12.17 Australia - Market size and forecast 2024-2029
        • Chart on Australia - Market size and forecast 2024-2029 ($ million)
        • Data Table on Australia - Market size and forecast 2024-2029 ($ million)
        • Chart on Australia - Year-over-year growth 2024-2029 (%)
        • Data Table on Australia - Year-over-year growth 2024-2029 (%)
      • 12.18 Market opportunity by geography
        • Market opportunity by geography ($ million)
        • Data Tables on Market opportunity by geography ($ million)

      13 Drivers, Challenges, and Opportunity/Restraints

      • 13.1 Market drivers
        • 13.2 Market challenges
          • 13.3 Impact of drivers and challenges
            • Impact of drivers and challenges in 2024 and 2029
          • 13.4 Market opportunities/restraints

            14 Competitive Landscape

            • 14.1 Overview
              • 14.2 Competitive Landscape
                • Overview on criticality of inputs and factors of differentiation
              • 14.3 Landscape disruption
                • Overview on factors of disruption
              • 14.4 Industry risks
                • Impact of key risks on business

              15 Competitive Analysis

              • 15.1 Companies profiled
                • Companies covered
              • 15.2 Company ranking index
                • Company ranking index
              • 15.3 Market positioning of companies
                • Matrix on companies position and classification
              • 3M Co.
                • 3M Co. - Overview
                • 3M Co. - Business segments
                • 3M Co. - Key news
                • 3M Co. - Key offerings
                • 3M Co. - Segment focus
                • SWOT
              • 15.5 Alpha Pro Tech Ltd.
                • Alpha Pro Tech Ltd. - Overview
                • Alpha Pro Tech Ltd. - Business segments
                • Alpha Pro Tech Ltd. - Key offerings
                • Alpha Pro Tech Ltd. - Segment focus
                • SWOT
              • 15.6 Ansell Ltd.
                • Ansell Ltd. - Overview
                • Ansell Ltd. - Business segments
                • Ansell Ltd. - Key news
                • Ansell Ltd. - Key offerings
                • Ansell Ltd. - Segment focus
                • SWOT
              • 15.7 Bunzl Plc
                • Bunzl Plc - Overview
                • Bunzl Plc - Business segments
                • Bunzl Plc - Key news
                • Bunzl Plc - Key offerings
                • Bunzl Plc - Segment focus
                • SWOT
              • 15.8 Delta Plus Group
                • Delta Plus Group - Overview
                • Delta Plus Group - Business segments
                • Delta Plus Group - Key offerings
                • Delta Plus Group - Segment focus
                • SWOT
              • 15.9 Dragerwerk AG and Co. KGaA
                • Dragerwerk AG and Co. KGaA - Overview
                • Dragerwerk AG and Co. KGaA - Business segments
                • Dragerwerk AG and Co. KGaA - Key offerings
                • Dragerwerk AG and Co. KGaA - Segment focus
                • SWOT
              • 15.10 DuPont de Nemours Inc.
                • DuPont de Nemours Inc. - Overview
                • DuPont de Nemours Inc. - Business segments
                • DuPont de Nemours Inc. - Key news
                • DuPont de Nemours Inc. - Key offerings
                • DuPont de Nemours Inc. - Segment focus
                • SWOT
              • 15.11 Honeywell International Inc.
                • Honeywell International Inc. - Overview
                • Honeywell International Inc. - Business segments
                • Honeywell International Inc. - Key news
                • Honeywell International Inc. - Key offerings
                • Honeywell International Inc. - Segment focus
                • SWOT
              • 15.12 Kimberly Clark Corp.
                • Kimberly Clark Corp. - Overview
                • Kimberly Clark Corp. - Business segments
                • Kimberly Clark Corp. - Key news
                • Kimberly Clark Corp. - Key offerings
                • Kimberly Clark Corp. - Segment focus
                • SWOT
              • 15.13 Lakeland Industries Inc.
                • Lakeland Industries Inc. - Overview
                • Lakeland Industries Inc. - Business segments
                • Lakeland Industries Inc. - Key news
                • Lakeland Industries Inc. - Key offerings
                • Lakeland Industries Inc. - Segment focus
                • SWOT
              • 15.14 Magid Glove and Safety Manufacturing Co. LLC
                • Magid Glove and Safety Manufacturing Co. LLC - Overview
                • Magid Glove and Safety Manufacturing Co. LLC - Product / Service
                • Magid Glove and Safety Manufacturing Co. LLC - Key offerings
                • SWOT
              • 15.15 Mallcom India Ltd.
                • Mallcom India Ltd. - Overview
                • Mallcom India Ltd. - Product / Service
                • Mallcom India Ltd. - Key offerings
                • SWOT
              • 15.16 Midas Safety Inc.
                • Midas Safety Inc. - Overview
                • Midas Safety Inc. - Product / Service
                • Midas Safety Inc. - Key offerings
                • SWOT
              • 15.17 Moldex Metric
                • Moldex Metric - Overview
                • Moldex Metric - Product / Service
                • Moldex Metric - Key offerings
                • SWOT
              • 15.18 MSA Safety Inc.
                • MSA Safety Inc. - Overview
                • MSA Safety Inc. - Business segments
                • MSA Safety Inc. - Key offerings
                • MSA Safety Inc. - Segment focus
                • SWOT

              16 Appendix

              • 16.1 Scope of the report
                • 16.2 Inclusions and exclusions checklist
                  • Inclusions checklist
                  • Exclusions checklist
                • 16.3 Currency conversion rates for US$
                  • Currency conversion rates for US$
                • 16.4 Research methodology
                  • Research methodology
                • 16.5 Data procurement
                  • Information sources
                • 16.6 Data validation
                  • Data validation
                • 16.7 Validation techniques employed for market sizing
                  • Validation techniques employed for market sizing
                • 16.8 Data synthesis
                  • Data synthesis
                • 16.9 360 degree market analysis
                  • 360 degree market analysis
                • 16.10 List of abbreviations
                  • List of abbreviations

                Research Methodology

                Technavio presents a detailed picture of the market by way of study, synthesis, and summation of data from multiple sources. The analysts have presented the various facets of the market with a particular focus on identifying the key industry influencers. The data thus presented is comprehensive, reliable, and the result of extensive research, both primary and secondary.

                INFORMATION SOURCES

                Primary sources

                • Manufacturers and suppliers
                • Channel partners
                • Industry experts
                • Strategic decision makers

                Secondary sources

                • Industry journals and periodicals
                • Government data
                • Financial reports of key industry players
                • Historical data
                • Press releases

                DATA ANALYSIS

                Data Synthesis

                • Collation of data
                • Estimation of key figures
                • Analysis of derived insights

                Data Validation

                • Triangulation with data models
                • Reference against proprietary databases
                • Corroboration with industry experts

                REPORT WRITING

                Qualitative

                • Market drivers
                • Market challenges
                • Market trends
                • Five forces analysis

                Quantitative

                • Market size and forecast
                • Market segmentation
                • Geographical insights
                • Competitive landscape

                Interested in this report?

                Get your sample now to see our research methodology and insights!

                Download Now

                Frequently Asked Questions

                Personal Protective Equipment market growth will increase by $ 41.43 bn during 2025-2029.

                The Personal Protective Equipment market is expected to grow at a CAGR of 8.9% during 2025-2029.

                Personal Protective Equipment market is segmented by End-user( Manufacturing, Construction, Oil and gas, Healthcare, Others) Product( Protective clothing, Hand and arm protection, Protective footwear, Respiratory protection, Others) Distribution Channel( Offline, Online, Europe, Middle East and Africa, South America)

                3M Co., Alpha Pro Tech Ltd., Ansell Ltd., Bunzl Plc, Delta Plus Group, Dragerwerk AG and Co. KGaA, DuPont de Nemours Inc., Honeywell International Inc., Kimberly Clark Corp., Lakeland Industries Inc., Magid Glove and Safety Manufacturing Co. LLC, Mallcom India Ltd., Midas Safety Inc., Moldex Metric, MSA Safety Inc., Radians Inc., Rock Fall UK Ltd., Saf T Gard International Inc., UVEX WINTER HOLDING GmbH and Co. KG, WW Grainger Inc. are a few of the key vendors in the Personal Protective Equipment market.

                APAC will register the highest growth rate of 36% among the other regions. Therefore, the Personal Protective Equipment market in APAC is expected to garner significant business opportunities for the vendors during the forecast period.

                US, China, Germany, India, Canada, UK, Japan, France, South Korea, Australia

                • Risks of physical injuries in labor-intensive industriesIndustries such as automotive is the driving factor this market.
                • construction is the driving factor this market.
                • manufacturing is the driving factor this market.
                • chemicals is the driving factor this market.
                • and food processing are labor-intensive and are usually associated with certain risks such as impact-related injuries such as abrasion cuts is the driving factor this market.
                • slicing cuts is the driving factor this market.
                • and impact cuts. Injuries to the hands is the driving factor this market.
                • such as cuts and chemical burns is the driving factor this market.
                • may result in lacerations or even amputation is the driving factor this market.
                • which not only increases the need for emergency room visits and days away from work (lost man-days) but can also lead to costly compensation claims from workers. For instance is the driving factor this market.
                • the average cost of treating hand injuries may be between $2 is the driving factor this market.
                • 000 to $10 is the driving factor this market.
                • 000 in US and may require at least 6-10 days off from work. Treatment costs vary depending on the severity of the injury; for instance is the driving factor this market.
                • stitches may cost $2 is the driving factor this market.
                • 000-$2 is the driving factor this market.
                • 500 in US is the driving factor this market.
                • whereas a laceration can cost above $10 is the driving factor this market.
                • 000.One of the main reasons for hand injuries is the absence of guidelines that mandate the use of protective hand gear is the driving factor this market.
                • such as gloves. According to the US Bureau of Labor Statistics is the driving factor this market.
                • 70% of workers who sustain hand injuries do not wear gloves while performing tasks. The remaining 30% wear gloves that are inadequate and ineffective in protecting the hands against injuries as they are ill-fitting or damaged. Thus is the driving factor this market.
                • the increasing incidence of impact-related hand injuries in industrial activities and the associated costs of treatment are influencing employers to make protective personal equipment is the driving factor this market.
                • such as gloves is the driving factor this market.
                • mandatory for their employees. This is creating demand for personal protective equipment is the driving factor this market.
                • which in turn is the driving factor this market.
                • is expected to drive the growth of the global personal protective equipment market during the forecast period. is the driving factor this market.

                The Personal Protective Equipment market vendors should focus on grabbing business opportunities from the Manufacturing segment as it accounted for the largest market share in the base year.