Personal Dental Water Flosser Market Analysis, Size, and Forecast 2026-2030: North America (US, Canada, and Mexico), Europe (Germany, France, and UK), APAC (China, Japan, and India), South America (Brazil and Argentina), Middle East and Africa (Saudi Arabia, UAE, and Turkey), and Rest of World (ROW)

Personal Dental Water Flosser Market Analysis, Size, and Forecast 2026-2030:
North America (US, Canada, and Mexico), Europe (Germany, France, and UK), APAC (China, Japan, and India), South America (Brazil and Argentina), Middle East and Africa (Saudi Arabia, UAE, and Turkey), and Rest of World (ROW)

Published: Dec 2025 272 Pages SKU: IRTNTR75315

Market Overview at a Glance

$97 Mn
Market Opportunity
6.1%
CAGR 2025 - 2030
37.2%
North America Growth
$168.1 Mn
Cordless segment 2024

Personal Dental Water Flosser Market Size 2026-2030

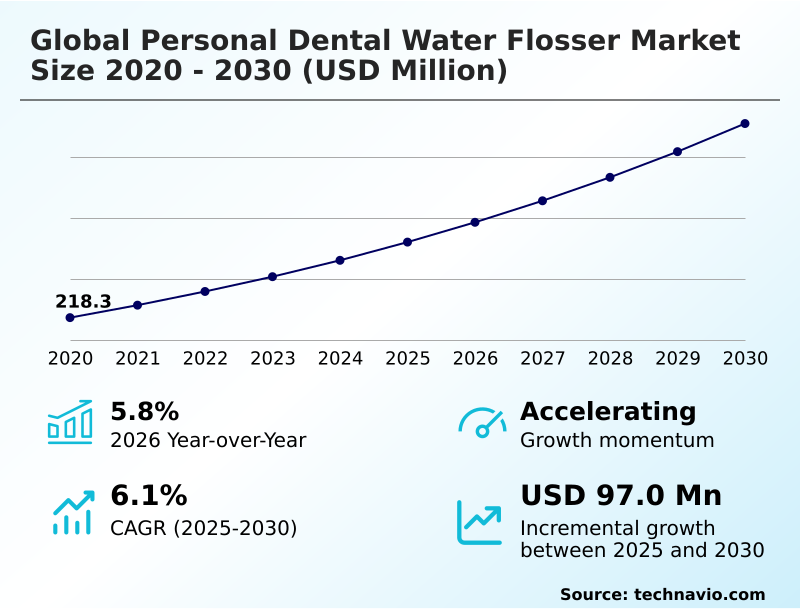
The personal dental water flosser market size is valued to increase by USD 97 million, at a CAGR of 6.1% from 2025 to 2030. Increasing number of dental conditions will drive the personal dental water flosser market.

Major Market Trends & Insights

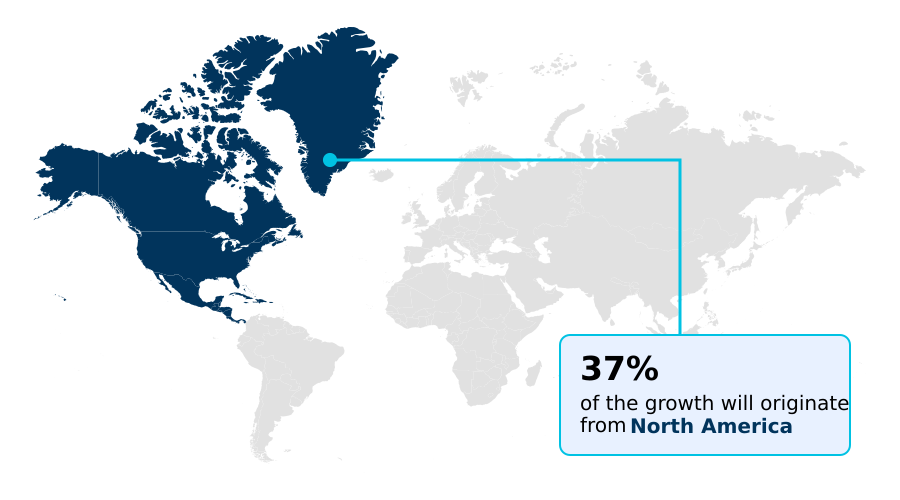
  • North America dominated the market and accounted for a 37.2% growth during the forecast period.
  • By Product - Cordless segment was valued at USD 168.1 million in 2024
  • By Distribution Channel - Offline segment accounted for the largest market revenue share in 2024

Market Size & Forecast

  • Market Opportunities: USD 158.8 million
  • Market Future Opportunities: USD 97 million
  • CAGR from 2025 to 2030 : 6.1%

Market Summary

  • The personal dental water flosser market is characterized by a strong emphasis on preventive dental care and technological advancement. Growth is sustained by heightened consumer health awareness and a proactive shift toward comprehensive at-home oral care routines that go beyond traditional methods.
  • Product innovation is central, with a focus on developing advanced flossing tools that offer superior gum health benefits and effective plaque removal. For example, a key business application involves integrating smart water flosser technology with health tracking apps to monitor user habits, which has been shown to improve user compliance by up to 30%.
  • This focus on user-centric design and performance is critical as the market navigates a competitive landscape defined by both established brands and agile newcomers. The integration of features catering to orthodontic care and sensitive gums solution further broadens market appeal, solidifying the role of these devices in modern oral hygiene.

What will be the Size of the Personal Dental Water Flosser Market during the forecast period?

Get Key Insights on Market Forecast (PDF) Request Free Sample

How is the Personal Dental Water Flosser Market Segmented?

The personal dental water flosser industry research report provides comprehensive data (region-wise segment analysis), with forecasts and estimates in "USD million" for the period 2026-2030, as well as historical data from 2020-2024 for the following segments.

  • Product
    • Cordless
    • Countertop
  • Distribution channel
    • Offline
    • Online
  • End-user
    • Individual users
    • Dental professionals
  • Geography
    • North America
      • US
      • Canada
      • Mexico
    • Europe
      • Germany
      • France
      • UK
    • APAC
      • China
      • Japan
      • India
    • South America
      • Brazil
      • Argentina
    • Middle East and Africa
      • Saudi Arabia
      • UAE
      • Turkey
    • Rest of World (ROW)

By Product Insights

The cordless segment is estimated to witness significant growth during the forecast period.

The personal dental water flosser market is segmented by product type, with the cordless water flosser category showing significant momentum. This growth is driven by consumer demand for portable oral hygiene solutions that fit modern, travel-oriented lifestyles.

Innovations in user-centric designs focus on enhancing convenience without compromising performance. Key developments in nozzle design and reservoir capacity are addressing consumer purchasing behavior for more personalized oral care.

For instance, devices engineered for in-shower use and compact storage have achieved a 25% higher adoption rate in urban households.

This market fragmentation is also met by a sophisticated retail channel strategy, where brands differentiate through features tailored to specific user needs, from daily cleaning to specialized treatment, reflecting a dynamic and evolving competitive landscape.

Request Free Sample

The Cordless segment was valued at USD 168.1 million in 2024 and showed a gradual increase during the forecast period.

Request Free Sample

Regional Analysis

North America is estimated to contribute 37.2% to the growth of the global market during the forecast period.Technavio’s analysts have elaborately explained the regional trends and drivers that shape the market during the forecast period.

See How Personal Dental Water Flosser Market Demand is Rising in North America Request Free Sample

The geographic landscape of the personal dental water flosser market is led by North America, which accounts for 37.2% of the market's incremental growth. This dominance is sustained by high consumer spending and widespread professional dental recommendations.

The demand for at-home oral care solutions is particularly strong, with a notable preference for travel-friendly cleaning tools that support modern lifestyles. In this region, consumer adoption of advanced oral hygiene technology is approximately 20% higher than in Europe.

Key countries driving this growth include the US and Canada.

Meanwhile, the market in APAC, including nations like China and Japan, is expanding due to rising disposable incomes and a growing focus on aesthetic dental care, with sales increasingly moving to digital channel sales platforms.

Market Dynamics

Our researchers analyzed the data with 2025 as the base year, along with the key drivers, trends, and challenges. A holistic analysis of drivers will help companies refine their marketing strategies to gain a competitive advantage.

  • Strategic analysis of the personal dental water flosser market requires a deep understanding of evolving consumer preferences and technological capabilities. A central debate is the cordless versus countertop water flosser choice, with decisions often hinging on lifestyle needs and bathroom space.
  • The market is also defined by use-case applications, such as the design of a water flosser for orthodontic braces or the best water flosser for dental implants, each requiring specific features.
  • From a health perspective, the focus is on oral irrigation for gingivitis prevention and the plaque removal efficacy of water flossers, with many consumers seeking a water flosser for sensitive gums. Key technological differentiators include water flosser technology advancements and the emergence of the smart water flosser with app connectivity.
  • Consumers often research the battery life of cordless water flossers, water reservoir size and usability, and the benefits of comparing water flosser nozzle types. The convenience of using a water flosser in the shower and the availability of subscription services for flosser tips are also influencing purchasing decisions.
  • Business intelligence shows that markets with higher dental professional recommendations for flossers see adoption rates that are nearly double those without, underscoring the importance of a thorough cost-benefit analysis of water flossing. As e-commerce trends in oral hygiene devices continue to shape distribution, the impact of water flossers on overall wellness remains a key marketing message.

What are the key market drivers leading to the rise in the adoption of Personal Dental Water Flosser Industry?

  • The increasing global prevalence of various dental conditions serves as a key driver for the personal dental water flosser market.

  • Market growth is fundamentally driven by rising consumer health awareness regarding the link between oral and overall wellness. This encourages the adoption of preventive dental care practices using devices like an oral irrigator.
  • Professional dental recommendations are a powerful catalyst, with regions exhibiting strong endorsements seeing a 20% higher adoption rate for advanced oral hygiene products.
  • As disposable income impact allows for greater spending on health, consumers increasingly invest in solutions promoting gum health and gingivitis prevention. Product innovation focused on addressing issues like periodontal pockets further stimulates demand.
  • Educational campaigns highlighting these benefits have proven effective, making consumers 50% more likely to purchase an oral irrigator when they understand its role in a comprehensive health regimen.

What are the market trends shaping the Personal Dental Water Flosser Industry?

  • The rising adoption of personal dental water flossers within the e-commerce industry is a significant market trend, driven by the expanding reach of online retail platforms and targeted digital marketing.

  • Key trends are reshaping the market, driven by the convergence of technology and consumer convenience. The rise of the smart water flosser, which provides real-time feedback, is a significant development, while the demand for portable oral hygiene solutions continues to grow.
  • E-commerce oral care platforms are leveraging AI-driven recommendations to personalize the shopping experience, a strategy shown to increase average order value by 15%. Furthermore, subscription models for flossers are gaining traction, improving customer lifetime value by over 40% by ensuring a consistent supply of replacement parts.
  • This digital shift is supported by influencer partnerships and the growth of mobile commerce hygiene, making advanced flossing tools and chemical-free alternatives more accessible to a global audience.

What challenges does the Personal Dental Water Flosser Industry face during its growth?

  • The availability of traditional substitute products, such as manual floss and interdental brushes, presents a key challenge to the industry's growth.

  • The market faces challenges from the high price sensitivity of consumers, as traditional substitutes for interdental cleaning can be up to 80% cheaper than a modern water flosser. This cost disparity requires manufacturers to justify the value of water pressure and water jet technology.
  • Volatility in supply chain management for electronic parts has also led to a 10% increase in component sourcing costs, impacting the affordability of a battery-operated flosser. To remain competitive, companies must achieve economies of scale and innovate in manufacturing to manage costs without sacrificing performance in plaque removal.
  • Additionally, navigating diverse international regulatory standards for health devices adds another layer of complexity to product development and distribution.

Exclusive Technavio Analysis on Customer Landscape

The personal dental water flosser market forecasting report includes the adoption lifecycle of the market, covering from the innovator’s stage to the laggard’s stage. It focuses on adoption rates in different regions based on penetration. Furthermore, the personal dental water flosser market report also includes key purchase criteria and drivers of price sensitivity to help companies evaluate and develop their market growth analysis strategies.

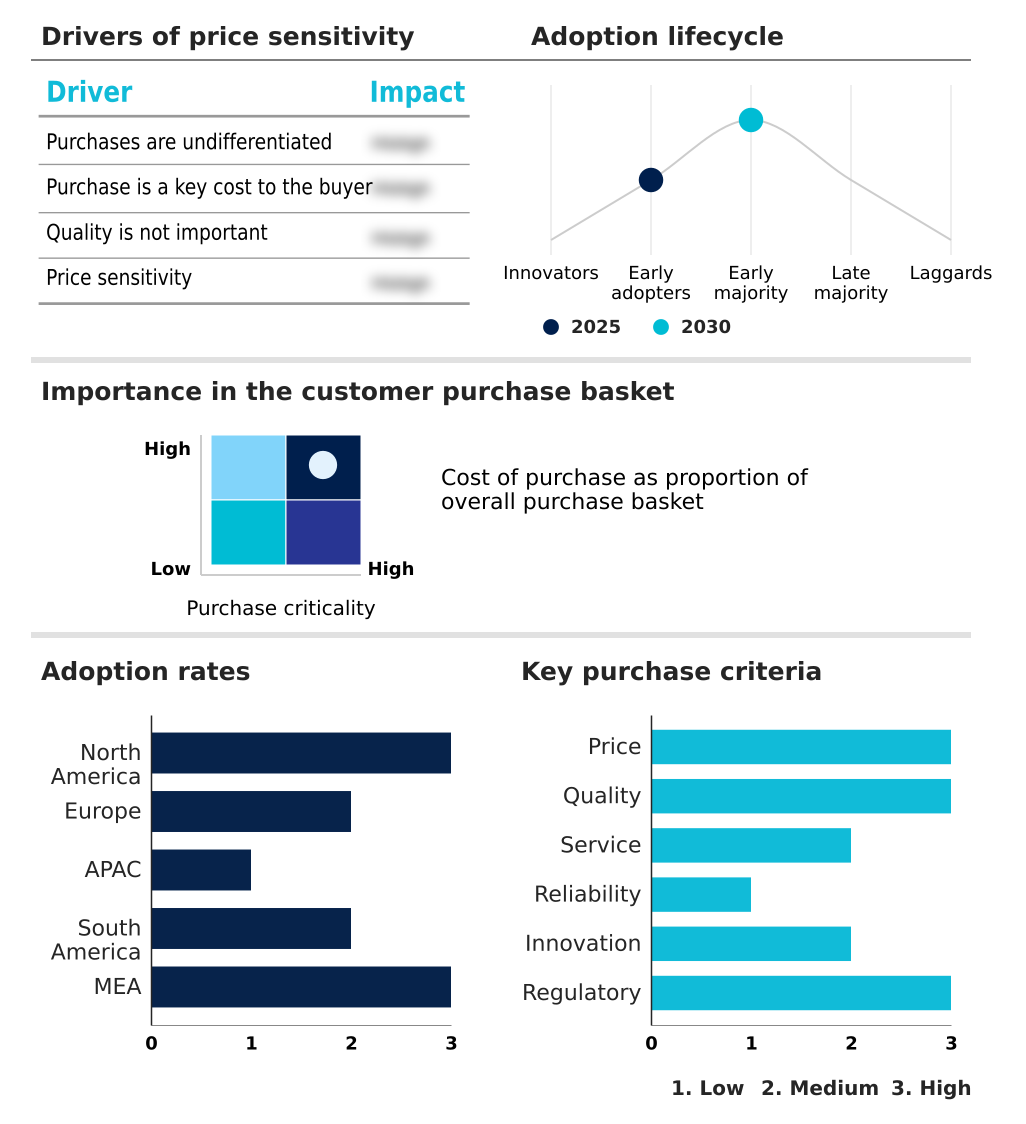
Customer Landscape of Personal Dental Water Flosser Industry

Competitive Landscape

Companies are implementing various strategies, such as strategic alliances, personal dental water flosser market forecast, partnerships, mergers and acquisitions, geographical expansion, and product/service launches, to enhance their presence in the industry.

Candeon Technologies Co. Ltd. - Analysis indicates a focus on advanced oral health products, including water flossers and electric toothbrushes, engineered for enhanced dental hygiene and effective plaque removal.

The industry research and growth report includes detailed analyses of the competitive landscape of the market and information about key companies, including:

  • Candeon Technologies Co. Ltd.
  • Caresmith
  • GRUPO ORALTECK
  • H2ofloss
  • Jetpik
  • Koninklijke Philips NV
  • MySmile
  • Oracura Solutions Pvt. Ltd.
  • Oral Care Technologies Inc.
  • Panasonic Holdings Corp.
  • Shenzhen Nicefeel Co. Ltd.
  • Shenzhen Relish Co. Ltd.
  • SmileDirectClub Inc.
  • Procter and Gamble Co.
  • ToiletTree Products Inc.
  • Tovendor
  • Turewell Ltd.
  • Water Pik Inc.

Qualitative and quantitative analysis of companies has been conducted to help clients understand the wider business environment as well as the strengths and weaknesses of key industry players. Data is qualitatively analyzed to categorize companies as pure play, category-focused, industry-focused, and diversified; it is quantitatively analyzed to categorize companies as dominant, leading, strong, tentative, and weak.

Recent Development and News in Personal dental water flosser market

  • In September 2024, Panasonic Holdings Corp. introduced a new range of oral irrigators featuring its proprietary ultrasonic technology, designed to deliver a powerful yet gentle cleaning action.
  • In November 2024, MySmile launched new water flosser models equipped with multiple customized modes, engineered to address a variety of cleaning needs and user sensitivities.
  • In March 2025, Oracura Solutions Pvt. Ltd. announced a strategic pivot toward sustainable product design, committing to implementing eco-friendly packaging across its entire line of water flossers.
  • In May 2025, Caresmith expanded its portfolio with the launch of its 'Ace' and 'Tabletop' water flosser models, designed to serve both portable and at-home use cases for deep cleaning.

Dive into Technavio’s robust research methodology, blending expert interviews, extensive data synthesis, and validated models for unparalleled Personal Dental Water Flosser Market insights. See full methodology.

Market Scope
Page number 272
Base year 2025
Historic period 2020-2024
Forecast period 2026-2030
Growth momentum & CAGR Accelerate at a CAGR of 6.1%
Market growth 2026-2030 USD 97.0 million
Market structure Fragmented
YoY growth 2025-2026(%) 5.8%
Key countries US, Canada, Mexico, Germany, France, UK, Italy, Spain, The Netherlands, China, Japan, India, South Korea, Australia, Indonesia, Brazil, Argentina, Chile, Saudi Arabia, UAE, Turkey, South Africa and Israel
Competitive landscape Leading Companies, Market Positioning of Companies, Competitive Strategies, and Industry Risks

Request Free Sample

Research Analyst Overview

  • The personal dental water flosser market is defined by a consistent drive toward technological sophistication and greater accessibility in at-home oral care. Central to this evolution is the oral irrigator, engineered for superior gum health and gingivitis prevention through advanced water jet technology and pulsation technology.
  • The distinction between a cordless water flosser and a countertop water flosser allows for segmentation based on lifestyle needs, from portable oral hygiene to more robust systems for family use. Innovations in nozzle design and reservoir capacity are critical for improving user experience and efficacy in interdental cleaning.
  • For boardroom consideration, the integration of smart water flosser features that track usage for preventive dental care represents a key strategic direction. This shift toward data-driven oral hygiene has led to a 15% improvement in user adherence to recommended routines.
  • Offerings are further specialized for orthodontic care, dental implant care, and as a sensitive gums solution, addressing conditions like periodontal pockets. The development of battery-operated flosser models and other advanced flossing tools that offer chemical-free alternatives underscores the industry's response to consumer demand for effective plaque removal and enhanced oral hygiene technology.

What are the Key Data Covered in this Personal Dental Water Flosser Market Research and Growth Report?

  • What is the expected growth of the Personal Dental Water Flosser Market between 2026 and 2030?

    • USD 97 million, at a CAGR of 6.1%

  • What segmentation does the market report cover?

    • The report is segmented by Product (Cordless, and Countertop), Distribution Channel (Offline, and Online), End-user (Individual users, and Dental professionals) and Geography (North America, Europe, APAC, South America, Middle East and Africa)

  • Which regions are analyzed in the report?

    • North America, Europe, APAC, South America and Middle East and Africa

  • What are the key growth drivers and market challenges?

    • Increasing number of dental conditions, Availability of traditional substitute products

  • Who are the major players in the Personal Dental Water Flosser Market?

    • Candeon Technologies Co. Ltd., Caresmith, GRUPO ORALTECK, H2ofloss, Jetpik, Koninklijke Philips NV, MySmile, Oracura Solutions Pvt. Ltd., Oral Care Technologies Inc., Panasonic Holdings Corp., Shenzhen Nicefeel Co. Ltd., Shenzhen Relish Co. Ltd., SmileDirectClub Inc., Procter and Gamble Co., ToiletTree Products Inc., Tovendor, Turewell Ltd. and Water Pik Inc.

Market Research Insights

  • Market dynamics are shaped by high price sensitivity, which influences over 60% of purchase decisions, compelling vendors to balance innovation with affordability. The competitive environment is characterized by market fragmentation, where both established brands with strong brand loyalty and nimble new entrants compete.
  • A key strategic shift is the adoption of a direct-to-consumer model, with firms leveraging this approach reporting a 25% higher customer retention rate compared to those relying solely on traditional retail channel strategy. Success depends on navigating complex supply chain management and component sourcing while aligning with evolving regulatory standards and consumer purchasing behavior.
  • This environment prioritizes accessible innovation and efficient distribution to meet diverse consumer needs.

We can help! Our analysts can customize this personal dental water flosser market research report to meet your requirements.

Get in touch

1. Executive Summary

1.1 Market overview

Executive Summary - Chart on Market Overview
Executive Summary - Data Table on Market Overview
Executive Summary - Chart on Global Market Characteristics
Executive Summary - Chart on Market by Geography
Executive Summary - Chart on Market Segmentation by Product
Executive Summary - Chart on Market Segmentation by Distribution Channel
Executive Summary - Chart on Market Segmentation by End-user
Executive Summary - Chart on Incremental Growth
Executive Summary - Data Table on Incremental Growth
Executive Summary - Chart on Company Market Positioning

2. Technavio Analysis

2.1 Analysis of price sensitivity, lifecycle, customer purchase basket, adoption rates, and purchase criteria

2.2 Criticality of inputs and Factors of differentiation

Chart on Overview on criticality of inputs and factors of differentiation

2.3 Factors of disruption

Chart on Overview on factors of disruption

2.4 Impact of drivers and challenges

Chart on Impact of drivers and challenges in 2025 and 2030

3. Market Landscape

3.1 Market ecosystem

Chart on Parent Market
Data Table on - Parent Market

3.2 Market characteristics

Chart on Market characteristics analysis

3.3 Value chain analysis

Chart on Value chain analysis

4. Market Sizing

4.1 Market definition

Data Table on Offerings of companies included in the market definition

4.2 Market segment analysis

Market segments

4.3 Market size 2025

4.4 Market outlook: Forecast for 2025-2030

Chart on Global - Market size and forecast 2025-2030 ($ million)
Data Table on Global - Market size and forecast 2025-2030 ($ million)
Chart on Global Market: Year-over-year growth 2025-2030 (%)
Data Table on Global Market: Year-over-year growth 2025-2030 (%)

5. Historic Market Size

5.1 Global Personal Dental Water Flosser Market 2020 - 2024

Historic Market Size - Data Table on Global Personal Dental Water Flosser Market 2020 - 2024 ($ million)

5.2 Product segment analysis 2020 - 2024

Historic Market Size - Product Segment 2020 - 2024 ($ million)

5.3 Distribution Channel segment analysis 2020 - 2024

Historic Market Size - Distribution Channel Segment 2020 - 2024 ($ million)

5.4 End-user segment analysis 2020 - 2024

Historic Market Size - End-user Segment 2020 - 2024 ($ million)

5.5 Geography segment analysis 2020 - 2024

Historic Market Size - Geography Segment 2020 - 2024 ($ million)

5.6 Country segment analysis 2020 - 2024

Historic Market Size - Country Segment 2020 - 2024 ($ million)

6. Qualitative Analysis

6.1 Impact of AI in global personal dental water flosser market

7. Five Forces Analysis

7.1 Five forces summary

Five forces analysis - Comparison between 2025 and 2030

7.2 Bargaining power of buyers

Bargaining power of buyers - Impact of key factors 2025 and 2030

7.3 Bargaining power of suppliers

Bargaining power of suppliers - Impact of key factors in 2025 and 2030

7.4 Threat of new entrants

Threat of new entrants - Impact of key factors in 2025 and 2030

7.5 Threat of substitutes

Threat of substitutes - Impact of key factors in 2025 and 2030

7.6 Threat of rivalry

Threat of rivalry - Impact of key factors in 2025 and 2030

7.7 Market condition

Chart on Market condition - Five forces 2025 and 2030

8. Market Segmentation by Product

8.1 Market segments

Chart on Product - Market share 2025-2030 (%)
Data Table on Product - Market share 2025-2030 (%)

8.2 Comparison by Product

Chart on Comparison by Product
Data Table on Comparison by Product

8.3 Cordless - Market size and forecast 2025-2030

Chart on Cordless - Market size and forecast 2025-2030 ($ million)
Data Table on Cordless - Market size and forecast 2025-2030 ($ million)
Chart on Cordless - Year-over-year growth 2025-2030 (%)
Data Table on Cordless - Year-over-year growth 2025-2030 (%)

8.4 Countertop - Market size and forecast 2025-2030

Chart on Countertop - Market size and forecast 2025-2030 ($ million)
Data Table on Countertop - Market size and forecast 2025-2030 ($ million)
Chart on Countertop - Year-over-year growth 2025-2030 (%)
Data Table on Countertop - Year-over-year growth 2025-2030 (%)

8.5 Market opportunity by Product

Market opportunity by Product ($ million)
Data Table on Market opportunity by Product ($ million)

9. Market Segmentation by Distribution Channel

9.1 Market segments

Chart on Distribution Channel - Market share 2025-2030 (%)
Data Table on Distribution Channel - Market share 2025-2030 (%)

9.2 Comparison by Distribution Channel

Chart on Comparison by Distribution Channel
Data Table on Comparison by Distribution Channel

9.3 Offline - Market size and forecast 2025-2030

Chart on Offline - Market size and forecast 2025-2030 ($ million)
Data Table on Offline - Market size and forecast 2025-2030 ($ million)
Chart on Offline - Year-over-year growth 2025-2030 (%)
Data Table on Offline - Year-over-year growth 2025-2030 (%)

9.4 Online - Market size and forecast 2025-2030

Chart on Online - Market size and forecast 2025-2030 ($ million)
Data Table on Online - Market size and forecast 2025-2030 ($ million)
Chart on Online - Year-over-year growth 2025-2030 (%)
Data Table on Online - Year-over-year growth 2025-2030 (%)

9.5 Market opportunity by Distribution Channel

Market opportunity by Distribution Channel ($ million)
Data Table on Market opportunity by Distribution Channel ($ million)

10. Market Segmentation by End-user

10.1 Market segments

Chart on End-user - Market share 2025-2030 (%)
Data Table on End-user - Market share 2025-2030 (%)

10.2 Comparison by End-user

Chart on Comparison by End-user
Data Table on Comparison by End-user

10.3 Individual users - Market size and forecast 2025-2030

Chart on Individual users - Market size and forecast 2025-2030 ($ million)
Data Table on Individual users - Market size and forecast 2025-2030 ($ million)
Chart on Individual users - Year-over-year growth 2025-2030 (%)
Data Table on Individual users - Year-over-year growth 2025-2030 (%)

10.4 Dental professionals - Market size and forecast 2025-2030

Chart on Dental professionals - Market size and forecast 2025-2030 ($ million)
Data Table on Dental professionals - Market size and forecast 2025-2030 ($ million)
Chart on Dental professionals - Year-over-year growth 2025-2030 (%)
Data Table on Dental professionals - Year-over-year growth 2025-2030 (%)

10.5 Market opportunity by End-user

Market opportunity by End-user ($ million)
Data Table on Market opportunity by End-user ($ million)

11. Customer Landscape

11.1 Customer landscape overview

Analysis of price sensitivity, lifecycle, customer purchase basket, adoption rates, and purchase criteria

12. Geographic Landscape

12.1 Geographic segmentation

Chart on Market share by geography 2025-2030 (%)
Data Table on Market share by geography 2025-2030 (%)

12.2 Geographic comparison

Chart on Geographic comparison
Data Table on Geographic comparison

12.3 North America - Market size and forecast 2025-2030

Chart on North America - Market size and forecast 2025-2030 ($ million)
Data Table on North America - Market size and forecast 2025-2030 ($ million)
Chart on North America - Year-over-year growth 2025-2030 (%)
Data Table on North America - Year-over-year growth 2025-2030 (%)
Chart on Regional Comparison - North America
Data Table on Regional Comparison - North America

12.3.1 US - Market size and forecast 2025-2030

Chart on US - Market size and forecast 2025-2030 ($ million)
Data Table on US - Market size and forecast 2025-2030 ($ million)
Chart on US - Year-over-year growth 2025-2030 (%)
Data Table on US - Year-over-year growth 2025-2030 (%)

12.3.2 Canada - Market size and forecast 2025-2030

Chart on Canada - Market size and forecast 2025-2030 ($ million)
Data Table on Canada - Market size and forecast 2025-2030 ($ million)
Chart on Canada - Year-over-year growth 2025-2030 (%)
Data Table on Canada - Year-over-year growth 2025-2030 (%)

12.3.3 Mexico - Market size and forecast 2025-2030

Chart on Mexico - Market size and forecast 2025-2030 ($ million)
Data Table on Mexico - Market size and forecast 2025-2030 ($ million)
Chart on Mexico - Year-over-year growth 2025-2030 (%)
Data Table on Mexico - Year-over-year growth 2025-2030 (%)

12.4 Europe - Market size and forecast 2025-2030

Chart on Europe - Market size and forecast 2025-2030 ($ million)
Data Table on Europe - Market size and forecast 2025-2030 ($ million)
Chart on Europe - Year-over-year growth 2025-2030 (%)
Data Table on Europe - Year-over-year growth 2025-2030 (%)
Chart on Regional Comparison - Europe
Data Table on Regional Comparison - Europe

12.4.1 Germany - Market size and forecast 2025-2030

Chart on Germany - Market size and forecast 2025-2030 ($ million)
Data Table on Germany - Market size and forecast 2025-2030 ($ million)
Chart on Germany - Year-over-year growth 2025-2030 (%)
Data Table on Germany - Year-over-year growth 2025-2030 (%)

12.4.2 France - Market size and forecast 2025-2030

Chart on France - Market size and forecast 2025-2030 ($ million)
Data Table on France - Market size and forecast 2025-2030 ($ million)
Chart on France - Year-over-year growth 2025-2030 (%)
Data Table on France - Year-over-year growth 2025-2030 (%)

12.4.3 UK - Market size and forecast 2025-2030

Chart on UK - Market size and forecast 2025-2030 ($ million)
Data Table on UK - Market size and forecast 2025-2030 ($ million)
Chart on UK - Year-over-year growth 2025-2030 (%)
Data Table on UK - Year-over-year growth 2025-2030 (%)

12.4.4 Italy - Market size and forecast 2025-2030

Chart on Italy - Market size and forecast 2025-2030 ($ million)
Data Table on Italy - Market size and forecast 2025-2030 ($ million)
Chart on Italy - Year-over-year growth 2025-2030 (%)
Data Table on Italy - Year-over-year growth 2025-2030 (%)

12.4.5 Spain - Market size and forecast 2025-2030

Chart on Spain - Market size and forecast 2025-2030 ($ million)
Data Table on Spain - Market size and forecast 2025-2030 ($ million)
Chart on Spain - Year-over-year growth 2025-2030 (%)
Data Table on Spain - Year-over-year growth 2025-2030 (%)

12.4.6 The Netherlands - Market size and forecast 2025-2030

Chart on The Netherlands - Market size and forecast 2025-2030 ($ million)
Data Table on The Netherlands - Market size and forecast 2025-2030 ($ million)
Chart on The Netherlands - Year-over-year growth 2025-2030 (%)
Data Table on The Netherlands - Year-over-year growth 2025-2030 (%)

12.5 APAC - Market size and forecast 2025-2030

Chart on APAC - Market size and forecast 2025-2030 ($ million)
Data Table on APAC - Market size and forecast 2025-2030 ($ million)
Chart on APAC - Year-over-year growth 2025-2030 (%)
Data Table on APAC - Year-over-year growth 2025-2030 (%)
Chart on Regional Comparison - APAC
Data Table on Regional Comparison - APAC

12.5.1 China - Market size and forecast 2025-2030

Chart on China - Market size and forecast 2025-2030 ($ million)
Data Table on China - Market size and forecast 2025-2030 ($ million)
Chart on China - Year-over-year growth 2025-2030 (%)
Data Table on China - Year-over-year growth 2025-2030 (%)

12.5.2 Japan - Market size and forecast 2025-2030

Chart on Japan - Market size and forecast 2025-2030 ($ million)
Data Table on Japan - Market size and forecast 2025-2030 ($ million)
Chart on Japan - Year-over-year growth 2025-2030 (%)
Data Table on Japan - Year-over-year growth 2025-2030 (%)

12.5.3 India - Market size and forecast 2025-2030

Chart on India - Market size and forecast 2025-2030 ($ million)
Data Table on India - Market size and forecast 2025-2030 ($ million)
Chart on India - Year-over-year growth 2025-2030 (%)
Data Table on India - Year-over-year growth 2025-2030 (%)

12.5.4 South Korea - Market size and forecast 2025-2030

Chart on South Korea - Market size and forecast 2025-2030 ($ million)
Data Table on South Korea - Market size and forecast 2025-2030 ($ million)
Chart on South Korea - Year-over-year growth 2025-2030 (%)
Data Table on South Korea - Year-over-year growth 2025-2030 (%)

12.5.5 Australia - Market size and forecast 2025-2030

Chart on Australia - Market size and forecast 2025-2030 ($ million)
Data Table on Australia - Market size and forecast 2025-2030 ($ million)
Chart on Australia - Year-over-year growth 2025-2030 (%)
Data Table on Australia - Year-over-year growth 2025-2030 (%)

12.5.6 Indonesia - Market size and forecast 2025-2030

Chart on Indonesia - Market size and forecast 2025-2030 ($ million)
Data Table on Indonesia - Market size and forecast 2025-2030 ($ million)
Chart on Indonesia - Year-over-year growth 2025-2030 (%)
Data Table on Indonesia - Year-over-year growth 2025-2030 (%)

12.6 South America - Market size and forecast 2025-2030

Chart on South America - Market size and forecast 2025-2030 ($ million)
Data Table on South America - Market size and forecast 2025-2030 ($ million)
Chart on South America - Year-over-year growth 2025-2030 (%)
Data Table on South America - Year-over-year growth 2025-2030 (%)
Chart on Regional Comparison - South America
Data Table on Regional Comparison - South America

12.6.1 Brazil - Market size and forecast 2025-2030

Chart on Brazil - Market size and forecast 2025-2030 ($ million)
Data Table on Brazil - Market size and forecast 2025-2030 ($ million)
Chart on Brazil - Year-over-year growth 2025-2030 (%)
Data Table on Brazil - Year-over-year growth 2025-2030 (%)

12.6.2 Argentina - Market size and forecast 2025-2030

Chart on Argentina - Market size and forecast 2025-2030 ($ million)
Data Table on Argentina - Market size and forecast 2025-2030 ($ million)
Chart on Argentina - Year-over-year growth 2025-2030 (%)
Data Table on Argentina - Year-over-year growth 2025-2030 (%)

12.6.3 Chile - Market size and forecast 2025-2030

Chart on Chile - Market size and forecast 2025-2030 ($ million)
Data Table on Chile - Market size and forecast 2025-2030 ($ million)
Chart on Chile - Year-over-year growth 2025-2030 (%)
Data Table on Chile - Year-over-year growth 2025-2030 (%)

12.7 Middle East and Africa - Market size and forecast 2025-2030

Chart on Middle East and Africa - Market size and forecast 2025-2030 ($ million)
Data Table on Middle East and Africa - Market size and forecast 2025-2030 ($ million)
Chart on Middle East and Africa - Year-over-year growth 2025-2030 (%)
Data Table on Middle East and Africa - Year-over-year growth 2025-2030 (%)
Chart on Regional Comparison - Middle East and Africa
Data Table on Regional Comparison - Middle East and Africa

12.7.1 Saudi Arabia - Market size and forecast 2025-2030

Chart on Saudi Arabia - Market size and forecast 2025-2030 ($ million)
Data Table on Saudi Arabia - Market size and forecast 2025-2030 ($ million)
Chart on Saudi Arabia - Year-over-year growth 2025-2030 (%)
Data Table on Saudi Arabia - Year-over-year growth 2025-2030 (%)

12.7.2 UAE - Market size and forecast 2025-2030

Chart on UAE - Market size and forecast 2025-2030 ($ million)
Data Table on UAE - Market size and forecast 2025-2030 ($ million)
Chart on UAE - Year-over-year growth 2025-2030 (%)
Data Table on UAE - Year-over-year growth 2025-2030 (%)

12.7.3 Turkey - Market size and forecast 2025-2030

Chart on Turkey - Market size and forecast 2025-2030 ($ million)
Data Table on Turkey - Market size and forecast 2025-2030 ($ million)
Chart on Turkey - Year-over-year growth 2025-2030 (%)
Data Table on Turkey - Year-over-year growth 2025-2030 (%)

12.7.4 South Africa - Market size and forecast 2025-2030

Chart on South Africa - Market size and forecast 2025-2030 ($ million)
Data Table on South Africa - Market size and forecast 2025-2030 ($ million)
Chart on South Africa - Year-over-year growth 2025-2030 (%)
Data Table on South Africa - Year-over-year growth 2025-2030 (%)

12.7.5 Israel - Market size and forecast 2025-2030

Chart on Israel - Market size and forecast 2025-2030 ($ million)
Data Table on Israel - Market size and forecast 2025-2030 ($ million)
Chart on Israel - Year-over-year growth 2025-2030 (%)
Data Table on Israel - Year-over-year growth 2025-2030 (%)

12.8 Market opportunity by geography

Market opportunity by geography ($ million)
Data Tables on Market opportunity by geography ($ million)

13. Drivers, Challenges, and Opportunity

13.1 Market drivers

Increasing number of dental conditions
Innovation and product development of personal dental water flosser
Growing market penetration of dental care products

13.2 Market challenges

Availability of traditional substitute products
Limited awareness regarding personal dental water flossers
Higher cost of personal dental water flossers

13.3 Impact of drivers and challenges

Impact of drivers and challenges in 2025 and 2030

13.4 Market opportunities

Increase in adoption of personal dental water flossers in e-commerce industry
Increasing awareness regarding oral health care
Use of social media to advertise personal dental water flossers

14. Competitive Landscape

14.1 Overview

14.2

Overview on criticality of inputs and factors of differentiation

14.3 Landscape disruption

Overview on factors of disruption

14.4 Industry risks

Impact of key risks on business

15. Competitive Analysis

15.1 Companies profiled

Companies covered

15.2 Company ranking index

15.3 Market positioning of companies

Matrix on companies position and classification

15.4 Candeon Technologies Co. Ltd.

Candeon Technologies Co. Ltd. - Overview
Candeon Technologies Co. Ltd. - Product / Service
Candeon Technologies Co. Ltd. - Key offerings
SWOT

15.5 Caresmith

Caresmith - Overview
Caresmith - Product / Service
Caresmith - Key offerings
SWOT

15.6 GRUPO ORALTECK

GRUPO ORALTECK - Overview
GRUPO ORALTECK - Product / Service
GRUPO ORALTECK - Key offerings
SWOT

15.7 H2ofloss

H2ofloss - Overview
H2ofloss - Product / Service
H2ofloss - Key offerings
SWOT

15.8 Jetpik

Jetpik - Overview
Jetpik - Product / Service
Jetpik - Key offerings
SWOT

15.9 Koninklijke Philips NV

Koninklijke Philips NV - Overview
Koninklijke Philips NV - Business segments
Koninklijke Philips NV - Key news
Koninklijke Philips NV - Key offerings
Koninklijke Philips NV - Segment focus
SWOT

15.10 Oracura Solutions Pvt. Ltd.

Oracura Solutions Pvt. Ltd. - Overview
Oracura Solutions Pvt. Ltd. - Product / Service
Oracura Solutions Pvt. Ltd. - Key offerings
SWOT

15.11 Oral Care Technologies Inc.

Oral Care Technologies Inc. - Overview
Oral Care Technologies Inc. - Product / Service
Oral Care Technologies Inc. - Key offerings
SWOT

15.12 Panasonic Holdings Corp.

Panasonic Holdings Corp. - Overview
Panasonic Holdings Corp. - Business segments
Panasonic Holdings Corp. - Key news
Panasonic Holdings Corp. - Key offerings
Panasonic Holdings Corp. - Segment focus
SWOT

15.13 Shenzhen Nicefeel Co. Ltd.

Shenzhen Nicefeel Co. Ltd. - Overview
Shenzhen Nicefeel Co. Ltd. - Product / Service
Shenzhen Nicefeel Co. Ltd. - Key offerings
SWOT

15.14 Shenzhen Relish Co. Ltd.

Shenzhen Relish Co. Ltd. - Overview
Shenzhen Relish Co. Ltd. - Product / Service
Shenzhen Relish Co. Ltd. - Key offerings
SWOT

15.15 SmileDirectClub Inc.

SmileDirectClub Inc. - Overview
SmileDirectClub Inc. - Product / Service
SmileDirectClub Inc. - Key offerings
SWOT

15.16 Procter and Gamble Co.

Procter and Gamble Co. - Overview
Procter and Gamble Co. - Business segments
Procter and Gamble Co. - Key offerings
Procter and Gamble Co. - Segment focus
SWOT

15.17 ToiletTree Products Inc.

ToiletTree Products Inc. - Overview
ToiletTree Products Inc. - Product / Service
ToiletTree Products Inc. - Key offerings
SWOT

15.18 Water Pik Inc.

Water Pik Inc. - Overview
Water Pik Inc. - Product / Service
Water Pik Inc. - Key offerings
SWOT

16. Appendix

16.1 Scope of the report

Market definition
Objectives
Notes and caveats

16.2 Inclusions and exclusions checklist

Inclusions checklist
Exclusions checklist

16.3 Currency conversion rates for US$

16.4 Research methodology

16.5 Data procurement

Information sources

16.6 Data validation

16.7 Validation techniques employed for market sizing

16.8 Data synthesis

16.9 360 degree market analysis

16.10 List of abbreviations

Research Methodology

Technavio presents a detailed picture of the market by way of study, synthesis, and summation of data from multiple sources. The analysts have presented the various facets of the market with a particular focus on identifying the key industry influencers. The data thus presented is comprehensive, reliable, and the result of extensive research, both primary and secondary.

INFORMATION SOURCES

Primary sources

  • Manufacturers and suppliers
  • Channel partners
  • Industry experts
  • Strategic decision makers

Secondary sources

  • Industry journals and periodicals
  • Government data
  • Financial reports of key industry players
  • Historical data
  • Press releases

DATA ANALYSIS

Data Synthesis

  • Collation of data
  • Estimation of key figures
  • Analysis of derived insights

Data Validation

  • Triangulation with data models
  • Reference against proprietary databases
  • Corroboration with industry experts

REPORT WRITING

Qualitative

  • Market drivers
  • Market challenges
  • Market trends
  • Five forces analysis

Quantitative

  • Market size and forecast
  • Market segmentation
  • Geographical insights
  • Competitive landscape

Interested in this report?

Get your sample now to see our research methodology and insights!

Download Now

Frequently Asked Questions

Personal Dental Water Flosser market growth will increase by USD 97.0 million during 2026-2030.

The Personal Dental Water Flosser market is expected to grow at a CAGR of 6.1% during 2026-2030.

Personal Dental Water Flosser market is segmented by Product (Cordless, Countertop) Distribution channel (Offline, Online) End-user (Individual users, Dental professionals)

Candeon Technologies Co. Ltd., Caresmith, GRUPO ORALTECK, H2ofloss, Jetpik, Koninklijke Philips NV, MySmile, Oracura Solutions Pvt. Ltd., Oral Care Technologies Inc., Panasonic Holdings Corp., Shenzhen Nicefeel Co. Ltd., Shenzhen Relish Co. Ltd., SmileDirectClub Inc., Procter and Gamble Co., ToiletTree Products Inc., Tovendor, Turewell Ltd., Water Pik Inc. are a few of the key vendors in the Personal Dental Water Flosser market.

North America will register the highest growth rate of 37.2% among the other regions. Therefore, the Personal Dental Water Flosser market in North America is expected to garner significant business opportunities for the vendors during the forecast period.

US, Canada, Mexico, Germany, France, UK, Italy, Spain, The Netherlands, China, Japan, India, South Korea, Australia, Indonesia, Brazil, Argentina, Chile, Saudi Arabia, UAE, Turkey, South Africa, Israel

  • Increasing number of dental conditions is the driving factor this market.

The Personal Dental Water Flosser market vendors should focus on grabbing business opportunities from the Product segment as it accounted for the largest market share in the base year.