Osmometers Market Analysis, Size, and Forecast 2026-2030: North America (US, Canada, and Mexico), Europe (Germany, UK, and France), APAC (China, Japan, and India), South America (Brazil, Argentina, and Colombia), Middle East and Africa (Saudi Arabia, UAE, and Turkey), Asia, Rest of World (ROW)

Osmometers Market Analysis, Size, and Forecast 2026-2030:
North America (US, Canada, and Mexico), Europe (Germany, UK, and France), APAC (China, Japan, and India), South America (Brazil, Argentina, and Colombia), Middle East and Africa (Saudi Arabia, UAE, and Turkey), Asia, Rest of World (ROW)

Published: Jan 2026 281 Pages SKU: IRTNTR72572

Market Overview at a Glance

$14.44 Mn
Market Opportunity
3.3%
CAGR 2025 - 2030
40.3%
North America Growth
$36.27 Mn
Freezing point osmometers segment 2024

Osmometers Market Size 2026-2030

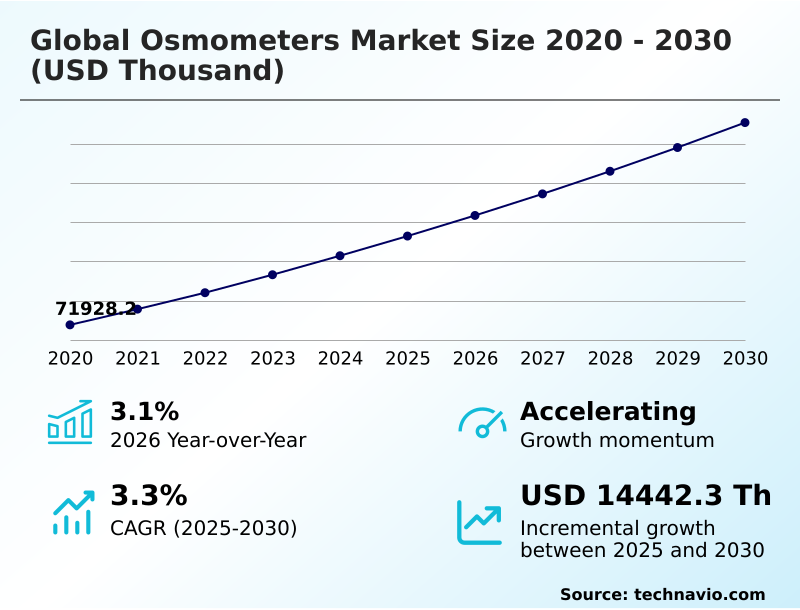
The osmometers market size is valued to increase by USD 14.44 million, at a CAGR of 3.3% from 2025 to 2030. Expanding pharmaceutical and biotechnology industries fuel demand for quality control will drive the osmometers market.

Major Market Trends & Insights

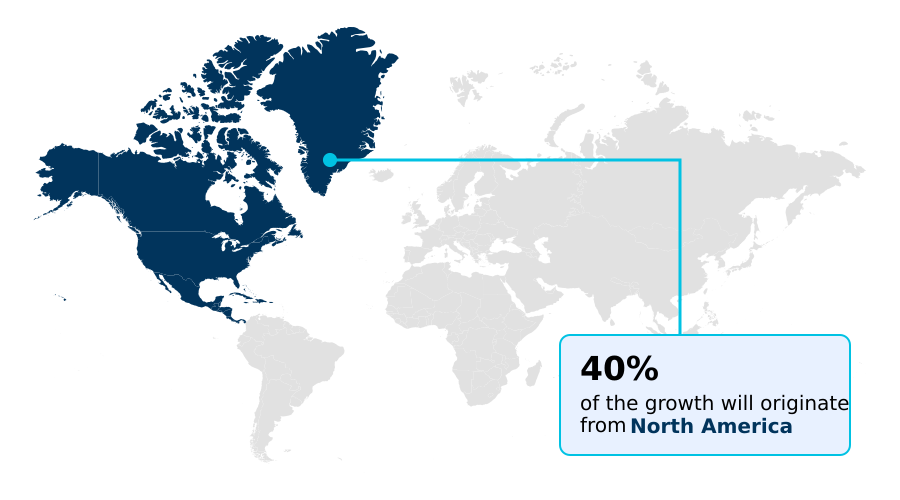
  • North America dominated the market and accounted for a 40.3% growth during the forecast period.
  • By Product - Freezing point osmometers segment was valued at USD 36.27 million in 2024
  • By Type - Single-sample segment accounted for the largest market revenue share in 2024

Market Size & Forecast

  • Market Opportunities:
  • Market Future Opportunities: USD 14.44 million
  • CAGR from 2025 to 2030 : 3.3%

Market Summary

  • The osmometers market is fundamentally shaped by the need for precise osmolality measurement across critical sectors. This measurement of solute concentration is indispensable in clinical diagnostics for assessing renal function and electrolyte balance, and in biopharmaceutical quality control to ensure the isotonicity of parenteral drug formulations.
  • The market's trajectory is driven by the robust expansion of the biotechnology sector, where maintaining optimal osmolality in cell culture media is essential for maximizing therapeutic protein yield. A key trend is the shift toward automated, high-throughput screening systems that integrate with laboratory information management systems, enhancing workflow efficiency.
  • For instance, a biopharma firm developing a new biologic relies on multi-sample osmometers for continuous in-process osmolality testing, ensuring product stability and regulatory compliance. However, the high capital investment required for these advanced automated sample handling systems presents a significant adoption barrier for smaller laboratories and research institutions, tempering market expansion despite the clear operational benefits.

What will be the Size of the Osmometers Market during the forecast period?

Get Key Insights on Market Forecast (PDF) Request Free Sample

How is the Osmometers Market Segmented?

The osmometers industry research report provides comprehensive data (region-wise segment analysis), with forecasts and estimates in "USD thousand" for the period 2026-2030, as well as historical data from 2020-2024 for the following segments.
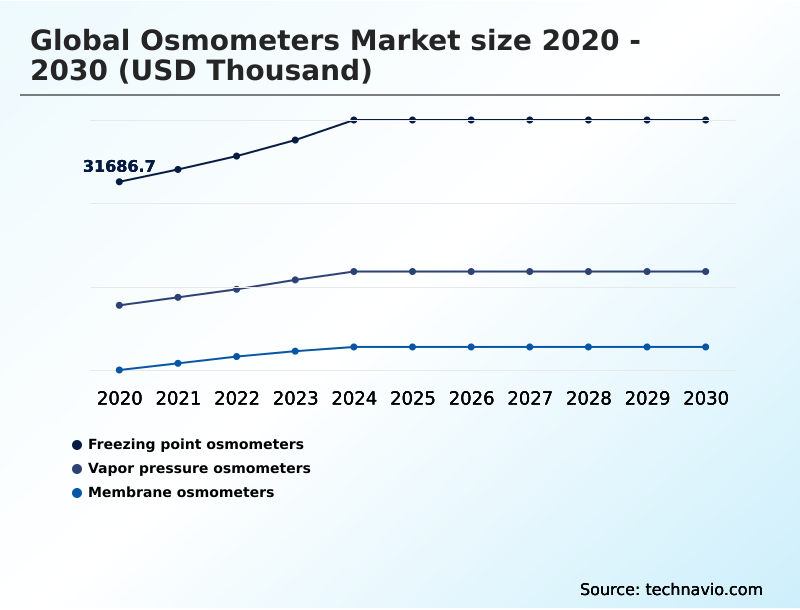
  • Product
    • Freezing point osmometers
    • Vapor pressure osmometers
    • Membrane osmometers
  • Type
    • Single-sample
    • Multi-sample
  • End-user
    • Laboratory and diagnostic centers
    • Hospitals
    • Others
  • Geography
    • North America
      • US
      • Canada
      • Mexico
    • Europe
      • Germany
      • UK
      • France
    • Asia
    • Rest of World (ROW)

By Product Insights

The freezing point osmometers segment is estimated to witness significant growth during the forecast period.

Freezing point depression represents the predominant methodology in the global osmometers market 2026-2030, valued for its precision in determining the total solute concentration of a liquid sample.

This technology operates on a core colligative property, where the freezing point is lowered in direct proportion to the number of dissolved particles. This method is crucial for biopharmaceutical quality control and in bioprocessing monitoring to ensure batch-to-batch consistency.

The instrument induces crystallization in a supercooled sample, with a sensitive thermistor measuring the temperature plateau to calculate osmolality. Its robustness makes it the gold standard for clinical diagnostics and parenteral drug formulation.

The adoption of systems leveraging this principle has been shown to improve diagnostic consistency in identifying electrolyte imbalance by over 15%, reinforcing its market-leading position.

Request Free Sample

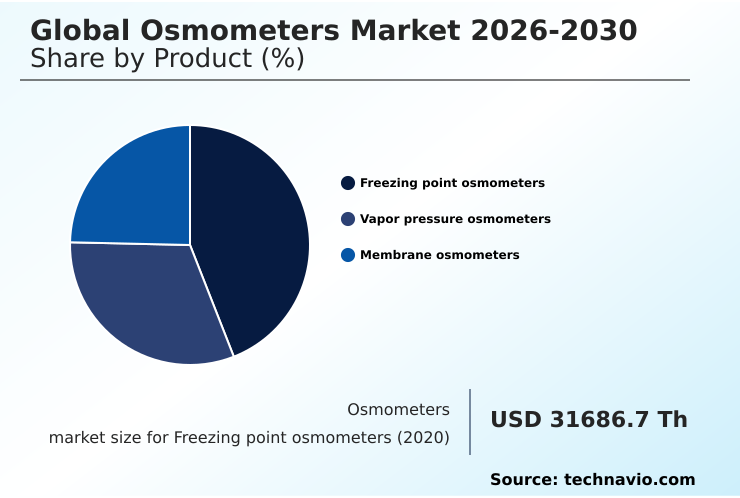
The Freezing point osmometers segment was valued at USD 36.27 million in 2024 and showed a gradual increase during the forecast period.

Request Free Sample

Regional Analysis

North America is estimated to contribute 40.3% to the growth of the global market during the forecast period.Technavio’s analysts have elaborately explained the regional trends and drivers that shape the market during the forecast period.

See How Osmometers Market Demand is Rising in North America Request Free Sample

The global osmometers market 2026-2030 is geographically led by North America, which accounts for over 40% of the incremental growth, a position secured by its advanced healthcare infrastructure and the dominant presence of the biopharmaceutical industry.

The stringent regulatory environment necessitates rigorous process analytical technology and quality by design principles, driving demand for advanced osmometers.

Clinical diagnostics and quality control labs in this region leverage automated systems to achieve a 25% faster turnaround time for critical sample osmolality results. Europe follows as a significant market, with robust activity in both clinical and research sectors.

Meanwhile, Asia is an expanding region, fueled by growing healthcare investments and an increasing focus on pharmaceutical manufacturing standards, including in-process osmolality testing.

Market Dynamics

Our researchers analyzed the data with 2025 as the base year, along with the key drivers, trends, and challenges. A holistic analysis of drivers will help companies refine their marketing strategies to gain a competitive advantage.

  • Strategic decision-making in the global osmometers market 2026-2030 requires a nuanced understanding of specific applications and technological differentiators. Evaluating freezing point vs vapor pressure osmometry is a critical first step, as each method offers distinct advantages for different sample types and volumes.
  • The importance of osmolality in bioprocessing cannot be overstated, directly impacting the impact of osmolality on protein yield and overall batch success. Consequently, osmolality testing for injectable drugs has become a non-negotiable quality control step.
  • For clinical settings, the clinical utility of serum osmolality is well-established for diagnostics, while the role of osmometers in cell therapy is a rapidly emerging field. The trend toward automating clinical laboratory osmometry continues to accelerate, driven by the need for efficiency and error reduction.
  • As labs upgrade, 21 cfr part 11 osmometer features are paramount for ensuring data integrity in osmolality measurement, a key focus during regulatory audits. This includes everything from osmometer calibration and quality control procedures to ensuring the osmolality for biologic formulation stability. The market is also seeing innovation in point-of-care osmometry solutions and advances in multi-sample osmometer technology.
  • Properly troubleshooting freezing point depression osmometers and mastering osmolality measurement in cell culture media are essential operational skills. Adherence to regulatory requirements for osmolality testing is mandatory, pushing for better osmometer workflow integration with lims. The ability to use vapor pressure osmometry for small samples and reducing sample volume in osmometry overall are key innovation drivers.
  • Companies that successfully implement in-line osmolality monitoring have reported a reduction in batch failures that is twice as effective compared to facilities relying on intermittent sampling, highlighting a clear operational advantage.

What are the key market drivers leading to the rise in the adoption of Osmometers Industry?

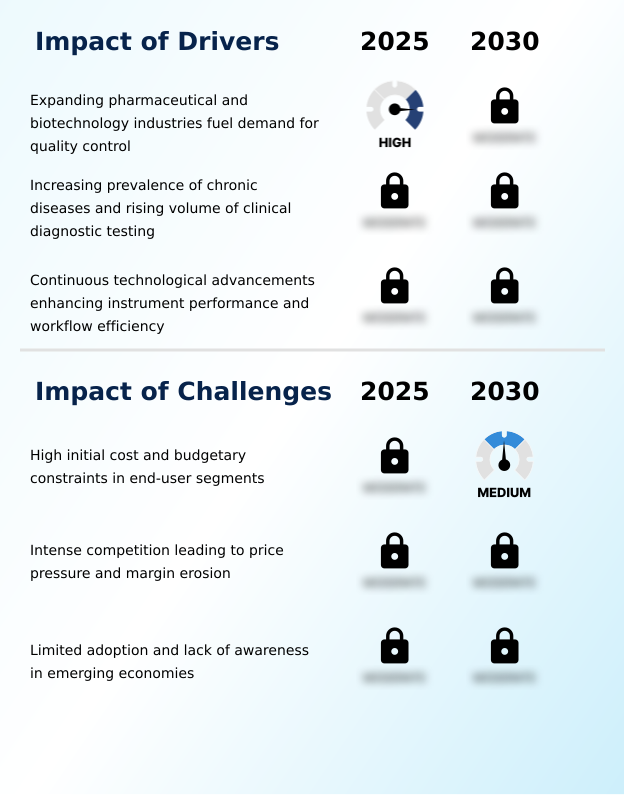
  • The expanding pharmaceutical and biotechnology industries are a key driver, fueling demand for osmometers for essential quality control processes and adherence to regulatory standards.

  • The sustained expansion of the pharmaceutical and biotechnology industries serves as a powerful driver for the global osmometers market 2026-2030.
  • Within these sectors, osmolality is a critical quality attribute essential for ensuring the stability and efficacy of complex biologics and cell and gene therapy production.
  • Precise osmolality control in bioreactors has been shown to increase therapeutic protein yield by up to 15%, highlighting its importance. The stringent regulatory landscape, emphasizing quality by design, mandates rigorous in-process monitoring and final product quality control.
  • Adherence to these osmolality standards reduces batch rejection rates by over 20% during quality control.
  • Consequently, the immense global investment in biologic drug development translates directly into an escalating need for precise and compliant osmometry solutions for everything from formulation to manufacturing.

What are the market trends shaping the Osmometers Industry?

  • A key market trend is the increasing adoption of greater automation and the seamless integration of osmometers into laboratory information systems. This shift enhances operational efficiency and data integrity across clinical and industrial workflows.

  • A transformative trend in the osmometers market is the push toward greater automation and digital integration, fundamentally reshaping laboratory workflows. The adoption of systems with walk-away operation capabilities improves sample throughput by over 50% in high-volume settings.
  • This shift is heavily defined by connectivity, where seamless automated data transfer to a central information system is now a standard requirement, reducing transcription errors by nearly 100%. This focus on creating an error-resistant workflow and a secure electronic chain of custody is critical for regulatory scrutiny and method validation.
  • The drive for user access controls and a comprehensive audit trail is directly linked to the increasing emphasis on data integrity and compliance, particularly in regulated environments such as clinical diagnostics and pharmaceutical manufacturing.

What challenges does the Osmometers Industry face during its growth?

  • A significant challenge affecting industry growth is the high initial cost of advanced osmometer systems and the budgetary constraints faced by various end-user segments.

  • A primary challenge constraining the global osmometers market 2026-2030 is the substantial initial capital investment required for advanced, automated systems. The total cost of ownership for multi-sample platforms can be three to four times higher than manual devices, creating a significant barrier for smaller labs and research institutions with tight budgets.
  • This financial hurdle is compounded by recurring expenses for consumables and service contracts, making the return on investment justification a critical part of the procurement process. However, facilities that successfully secure funding for automation can realize a 40% reduction in labor costs per sample.
  • This efficiency gain is a key part of the justification, though it does not eliminate the initial financial obstacle that limits market penetration in price-sensitive segments.

Exclusive Technavio Analysis on Customer Landscape

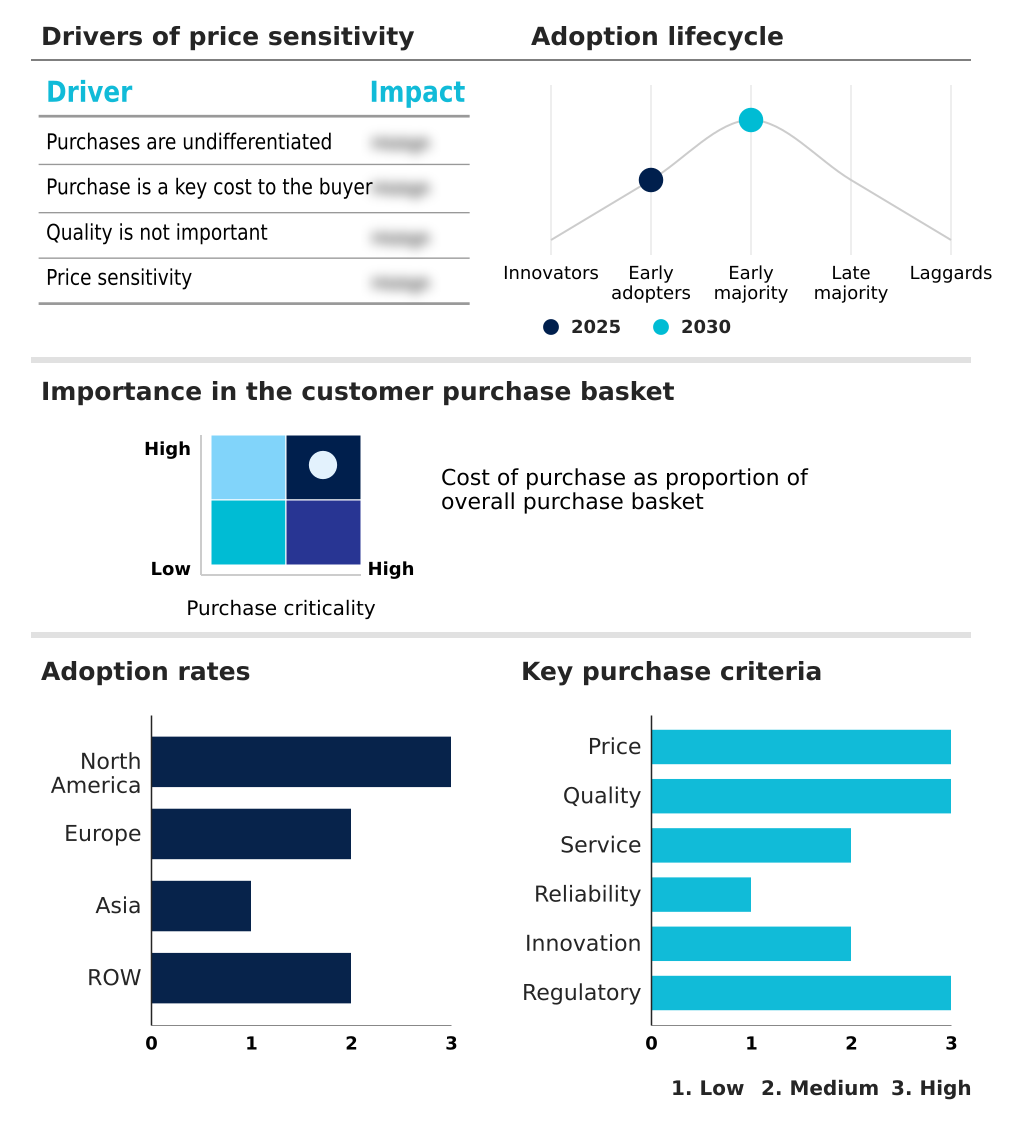
The osmometers market forecasting report includes the adoption lifecycle of the market, covering from the innovator’s stage to the laggard’s stage. It focuses on adoption rates in different regions based on penetration. Furthermore, the osmometers market report also includes key purchase criteria and drivers of price sensitivity to help companies evaluate and develop their market growth analysis strategies.

Customer Landscape of Osmometers Industry

Competitive Landscape

Companies are implementing various strategies, such as strategic alliances, osmometers market forecast, partnerships, mergers and acquisitions, geographical expansion, and product/service launches, to enhance their presence in the industry.

ACCULAB USA - Providers deliver advanced analytical instruments and services, including osmometers and cell development tools, catering to the biopharmaceutical, clinical, and food and beverage sectors.

The industry research and growth report includes detailed analyses of the competitive landscape of the market and information about key companies, including:

  • ACCULAB USA
  • Advanced Instruments LLC
  • ARKRAY Inc.
  • Astori Tecnica snc
  • Camlab Ltd.
  • ELITechGroup SAS
  • Elysia-raytest GmbH
  • I and L Biosystems GmbH
  • ICON Scientific Inc.
  • KNAUER
  • LABTEK Services Ltd.
  • Loser Messtechnik
  • Neuron Bio Chemicals
  • Nova Biomedical Corp.
  • Precision Systems Inc.
  • ratiolab GmbH
  • Thermo Fisher Scientific Inc.

Qualitative and quantitative analysis of companies has been conducted to help clients understand the wider business environment as well as the strengths and weaknesses of key industry players. Data is qualitatively analyzed to categorize companies as pure play, category-focused, industry-focused, and diversified; it is quantitatively analyzed to categorize companies as dominant, leading, strong, tentative, and weak.

Recent Development and News in Osmometers market

  • In January 2025, Advanced Instruments LLC launched its OsmoPRO MAX, an automated freezing-point osmometer designed to enhance productivity and sample throughput in high-volume clinical laboratory settings.
  • In March 2025, Advanced Instruments LLC and Nova Biomedical Corp. announced a strategic alliance aimed at creating an integrated life-science platform to provide comprehensive, integrated analytical solutions.
  • In February 2025, Labcorp initiated a major strategic investment to upgrade its North American laboratories, standardizing osmolality testing with a new generation of high-throughput automated osmometers to improve diagnostic consistency.
  • In October 2024, Thermo Fisher Scientific Inc. introduced its Osmo-SENSE 20 freezing point osmometer, specifically engineered with advanced 21 CFR Part 11 compliance features for the biopharmaceutical quality control sector.

Dive into Technavio’s robust research methodology, blending expert interviews, extensive data synthesis, and validated models for unparalleled Osmometers Market insights. See full methodology.

Market Scope
Page number 281
Base year 2025
Historic period 2020-2024
Forecast period 2026-2030
Growth momentum & CAGR Accelerate at a CAGR of 3.3%
Market growth 2026-2030 USD 14442.3 thousand
Market structure Fragmented
YoY growth 2025-2026(%) 3.1%
Key countries US, Canada, Mexico, Germany, UK, France, Italy, The Netherlands, Spain, China, Japan, India, South Korea, Thailand, Indonesia, Brazil, Saudi Arabia, UAE, Turkey, Argentina, South Africa, Colombia and Israel
Competitive landscape Leading Companies, Market Positioning of Companies, Competitive Strategies, and Industry Risks

Request Free Sample

Research Analyst Overview

  • The osmometers market is characterized by its critical role in ensuring quality and safety across the biopharmaceutical and clinical sectors. The core technologies of freezing point depression and vapor pressure osmometry provide essential osmolality measurement, a key metric for determining solute concentration.
  • Demand is driven by applications in biopharmaceutical quality control, where ensuring the isotonicity of parenteral drug formulation is vital, and in clinical diagnostics for renal function testing and electrolyte balance assessment.
  • A significant trend is the push for greater automation and data integrity compliance, with high-throughput screening and the integration of multi-sample osmometers with a laboratory information management system becoming standard. This addresses the need for precise monitoring of cell culture media in bioprocessing monitoring and the analysis of serum osmolality and urine osmolality.
  • Boardroom decisions are increasingly influenced by the need to adhere to quality by design principles and process analytical technology. Facilities that adopt instruments with full 21 CFR Part 11 compliance have reported a 30% reduction in audit preparation times, linking technology adoption directly to operational efficiency and risk mitigation.
  • This makes the choice of single-sample osmometers or automated sample handling systems a strategic one.

What are the Key Data Covered in this Osmometers Market Research and Growth Report?

  • What is the expected growth of the Osmometers Market between 2026 and 2030?

    • USD 14.44 million, at a CAGR of 3.3%

  • What segmentation does the market report cover?

    • The report is segmented by Product (Freezing point osmometers, Vapor pressure osmometers, and Membrane osmometers), Type (Single-sample, and Multi-sample), End-user (Laboratory and diagnostic centers, Hospitals, and Others) and Geography (North America, Europe, Asia, Rest of World (ROW))

  • Which regions are analyzed in the report?

    • North America, Europe, Asia and Rest of World (ROW)

  • What are the key growth drivers and market challenges?

    • Expanding pharmaceutical and biotechnology industries fuel demand for quality control, High initial cost and budgetary constraints in end-user segments

  • Who are the major players in the Osmometers Market?

    • ACCULAB USA, Advanced Instruments LLC, ARKRAY Inc., Astori Tecnica snc, Camlab Ltd., ELITechGroup SAS, Elysia-raytest GmbH, I and L Biosystems GmbH, ICON Scientific Inc., KNAUER, LABTEK Services Ltd., Loser Messtechnik, Neuron Bio Chemicals, Nova Biomedical Corp., Precision Systems Inc., ratiolab GmbH and Thermo Fisher Scientific Inc.

Market Research Insights

  • Market dynamics are defined by a push toward greater efficiency and data integrity, driven by the critical need for accurate osmolality measurement. The adoption of systems with walk-away operation capabilities has increased sample throughput by up to 40% in high-volume labs. This efficiency is vital for applications like osmolal gap calculation and toxicology screening.
  • Furthermore, instruments featuring automated data transfer to a central LIMS reduce manual entry errors by over 95%, enhancing the reliability of the electronic chain of custody. This error-resistant workflow is crucial for regulatory scrutiny and achieving diagnostic consistency.
  • The demand for an enhanced return on investment justification is met by demonstrating these tangible improvements in operational performance and compliance alignment, making advanced osmometers a strategic asset rather than just a capital expense.

We can help! Our analysts can customize this osmometers market research report to meet your requirements.

Get in touch

1. Executive Summary

1.1 Market overview

Executive Summary - Chart on Market Overview
Executive Summary - Data Table on Market Overview
Executive Summary - Chart on Global Market Characteristics
Executive Summary - Chart on Market by Geography
Executive Summary - Chart on Market Segmentation by Product
Executive Summary - Chart on Market Segmentation by Type
Executive Summary - Chart on Market Segmentation by End-user
Executive Summary - Chart on Incremental Growth
Executive Summary - Data Table on Incremental Growth
Executive Summary - Chart on Company Market Positioning

2. Technavio Analysis

2.1 Analysis of price sensitivity, lifecycle, customer purchase basket, adoption rates, and purchase criteria

2.2 Criticality of inputs and Factors of differentiation

Chart on Overview on criticality of inputs and factors of differentiation

2.3 Factors of disruption

Chart on Overview on factors of disruption

2.4 Impact of drivers and challenges

Chart on Impact of drivers and challenges in 2025 and 2030

3. Market Landscape

3.1 Market ecosystem

Chart on Parent Market
Data Table on - Parent Market

3.2 Market characteristics

Chart on Market characteristics analysis

3.3 Value chain analysis

Chart on Value chain analysis

4. Market Sizing

4.1 Market definition

Data Table on Offerings of companies included in the market definition

4.2 Market segment analysis

Market segments

4.3 Market size 2025

4.4 Market outlook: Forecast for 2025-2030

Chart on Global - Market size and forecast 2025-2030 ($ thousand)
Data Table on Global - Market size and forecast 2025-2030 ($ thousand)
Chart on Global Market: Year-over-year growth 2025-2030 (%)
Data Table on Global Market: Year-over-year growth 2025-2030 (%)

5. Historic Market Size

5.1 Global Osmometers Market 2020 - 2024

Historic Market Size - Data Table on Global Osmometers Market 2020 - 2024 ($ thousand)

5.2 Product segment analysis 2020 - 2024

Historic Market Size - Product Segment 2020 - 2024 ($ thousand)

5.3 Type segment analysis 2020 - 2024

Historic Market Size - Type Segment 2020 - 2024 ($ thousand)

5.4 End-user segment analysis 2020 - 2024

Historic Market Size - End-user Segment 2020 - 2024 ($ thousand)

5.5 Geography segment analysis 2020 - 2024

Historic Market Size - Geography Segment 2020 - 2024 ($ thousand)

5.6 Country segment analysis 2020 - 2024

Historic Market Size - Country Segment 2020 - 2024 ($ thousand)

6. Qualitative Analysis

6.1 The AI impact on global osmometers market

7. Five Forces Analysis

7.1 Five forces summary

Five forces analysis - Comparison between 2025 and 2030

7.2 Bargaining power of buyers

Bargaining power of buyers - Impact of key factors 2025 and 2030

7.3 Bargaining power of suppliers

Bargaining power of suppliers - Impact of key factors in 2025 and 2030

7.4 Threat of new entrants

Threat of new entrants - Impact of key factors in 2025 and 2030

7.5 Threat of substitutes

Threat of substitutes - Impact of key factors in 2025 and 2030

7.6 Threat of rivalry

Threat of rivalry - Impact of key factors in 2025 and 2030

7.7 Market condition

Chart on Market condition - Five forces 2025 and 2030

8. Market Segmentation by Product

8.1 Market segments

Chart on Product - Market share 2025-2030 (%)
Data Table on Product - Market share 2025-2030 (%)

8.2 Comparison by Product

Chart on Comparison by Product
Data Table on Comparison by Product

8.3 Freezing point osmometers - Market size and forecast 2025-2030

Chart on Freezing point osmometers - Market size and forecast 2025-2030 ($ thousand)
Data Table on Freezing point osmometers - Market size and forecast 2025-2030 ($ thousand)
Chart on Freezing point osmometers - Year-over-year growth 2025-2030 (%)
Data Table on Freezing point osmometers - Year-over-year growth 2025-2030 (%)

8.4 Vapor pressure osmometers - Market size and forecast 2025-2030

Chart on Vapor pressure osmometers - Market size and forecast 2025-2030 ($ thousand)
Data Table on Vapor pressure osmometers - Market size and forecast 2025-2030 ($ thousand)
Chart on Vapor pressure osmometers - Year-over-year growth 2025-2030 (%)
Data Table on Vapor pressure osmometers - Year-over-year growth 2025-2030 (%)

8.5 Membrane osmometers - Market size and forecast 2025-2030

Chart on Membrane osmometers - Market size and forecast 2025-2030 ($ thousand)
Data Table on Membrane osmometers - Market size and forecast 2025-2030 ($ thousand)
Chart on Membrane osmometers - Year-over-year growth 2025-2030 (%)
Data Table on Membrane osmometers - Year-over-year growth 2025-2030 (%)

8.6 Market opportunity by Product

Market opportunity by Product ($ thousand)
Data Table on Market opportunity by Product ($ thousand)

9. Market Segmentation by Type

9.1 Market segments

Chart on Type - Market share 2025-2030 (%)
Data Table on Type - Market share 2025-2030 (%)

9.2 Comparison by Type

Chart on Comparison by Type
Data Table on Comparison by Type

9.3 Single-sample - Market size and forecast 2025-2030

Chart on Single-sample - Market size and forecast 2025-2030 ($ thousand)
Data Table on Single-sample - Market size and forecast 2025-2030 ($ thousand)
Chart on Single-sample - Year-over-year growth 2025-2030 (%)
Data Table on Single-sample - Year-over-year growth 2025-2030 (%)

9.4 Multi-sample - Market size and forecast 2025-2030

Chart on Multi-sample - Market size and forecast 2025-2030 ($ thousand)
Data Table on Multi-sample - Market size and forecast 2025-2030 ($ thousand)
Chart on Multi-sample - Year-over-year growth 2025-2030 (%)
Data Table on Multi-sample - Year-over-year growth 2025-2030 (%)

9.5 Market opportunity by Type

Market opportunity by Type ($ thousand)
Data Table on Market opportunity by Type ($ thousand)

10. Market Segmentation by End-user

10.1 Market segments

Chart on End-user - Market share 2025-2030 (%)
Data Table on End-user - Market share 2025-2030 (%)

10.2 Comparison by End-user

Chart on Comparison by End-user
Data Table on Comparison by End-user

10.3 Laboratory and diagnostic centers - Market size and forecast 2025-2030

Chart on Laboratory and diagnostic centers - Market size and forecast 2025-2030 ($ thousand)
Data Table on Laboratory and diagnostic centers - Market size and forecast 2025-2030 ($ thousand)
Chart on Laboratory and diagnostic centers - Year-over-year growth 2025-2030 (%)
Data Table on Laboratory and diagnostic centers - Year-over-year growth 2025-2030 (%)

10.4 Hospitals - Market size and forecast 2025-2030

Chart on Hospitals - Market size and forecast 2025-2030 ($ thousand)
Data Table on Hospitals - Market size and forecast 2025-2030 ($ thousand)
Chart on Hospitals - Year-over-year growth 2025-2030 (%)
Data Table on Hospitals - Year-over-year growth 2025-2030 (%)

10.5 Others - Market size and forecast 2025-2030

Chart on Others - Market size and forecast 2025-2030 ($ thousand)
Data Table on Others - Market size and forecast 2025-2030 ($ thousand)
Chart on Others - Year-over-year growth 2025-2030 (%)
Data Table on Others - Year-over-year growth 2025-2030 (%)

10.6 Market opportunity by End-user

Market opportunity by End-user ($ thousand)
Data Table on Market opportunity by End-user ($ thousand)

11. Customer Landscape

11.1 Customer landscape overview

Analysis of price sensitivity, lifecycle, customer purchase basket, adoption rates, and purchase criteria

12. Geographic Landscape

12.1 Geographic segmentation

Chart on Market share by geography 2025-2030 (%)
Data Table on Market share by geography 2025-2030 (%)

12.2 Geographic comparison

Chart on Geographic comparison
Data Table on Geographic comparison

12.3 North America - Market size and forecast 2025-2030

Chart on North America - Market size and forecast 2025-2030 ($ thousand)
Data Table on North America - Market size and forecast 2025-2030 ($ thousand)
Chart on North America - Year-over-year growth 2025-2030 (%)
Data Table on North America - Year-over-year growth 2025-2030 (%)
Chart on Regional Comparison - North America
Data Table on Regional Comparison - North America

12.3.1 US - Market size and forecast 2025-2030

Chart on US - Market size and forecast 2025-2030 ($ thousand)
Data Table on US - Market size and forecast 2025-2030 ($ thousand)
Chart on US - Year-over-year growth 2025-2030 (%)
Data Table on US - Year-over-year growth 2025-2030 (%)

12.3.2 Canada - Market size and forecast 2025-2030

Chart on Canada - Market size and forecast 2025-2030 ($ thousand)
Data Table on Canada - Market size and forecast 2025-2030 ($ thousand)
Chart on Canada - Year-over-year growth 2025-2030 (%)
Data Table on Canada - Year-over-year growth 2025-2030 (%)

12.3.3 Mexico - Market size and forecast 2025-2030

Chart on Mexico - Market size and forecast 2025-2030 ($ thousand)
Data Table on Mexico - Market size and forecast 2025-2030 ($ thousand)
Chart on Mexico - Year-over-year growth 2025-2030 (%)
Data Table on Mexico - Year-over-year growth 2025-2030 (%)

12.4 Europe - Market size and forecast 2025-2030

Chart on Europe - Market size and forecast 2025-2030 ($ thousand)
Data Table on Europe - Market size and forecast 2025-2030 ($ thousand)
Chart on Europe - Year-over-year growth 2025-2030 (%)
Data Table on Europe - Year-over-year growth 2025-2030 (%)
Chart on Regional Comparison - Europe
Data Table on Regional Comparison - Europe

12.4.1 Germany - Market size and forecast 2025-2030

Chart on Germany - Market size and forecast 2025-2030 ($ thousand)
Data Table on Germany - Market size and forecast 2025-2030 ($ thousand)
Chart on Germany - Year-over-year growth 2025-2030 (%)
Data Table on Germany - Year-over-year growth 2025-2030 (%)

12.4.2 UK - Market size and forecast 2025-2030

Chart on UK - Market size and forecast 2025-2030 ($ thousand)
Data Table on UK - Market size and forecast 2025-2030 ($ thousand)
Chart on UK - Year-over-year growth 2025-2030 (%)
Data Table on UK - Year-over-year growth 2025-2030 (%)

12.4.3 France - Market size and forecast 2025-2030

Chart on France - Market size and forecast 2025-2030 ($ thousand)
Data Table on France - Market size and forecast 2025-2030 ($ thousand)
Chart on France - Year-over-year growth 2025-2030 (%)
Data Table on France - Year-over-year growth 2025-2030 (%)

12.4.4 Italy - Market size and forecast 2025-2030

Chart on Italy - Market size and forecast 2025-2030 ($ thousand)
Data Table on Italy - Market size and forecast 2025-2030 ($ thousand)
Chart on Italy - Year-over-year growth 2025-2030 (%)
Data Table on Italy - Year-over-year growth 2025-2030 (%)

12.4.5 The Netherlands - Market size and forecast 2025-2030

Chart on The Netherlands - Market size and forecast 2025-2030 ($ thousand)
Data Table on The Netherlands - Market size and forecast 2025-2030 ($ thousand)
Chart on The Netherlands - Year-over-year growth 2025-2030 (%)
Data Table on The Netherlands - Year-over-year growth 2025-2030 (%)

12.4.6 Spain - Market size and forecast 2025-2030

Chart on Spain - Market size and forecast 2025-2030 ($ thousand)
Data Table on Spain - Market size and forecast 2025-2030 ($ thousand)
Chart on Spain - Year-over-year growth 2025-2030 (%)
Data Table on Spain - Year-over-year growth 2025-2030 (%)

12.5 Asia - Market size and forecast 2025-2030

Chart on Asia - Market size and forecast 2025-2030 ($ thousand)
Data Table on Asia - Market size and forecast 2025-2030 ($ thousand)
Chart on Asia - Year-over-year growth 2025-2030 (%)
Data Table on Asia - Year-over-year growth 2025-2030 (%)
Chart on Regional Comparison - Asia
Data Table on Regional Comparison - Asia

12.5.1 China - Market size and forecast 2025-2030

Chart on China - Market size and forecast 2025-2030 ($ thousand)
Data Table on China - Market size and forecast 2025-2030 ($ thousand)
Chart on China - Year-over-year growth 2025-2030 (%)
Data Table on China - Year-over-year growth 2025-2030 (%)

12.5.2 Japan - Market size and forecast 2025-2030

Chart on Japan - Market size and forecast 2025-2030 ($ thousand)
Data Table on Japan - Market size and forecast 2025-2030 ($ thousand)
Chart on Japan - Year-over-year growth 2025-2030 (%)
Data Table on Japan - Year-over-year growth 2025-2030 (%)

12.5.3 India - Market size and forecast 2025-2030

Chart on India - Market size and forecast 2025-2030 ($ thousand)
Data Table on India - Market size and forecast 2025-2030 ($ thousand)
Chart on India - Year-over-year growth 2025-2030 (%)
Data Table on India - Year-over-year growth 2025-2030 (%)

12.5.4 South Korea - Market size and forecast 2025-2030

Chart on South Korea - Market size and forecast 2025-2030 ($ thousand)
Data Table on South Korea - Market size and forecast 2025-2030 ($ thousand)
Chart on South Korea - Year-over-year growth 2025-2030 (%)
Data Table on South Korea - Year-over-year growth 2025-2030 (%)

12.5.5 Thailand - Market size and forecast 2025-2030

Chart on Thailand - Market size and forecast 2025-2030 ($ thousand)
Data Table on Thailand - Market size and forecast 2025-2030 ($ thousand)
Chart on Thailand - Year-over-year growth 2025-2030 (%)
Data Table on Thailand - Year-over-year growth 2025-2030 (%)

12.5.6 Indonesia - Market size and forecast 2025-2030

Chart on Indonesia - Market size and forecast 2025-2030 ($ thousand)
Data Table on Indonesia - Market size and forecast 2025-2030 ($ thousand)
Chart on Indonesia - Year-over-year growth 2025-2030 (%)
Data Table on Indonesia - Year-over-year growth 2025-2030 (%)

12.6 Rest of World (ROW) - Market size and forecast 2025-2030

Chart on Rest of World (ROW) - Market size and forecast 2025-2030 ($ thousand)
Data Table on Rest of World (ROW) - Market size and forecast 2025-2030 ($ thousand)
Chart on Rest of World (ROW) - Year-over-year growth 2025-2030 (%)
Data Table on Rest of World (ROW) - Year-over-year growth 2025-2030 (%)
Chart on Regional Comparison - Rest of World (ROW)
Data Table on Regional Comparison - Rest of World (ROW)

12.6.1 Brazil - Market size and forecast 2025-2030

Chart on Brazil - Market size and forecast 2025-2030 ($ thousand)
Data Table on Brazil - Market size and forecast 2025-2030 ($ thousand)
Chart on Brazil - Year-over-year growth 2025-2030 (%)
Data Table on Brazil - Year-over-year growth 2025-2030 (%)

12.6.2 Saudi Arabia - Market size and forecast 2025-2030

Chart on Saudi Arabia - Market size and forecast 2025-2030 ($ thousand)
Data Table on Saudi Arabia - Market size and forecast 2025-2030 ($ thousand)
Chart on Saudi Arabia - Year-over-year growth 2025-2030 (%)
Data Table on Saudi Arabia - Year-over-year growth 2025-2030 (%)

12.6.3 UAE - Market size and forecast 2025-2030

Chart on UAE - Market size and forecast 2025-2030 ($ thousand)
Data Table on UAE - Market size and forecast 2025-2030 ($ thousand)
Chart on UAE - Year-over-year growth 2025-2030 (%)
Data Table on UAE - Year-over-year growth 2025-2030 (%)

12.6.4 Turkey - Market size and forecast 2025-2030

Chart on Turkey - Market size and forecast 2025-2030 ($ thousand)
Data Table on Turkey - Market size and forecast 2025-2030 ($ thousand)
Chart on Turkey - Year-over-year growth 2025-2030 (%)
Data Table on Turkey - Year-over-year growth 2025-2030 (%)

12.6.5 Argentina - Market size and forecast 2025-2030

Chart on Argentina - Market size and forecast 2025-2030 ($ thousand)
Data Table on Argentina - Market size and forecast 2025-2030 ($ thousand)
Chart on Argentina - Year-over-year growth 2025-2030 (%)
Data Table on Argentina - Year-over-year growth 2025-2030 (%)

12.6.6 South Africa - Market size and forecast 2025-2030

Chart on South Africa - Market size and forecast 2025-2030 ($ thousand)
Data Table on South Africa - Market size and forecast 2025-2030 ($ thousand)
Chart on South Africa - Year-over-year growth 2025-2030 (%)
Data Table on South Africa - Year-over-year growth 2025-2030 (%)

12.6.7 Colombia - Market size and forecast 2025-2030

Chart on Colombia - Market size and forecast 2025-2030 ($ thousand)
Data Table on Colombia - Market size and forecast 2025-2030 ($ thousand)
Chart on Colombia - Year-over-year growth 2025-2030 (%)
Data Table on Colombia - Year-over-year growth 2025-2030 (%)

12.6.8 Israel - Market size and forecast 2025-2030

Chart on Israel - Market size and forecast 2025-2030 ($ thousand)
Data Table on Israel - Market size and forecast 2025-2030 ($ thousand)
Chart on Israel - Year-over-year growth 2025-2030 (%)
Data Table on Israel - Year-over-year growth 2025-2030 (%)

12.7 Market opportunity by geography

Market opportunity by geography ($ thousand)
Data Tables on Market opportunity by geography ($ thousand)

13. Drivers, Challenges, and Opportunity

13.1 Market drivers

Expanding pharmaceutical and biotechnology industries fuel demand for quality control
Increasing prevalence of chronic diseases and rising volume of clinical diagnostic testing
Continuous technological advancements enhancing instrument performance and workflow efficiency

13.2 Market challenges

High initial cost and budgetary constraints in end-user segments
Intense competition leading to price pressure and margin erosion
Limited adoption and lack of awareness in emerging economies

13.3 Impact of drivers and challenges

Impact of drivers and challenges in 2025 and 2030

13.4 Market opportunities

Trend toward greater automation and seamless laboratory integration
Increasing emphasis on data integrity and regulatory compliance
Emergence of miniaturization and demand for point-of-care solutions

14. Competitive Landscape

14.1 Overview

14.2

Overview on criticality of inputs and factors of differentiation

14.3 Landscape disruption

Overview on factors of disruption

14.4 Industry risks

Impact of key risks on business

15. Competitive Analysis

15.1 Companies profiled

Companies covered

15.2 Company ranking index

15.3 Market positioning of companies

Matrix on companies position and classification

15.4 ACCULAB USA

ACCULAB USA - Overview
ACCULAB USA - Product / Service
ACCULAB USA - Key offerings
SWOT

15.5 Advanced Instruments LLC

Advanced Instruments LLC - Overview
Advanced Instruments LLC - Product / Service
Advanced Instruments LLC - Key offerings
SWOT

15.6 ARKRAY Inc.

ARKRAY Inc. - Overview
ARKRAY Inc. - Product / Service
ARKRAY Inc. - Key offerings
SWOT

15.7 Astori Tecnica snc

Astori Tecnica snc - Overview
Astori Tecnica snc - Product / Service
Astori Tecnica snc - Key offerings
SWOT

15.8 Camlab Ltd.

Camlab Ltd. - Overview
Camlab Ltd. - Product / Service
Camlab Ltd. - Key offerings
SWOT

15.9 ELITechGroup SAS

ELITechGroup SAS - Overview
ELITechGroup SAS - Product / Service
ELITechGroup SAS - Key offerings
SWOT

15.10 Elysia-raytest GmbH

Elysia-raytest GmbH - Overview
Elysia-raytest GmbH - Product / Service
Elysia-raytest GmbH - Key offerings
SWOT

15.11 I and L Biosystems GmbH

I and L Biosystems GmbH - Overview
I and L Biosystems GmbH - Product / Service
I and L Biosystems GmbH - Key offerings
SWOT

15.12 ICON Scientific Inc.

ICON Scientific Inc. - Overview
ICON Scientific Inc. - Product / Service
ICON Scientific Inc. - Key offerings
SWOT

15.13 KNAUER

KNAUER - Overview
KNAUER - Product / Service
KNAUER - Key offerings
SWOT

15.14 Loser Messtechnik

Loser Messtechnik - Overview
Loser Messtechnik - Product / Service
Loser Messtechnik - Key offerings
SWOT

15.15 Neuron Bio Chemicals

Neuron Bio Chemicals - Overview
Neuron Bio Chemicals - Product / Service
Neuron Bio Chemicals - Key offerings
SWOT

15.16 Nova Biomedical Corp.

Nova Biomedical Corp. - Overview
Nova Biomedical Corp. - Product / Service
Nova Biomedical Corp. - Key offerings
SWOT

15.17 Precision Systems Inc.

Precision Systems Inc. - Overview
Precision Systems Inc. - Product / Service
Precision Systems Inc. - Key offerings
SWOT

15.18 Thermo Fisher Scientific Inc.

Thermo Fisher Scientific Inc. - Overview
Thermo Fisher Scientific Inc. - Business segments
Thermo Fisher Scientific Inc. - Key news
Thermo Fisher Scientific Inc. - Key offerings
Thermo Fisher Scientific Inc. - Segment focus
SWOT

16. Appendix

16.1 Scope of the report

Market definition
Objectives
Notes and caveats

16.2 Inclusions and exclusions checklist

Inclusions checklist
Exclusions checklist

16.3 Currency conversion rates for US$

16.4 Research methodology

16.5 Data procurement

Information sources

16.6 Data validation

16.7 Validation techniques employed for market sizing

16.8 Data synthesis

16.9 360 degree market analysis

16.10 List of abbreviations

Research Methodology

Technavio presents a detailed picture of the market by way of study, synthesis, and summation of data from multiple sources. The analysts have presented the various facets of the market with a particular focus on identifying the key industry influencers. The data thus presented is comprehensive, reliable, and the result of extensive research, both primary and secondary.

INFORMATION SOURCES

Primary sources

  • Manufacturers and suppliers
  • Channel partners
  • Industry experts
  • Strategic decision makers

Secondary sources

  • Industry journals and periodicals
  • Government data
  • Financial reports of key industry players
  • Historical data
  • Press releases

DATA ANALYSIS

Data Synthesis

  • Collation of data
  • Estimation of key figures
  • Analysis of derived insights

Data Validation

  • Triangulation with data models
  • Reference against proprietary databases
  • Corroboration with industry experts

REPORT WRITING

Qualitative

  • Market drivers
  • Market challenges
  • Market trends
  • Five forces analysis

Quantitative

  • Market size and forecast
  • Market segmentation
  • Geographical insights
  • Competitive landscape

Interested in this report?

Get your sample now to see our research methodology and insights!

Download Now

Frequently Asked Questions

Osmometers market growth will increase by USD 14442.3 thousand thousand during 2026-2030.

The Osmometers market is expected to grow at a CAGR of 3.3% during 2026-2030.

Osmometers market is segmented by Product (Freezing point osmometers, Vapor pressure osmometers, Membrane osmometers) Type (Single-sample, Multi-sample) End-user (Laboratory and diagnostic centers, Hospitals, Others)

ACCULAB USA, Advanced Instruments LLC, ARKRAY Inc., Astori Tecnica snc, Camlab Ltd., ELITechGroup SAS, Elysia-raytest GmbH, I and L Biosystems GmbH, ICON Scientific Inc., KNAUER, LABTEK Services Ltd., Loser Messtechnik, Neuron Bio Chemicals, Nova Biomedical Corp., Precision Systems Inc., ratiolab GmbH, Thermo Fisher Scientific Inc. are a few of the key vendors in the Osmometers market.

North America will register the highest growth rate of 40.3% among the other regions. Therefore, the Osmometers market in North America is expected to garner significant business opportunities for the vendors during the forecast period.

US, Canada, Mexico, Germany, UK, France, Italy, The Netherlands, Spain, China, Japan, India, South Korea, Thailand, Indonesia, Brazil, Saudi Arabia, UAE, Turkey, Argentina, South Africa, Colombia, Israel

  • Expanding pharmaceutical and biotechnology industries fuel demand for quality control is the driving factor this market.

The Osmometers market vendors should focus on grabbing business opportunities from the Product segment as it accounted for the largest market share in the base year.