Online Movie Market Analysis, Size, and Forecast 2026-2030: North America (US, Canada, and Mexico), APAC (China, India, and Japan), Europe (UK, Germany, and France), South America (Brazil, Argentina, and Colombia), Middle East and Africa (UAE, Saudi Arabia, and South Africa), and Rest of World (ROW)

Online Movie Market Analysis, Size, and Forecast 2026-2030:
North America (US, Canada, and Mexico), APAC (China, India, and Japan), Europe (UK, Germany, and France), South America (Brazil, Argentina, and Colombia), Middle East and Africa (UAE, Saudi Arabia, and South Africa), and Rest of World (ROW)

Published: Apr 2026 305 Pages SKU: IRTNTR71520

Market Overview at a Glance

$70.79 B
Market Opportunity
25.2%
CAGR 2025 - 2030
38.6%
North America Growth
$14.91 B
Website segment 2024

Online Movie Market Size 2026-2030

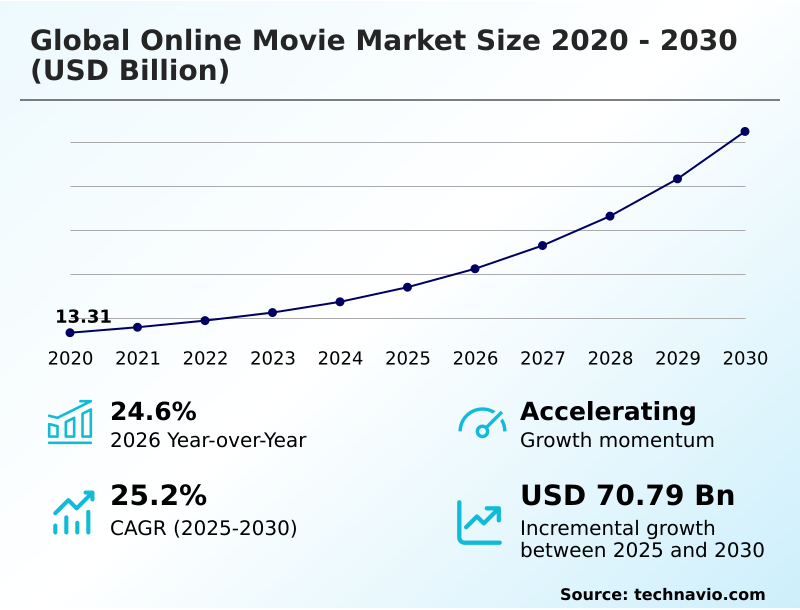
The online movie market size is valued to increase by USD 70.79 billion, at a CAGR of 25.2% from 2025 to 2030. Expansion of high-speed fiber will drive the online movie market.

Major Market Trends & Insights

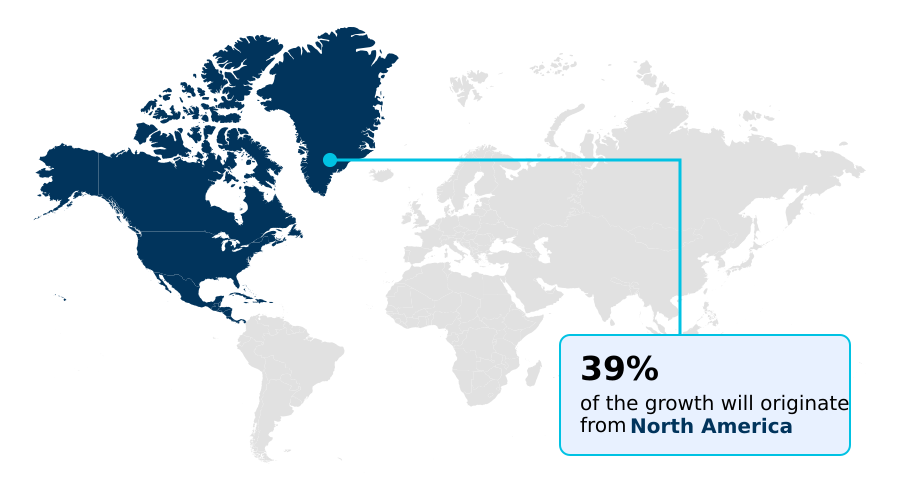
  • North America dominated the market and accounted for a 38.6% growth during the forecast period.
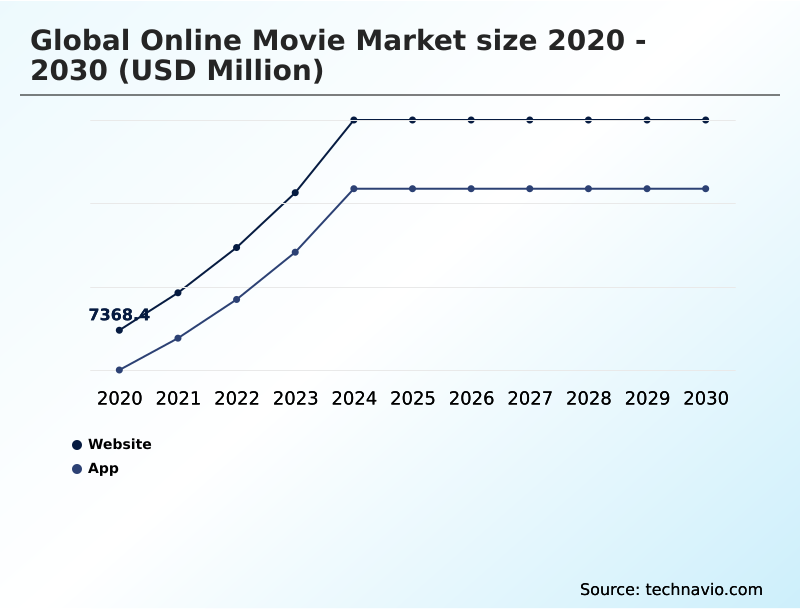
  • By Application - Website segment was valued at USD 14.91 billion in 2024
  • By Platform - Smartphones segment accounted for the largest market revenue share in 2024

Market Size & Forecast

  • Market Opportunities: USD 91.48 billion
  • Market Future Opportunities: USD 70.79 billion
  • CAGR from 2025 to 2030 : 25.2%

Market Summary

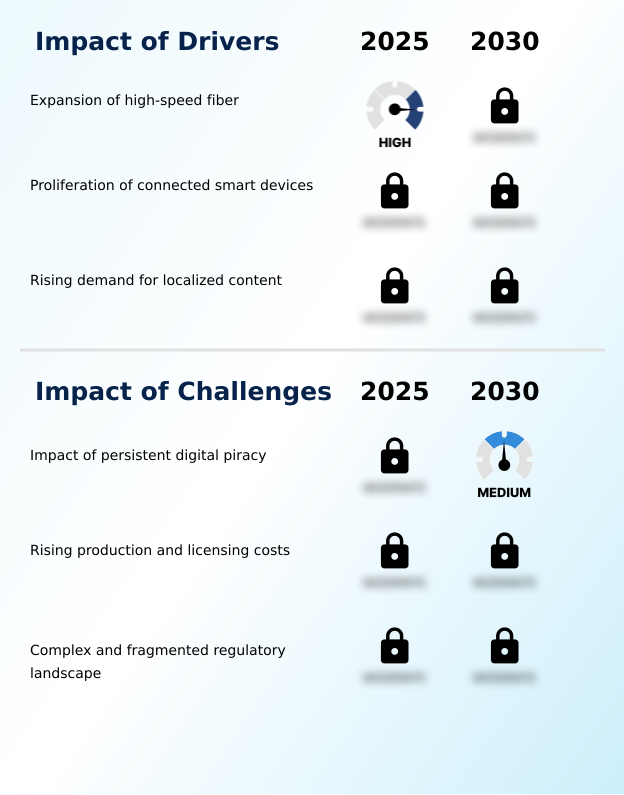
  • The online movie market is defined by a rapid technological and strategic evolution. The foundation of this market rests on the expansion of high-speed fiber networks and the proliferation of connected smart devices, which together enable a high-definition streaming experience in homes globally.
  • A key dynamic is the strategic pivot towards localized content, as platforms discover that culturally resonant stories can significantly boost engagement and reduce customer churn. However, this content-first approach is challenged by escalating licensing costs and the persistent issue of digital piracy, which necessitates robust digital rights management and geoblocking technology.
  • In a typical business scenario, a platform must analyze user behavior data to inform its content acquisition strategy. This involves a complex decision-making process, weighing the high cost of a global blockbuster against the potential return on investment from producing several smaller, targeted original films for a specific, high-growth region.
  • This balance between global appeal and local relevance, managed through sophisticated personalized recommendation engines and metadata synchronization, is central to achieving a competitive edge and maintaining a high subscriber retention rate in a crowded marketplace.

What will be the Size of the Online Movie Market during the forecast period?

Get Key Insights on Market Forecast (PDF) Request Free Sample

How is the Online Movie Market Segmented?

The online movie industry research report provides comprehensive data (region-wise segment analysis), with forecasts and estimates in "USD million" for the period 2026-2030, as well as historical data from 2020-2024 for the following segments.

  • Application
    • Website
    • App
  • Platform
    • Smartphones
    • Smart TVs
    • Laptop and desktops
    • Others
  • Genre
    • Action
    • Drama
    • Comedy
    • Romance
    • Others
  • Geography
    • North America
      • US
      • Canada
      • Mexico
    • APAC
      • China
      • India
      • Japan
    • Europe
      • UK
      • Germany
      • France
    • South America
      • Brazil
      • Argentina
      • Colombia
    • Middle East and Africa
      • UAE
      • Saudi Arabia
      • South Africa
    • Rest of World (ROW)

By Application Insights

The website segment is estimated to witness significant growth during the forecast period.

The online movie market is segmented by application, with usage bifurcated between dedicated apps and websites.

While browser-based access remains a significant channel, dedicated applications for smart TV and mobile viewing are gaining prominence, with app-based streaming growing to account for nearly half of all consumption.

This shift influences user interface design and the implementation of platform-specific features like offline viewing capability.

Consequently, providers are refining their digital content distribution strategies to optimize for both environments, ensuring a consistent home theater experience regardless of the access point.

This dual focus is critical as providers work to improve audience engagement metrics and manage content delivery networks effectively, especially with data showing that shipments of smart televisions with integrated streaming capabilities have grown by 15% year-over-year.

Request Free Sample

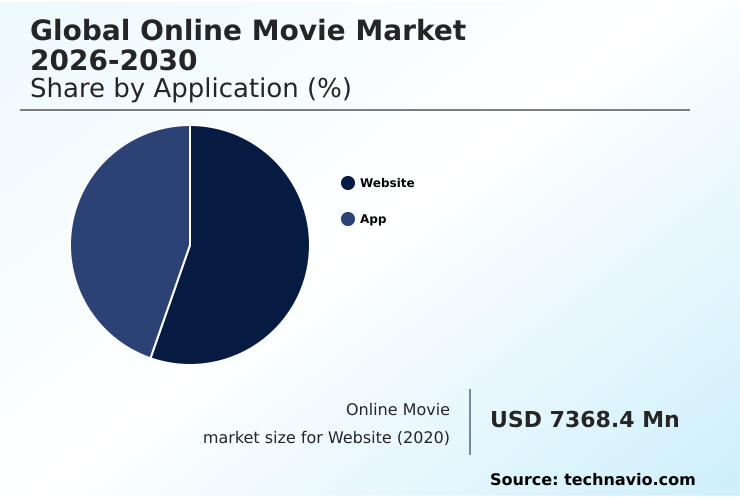
The Website segment was valued at USD 14.91 billion in 2024 and showed a gradual increase during the forecast period.

Request Free Sample

Regional Analysis

North America is estimated to contribute 38.6% to the growth of the global market during the forecast period.Technavio’s analysts have elaborately explained the regional trends and drivers that shape the market during the forecast period.

See How Online Movie Market Demand is Rising in North America Request Free Sample

The geographic landscape of the online movie market is characterized by a dual dynamic of mature market optimization and emerging market expansion.

North America remains the largest region, commanding 38.6% of the market's incremental growth, driven by high consumer spending on premium movie subscriptions and a deeply integrated home theater experience.

In contrast, the APAC region is the epicenter of rapid growth, projected to expand at a rate of 25.9%. This expansion is fueled by a mobile-first approach to cinematic content consumption and the rising demand for on-demand entertainment.

European markets focus on regulatory compliance and intellectual property protection, while growth in South America and MEA is tied to improving infrastructure and localized content monetization models, including flexible in-app purchase models and digital payment gateways.

Market Dynamics

Our researchers analyzed the data with 2025 as the base year, along with the key drivers, trends, and challenges. A holistic analysis of drivers will help companies refine their marketing strategies to gain a competitive advantage.

  • Executives in the online movie market are navigating an increasingly complex strategic landscape defined by nuanced, long-tail considerations. Decisions extend beyond simple content acquisition to encompass the impact of 5g on mobile movie streaming, which demands significant investment in mobile-optimized platforms.
  • A pivotal debate involves using blockchain for transparent movie royalties, a move that could reshape creator relationships but requires overhauling existing financial systems. The technical choice between the av1 codec versus hevc for 4k streaming has profound implications for data costs and user experience across millions of devices.
  • Forward-thinking platforms are leveraging ai for personalized movie content discovery, recognizing its power to increase engagement. The challenge of optimizing video for mobile-first markets is a top priority, as is managing the intricate web of global content distribution rights. A key focus is measuring roi on original content production, which is more complex than tracking box office returns.
  • This data is crucial for developing strategies for reducing subscriber churn rate. Simultaneously, companies must continually update security measures against digital piracy and determine the role of cloud in film post-production. The ongoing impact of data privacy on streaming services and the legal challenges of cross-border streaming require constant vigilance.
  • Executives are also analyzing the effectiveness of ad-supported vs subscription models, monetizing back-catalog movie content, and exploring the future of virtual reality in movie viewing.
  • This strategic calculus directly influences user experience design for smart tv apps, the integration of social features in movie platforms, and the management of multi-language subtitling and dubbing, where a focused investment in AI-driven personalization can yield a return on engagement that is three times more effective than broad-based marketing.

What are the key market drivers leading to the rise in the adoption of Online Movie Industry?

  • The expansion of high-speed fiber infrastructure is a primary market driver, enabling the seamless delivery of high-bitrate content to a growing global audience.

  • The market's growth is fundamentally propelled by infrastructural and technological drivers that enhance accessibility and engagement. The rapid expansion of high-speed fiber optics is a primary catalyst, providing the necessary bandwidth for a stable home theater experience.
  • This is complemented by the proliferation of connected smart devices, with shipments of smart televisions growing by 15% year-over-year, making premium content more accessible.
  • A crucial driver is the strategic focus on localized content; platforms offering movies in over 20 regional languages report a 35% higher audience engagement metric.
  • This has made local original film production a cornerstone of subscriber retention rate strategies, moving beyond a reliance on globally syndicated content to build a more loyal user base.

What are the market trends shaping the Online Movie Industry?

  • The adoption of advanced AV1 codecs represents a key market trend, driven by the industry's need to enhance streaming efficiency and visual fidelity across platforms.

  • Key trends are reshaping the technical foundation of the online movie market, focusing on efficiency and transparency. The industry-wide shift to the AV1 codec is significant, as this video compression standard delivers a performance increase of up to 30% over legacy formats, enabling higher-quality streaming with less bandwidth. This directly enhances the user experience for on-demand entertainment.
  • Concurrently, cloud-based production is revolutionizing content creation, with virtual production workflows reducing post-production timelines by over 25%. This move to virtualized workstations democratizes high-end filmmaking. Finally, blockchain royalty distribution is emerging to address financial opacity, using smart contract automation to ensure creators are paid transparently, which strengthens intellectual property protection and content acquisition strategy.

What challenges does the Online Movie Industry face during its growth?

  • The ongoing threat of digital piracy remains a significant market challenge, undermining revenue streams and requiring substantial investment in content protection technologies.

  • The online movie market grapples with significant financial and operational challenges that temper its growth. Escalating content licensing costs and production budgets represent a primary restraint, with flagship original film production costs inflating by over 50% in recent years, forcing platforms to increase premium movie subscription prices by 10-15% to maintain margins.
  • This financial pressure is compounded by the persistent threat of digital piracy, which siphons off revenue and necessitates costly investments in digital rights management and other security measures.
  • Furthermore, navigating the fragmented regulatory landscape, with its varied regional content quotas and compliance requirements, adds a layer of complexity and operational expense that can slow market entry and impact profitability, making it a critical factor in customer churn analysis.

Exclusive Technavio Analysis on Customer Landscape

The online movie market forecasting report includes the adoption lifecycle of the market, covering from the innovator’s stage to the laggard’s stage. It focuses on adoption rates in different regions based on penetration. Furthermore, the online movie market report also includes key purchase criteria and drivers of price sensitivity to help companies evaluate and develop their market growth analysis strategies.

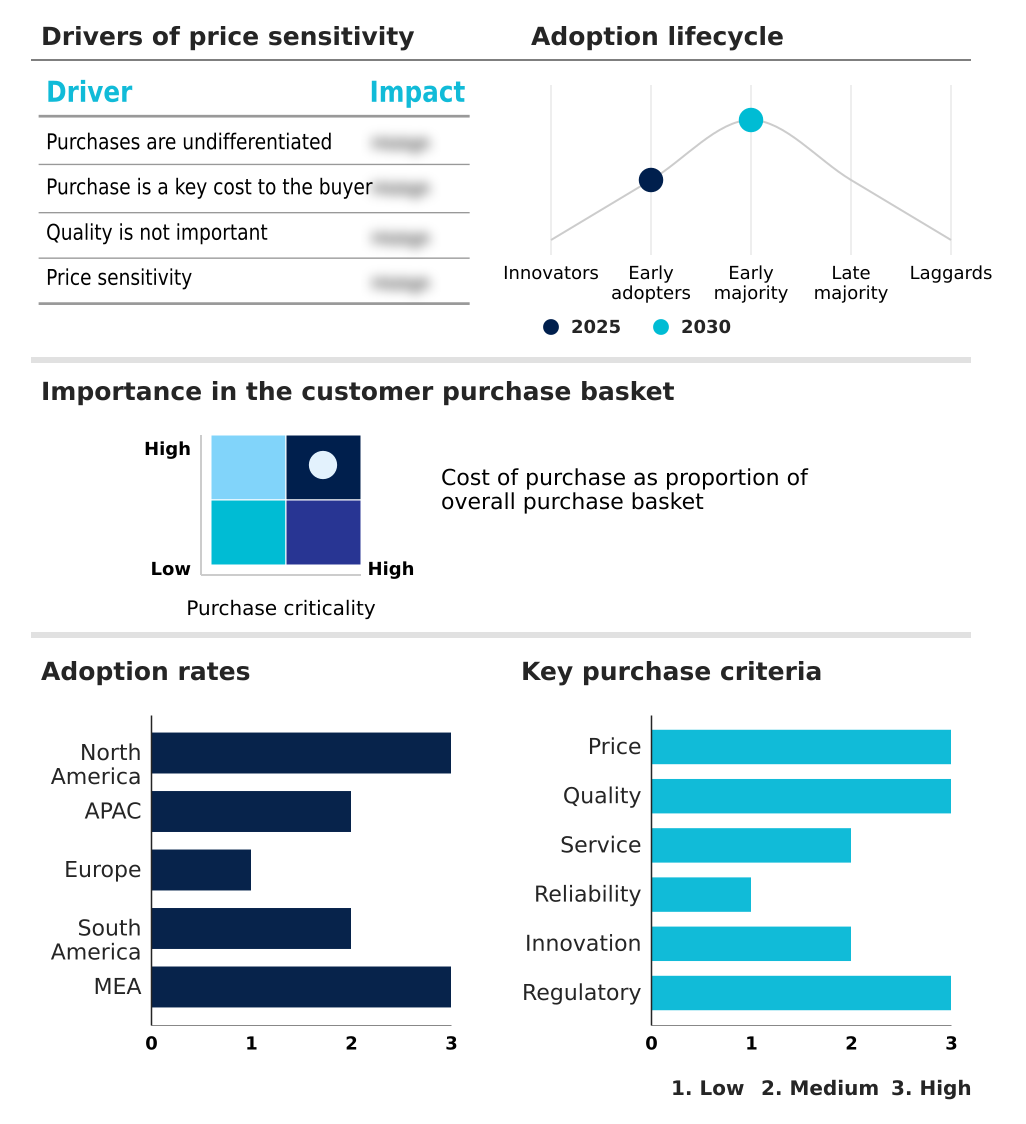
Customer Landscape of Online Movie Industry

Competitive Landscape

Companies are implementing various strategies, such as strategic alliances, online movie market forecast, partnerships, mergers and acquisitions, geographical expansion, and product/service launches, to enhance their presence in the industry.

Amazon.com Inc. - Offers a portfolio of digital entertainment, including an on-demand streaming service and original film productions for global audiences.

The industry research and growth report includes detailed analyses of the competitive landscape of the market and information about key companies, including:

  • Amazon.com Inc.
  • Apple Inc.
  • Baidu Inc.
  • Canal Plus
  • Crave
  • CuriosityStream Inc.
  • Google LLC
  • Joyn GmbH
  • JustWatch GmbH
  • Netflix Inc.
  • Paramount
  • Peacock TV LLC
  • Rakuten Group Inc.
  • Sony Group Corp.
  • The Walt Disney Co.
  • Warner Bros Discovery Inc.
  • YuppTV Inc.
  • Zee Entertainment Ltd.

Qualitative and quantitative analysis of companies has been conducted to help clients understand the wider business environment as well as the strengths and weaknesses of key industry players. Data is qualitatively analyzed to categorize companies as pure play, category-focused, industry-focused, and diversified; it is quantitatively analyzed to categorize companies as dominant, leading, strong, tentative, and weak.

Recent Development and News in Online movie market

  • In May, 2025, Paramount established a new regional partnership in the MEA region to accelerate the rollout of its premium movie streaming service through local telecommunications providers.
  • In March, 2025, Canal Plus updated its multi device ecosystem to include advanced synchronization features that allow for seamless viewing across different hardware brands, resulting in higher user retention rates.
  • In February, 2025, Peacock TV LLC implemented a full scale integration of AV1 encoding across its premium movie catalog to optimize delivery for users on limited data plans.
  • In January, 2025, Zee Entertainment Ltd. partnered with several regional internet service providers to bundle high speed data with premium movie subscriptions, leading to a substantial increase in its user base in tier two cities.

Dive into Technavio’s robust research methodology, blending expert interviews, extensive data synthesis, and validated models for unparalleled Online Movie Market insights. See full methodology.

Market Scope
Page number 305
Base year 2025
Historic period 2020-2024
Forecast period 2026-2030
Growth momentum & CAGR Accelerate at a CAGR of 25.2%
Market growth 2026-2030 USD 70791.0 million
Market structure Fragmented
YoY growth 2025-2026(%) 24.6%
Key countries US, Canada, Mexico, China, India, Japan, South Korea, Australia, Indonesia, UK, Germany, France, Italy, Spain, Russia, Brazil, Argentina, Colombia, UAE, Saudi Arabia, South Africa, Egypt and Turkey
Competitive landscape Leading Companies, Market Positioning of Companies, Competitive Strategies, and Industry Risks

Request Free Sample

Research Analyst Overview

  • The online movie market is advancing through a synthesis of infrastructural and technological innovations. The expansion of high-speed fiber and proliferation of connected smart devices provide the foundation for delivering high-definition streaming, immersive audio formats, and a seamless cross-platform interoperability.
  • At the core, the industry is driven by content, with a significant push towards localized content and original productions to capture diverse audience segments. Boardroom-level strategy now centers on balancing massive licensing costs against the benefits of developing exclusive content, a decision heavily influenced by the fragmented regulatory landscape and the need for content censorship compliance in various territories.
  • Technologies such as the AV1 codec and other video compression standards are critical for optimizing delivery across content delivery networks, especially for 4K video streaming and 8K video streaming. The integration of AI-powered dubbing has proven highly effective, as platforms utilizing this for localized content have seen engagement rates increase by up to 35% in non-English speaking markets.
  • Challenges like digital piracy are being countered with sophisticated digital rights management, geoblocking technology, and multi-factor authentication. Meanwhile, trends like cloud-based production, virtual production workflows, and blockchain royalty distribution are lowering barriers to entry and reshaping industry economics through virtualized workstations, smart contract automation, and enhanced digital asset management.
  • This complex environment demands a sophisticated user interface design and robust personalized recommendation engine to guide viewers through transactional video-on-demand, ad-supported video-on-demand, and subscription video-on-demand offerings, all while managing metadata synchronization and offering data-saving features for mobile-optimized streaming.

What are the Key Data Covered in this Online Movie Market Research and Growth Report?

  • What is the expected growth of the Online Movie Market between 2026 and 2030?

    • USD 70.79 billion, at a CAGR of 25.2%

  • What segmentation does the market report cover?

    • The report is segmented by Application (Website, and App), Platform (Smartphones, Smart TVs, Laptop and desktops, and Others), Genre (Action, Drama, Comedy, Romance, and Others) and Geography (North America, APAC, Europe, South America, Middle East and Africa)

  • Which regions are analyzed in the report?

    • North America, APAC, Europe, South America and Middle East and Africa

  • What are the key growth drivers and market challenges?

    • Expansion of high-speed fiber, Impact of persistent digital piracy

  • Who are the major players in the Online Movie Market?

    • Amazon.com Inc., Apple Inc., Baidu Inc., Canal Plus, Crave, CuriosityStream Inc., Google LLC, Joyn GmbH, JustWatch GmbH, Netflix Inc., Paramount, Peacock TV LLC, Rakuten Group Inc., Sony Group Corp., The Walt Disney Co., Warner Bros Discovery Inc., YuppTV Inc. and Zee Entertainment Ltd.

Market Research Insights

  • Market dynamics are shaped by the interplay between technological efficiency and content strategy. The adoption of advanced video encoding technology, for instance, can improve bit rate efficiency by up to 30%, directly impacting streaming quality and operational costs for every online movie platform. This technical advantage allows for a better cinematic content consumption experience, even on mobile video viewing networks.
  • Concurrently, a strategic focus on audience engagement metrics reveals that platforms offering movies in over 20 local languages see a 35% higher engagement rate. This drives a content monetization model increasingly reliant on original film production and nuanced content acquisition strategy to cater to regional tastes, influencing the average revenue per user and reducing the customer churn analysis.

We can help! Our analysts can customize this online movie market research report to meet your requirements.

Get in touch

1. Executive Summary

1.1 Market overview

Executive Summary - Chart on Market Overview
Executive Summary - Data Table on Market Overview
Executive Summary - Chart on Global Market Characteristics
Executive Summary - Chart on Market by Geography
Executive Summary - Chart on Market Segmentation by Application
Executive Summary - Chart on Market Segmentation by Platform
Executive Summary - Chart on Market Segmentation by Genre
Executive Summary - Chart on Incremental Growth
Executive Summary - Data Table on Incremental Growth
Executive Summary - Chart on Company Market Positioning

2. Technavio Analysis

2.1 Analysis of price sensitivity, lifecycle, customer purchase basket, adoption rates, and purchase criteria

2.2 Criticality of inputs and Factors of differentiation

Chart on Overview on criticality of inputs and factors of differentiation

2.3 Factors of disruption

Chart on Overview on factors of disruption

2.4 Impact of drivers and challenges

Chart on Impact of drivers and challenges in 2025 and 2030

3. Market Landscape

3.1 Market ecosystem

Chart on Parent Market
Data Table on - Parent Market

3.2 Market characteristics

Chart on Market characteristics analysis

3.3 Value chain analysis

Chart on Value chain analysis

4. Market Sizing

4.1 Market definition

Data Table on Offerings of companies included in the market definition

4.2 Market segment analysis

Market segments

4.3 Market size 2025

4.4 Market outlook: Forecast for 2025-2030

Chart on Global - Market size and forecast 2025-2030 ($ million)
Data Table on Global - Market size and forecast 2025-2030 ($ million)
Chart on Global Market: Year-over-year growth 2025-2030 (%)
Data Table on Global Market: Year-over-year growth 2025-2030 (%)

5. Historic Market Size

5.1 Global Online Movie Market 2020 - 2024

Historic Market Size - Data Table on Global Online Movie Market 2020 - 2024 ($ million)

5.2 Application segment analysis 2020 - 2024

Historic Market Size - Application Segment 2020 - 2024 ($ million)

5.3 Platform segment analysis 2020 - 2024

Historic Market Size - Platform Segment 2020 - 2024 ($ million)

5.4 Genre segment analysis 2020 - 2024

Historic Market Size - Genre Segment 2020 - 2024 ($ million)

5.5 Geography segment analysis 2020 - 2024

Historic Market Size - Geography Segment 2020 - 2024 ($ million)

5.6 Country segment analysis 2020 - 2024

Historic Market Size - Country Segment 2020 - 2024 ($ million)

6. Qualitative Analysis

6.1 Impact of Geopolitical Conflicts on the Global Online Movie Market

6.2 Impact of AI on Global Online Movie Market

7. Five Forces Analysis

7.1 Five forces summary

Five forces analysis - Comparison between 2025 and 2030

7.2 Bargaining power of buyers

Bargaining power of buyers - Impact of key factors 2025 and 2030

7.3 Bargaining power of suppliers

Bargaining power of suppliers - Impact of key factors in 2025 and 2030

7.4 Threat of new entrants

Threat of new entrants - Impact of key factors in 2025 and 2030

7.5 Threat of substitutes

Threat of substitutes - Impact of key factors in 2025 and 2030

7.6 Threat of rivalry

Threat of rivalry - Impact of key factors in 2025 and 2030

7.7 Market condition

Chart on Market condition - Five forces 2025 and 2030

8. Market Segmentation by Application

8.1 Market segments

Chart on Application - Market share 2025-2030 (%)
Data Table on Application - Market share 2025-2030 (%)

8.2 Comparison by Application

Chart on Comparison by Application
Data Table on Comparison by Application

8.3 Website - Market size and forecast 2025-2030

Chart on Website - Market size and forecast 2025-2030 ($ million)
Data Table on Website - Market size and forecast 2025-2030 ($ million)
Chart on Website - Year-over-year growth 2025-2030 (%)
Data Table on Website - Year-over-year growth 2025-2030 (%)

8.4 App - Market size and forecast 2025-2030

Chart on App - Market size and forecast 2025-2030 ($ million)
Data Table on App - Market size and forecast 2025-2030 ($ million)
Chart on App - Year-over-year growth 2025-2030 (%)
Data Table on App - Year-over-year growth 2025-2030 (%)

8.5 Market opportunity by Application

Market opportunity by Application ($ million)
Data Table on Market opportunity by Application ($ million)

9. Market Segmentation by Platform

9.1 Market segments

Chart on Platform - Market share 2025-2030 (%)
Data Table on Platform - Market share 2025-2030 (%)

9.2 Comparison by Platform

Chart on Comparison by Platform
Data Table on Comparison by Platform

9.3 Smartphones - Market size and forecast 2025-2030

Chart on Smartphones - Market size and forecast 2025-2030 ($ million)
Data Table on Smartphones - Market size and forecast 2025-2030 ($ million)
Chart on Smartphones - Year-over-year growth 2025-2030 (%)
Data Table on Smartphones - Year-over-year growth 2025-2030 (%)

9.4 Smart TVs - Market size and forecast 2025-2030

Chart on Smart TVs - Market size and forecast 2025-2030 ($ million)
Data Table on Smart TVs - Market size and forecast 2025-2030 ($ million)
Chart on Smart TVs - Year-over-year growth 2025-2030 (%)
Data Table on Smart TVs - Year-over-year growth 2025-2030 (%)

9.5 Laptop and desktops - Market size and forecast 2025-2030

Chart on Laptop and desktops - Market size and forecast 2025-2030 ($ million)
Data Table on Laptop and desktops - Market size and forecast 2025-2030 ($ million)
Chart on Laptop and desktops - Year-over-year growth 2025-2030 (%)
Data Table on Laptop and desktops - Year-over-year growth 2025-2030 (%)

9.6 Others - Market size and forecast 2025-2030

Chart on Others - Market size and forecast 2025-2030 ($ million)
Data Table on Others - Market size and forecast 2025-2030 ($ million)
Chart on Others - Year-over-year growth 2025-2030 (%)
Data Table on Others - Year-over-year growth 2025-2030 (%)

9.7 Market opportunity by Platform

Market opportunity by Platform ($ million)
Data Table on Market opportunity by Platform ($ million)

10. Market Segmentation by Genre

10.1 Market segments

Chart on Genre - Market share 2025-2030 (%)
Data Table on Genre - Market share 2025-2030 (%)

10.2 Comparison by Genre

Chart on Comparison by Genre
Data Table on Comparison by Genre

10.3 Action - Market size and forecast 2025-2030

Chart on Action - Market size and forecast 2025-2030 ($ million)
Data Table on Action - Market size and forecast 2025-2030 ($ million)
Chart on Action - Year-over-year growth 2025-2030 (%)
Data Table on Action - Year-over-year growth 2025-2030 (%)

10.4 Drama - Market size and forecast 2025-2030

Chart on Drama - Market size and forecast 2025-2030 ($ million)
Data Table on Drama - Market size and forecast 2025-2030 ($ million)
Chart on Drama - Year-over-year growth 2025-2030 (%)
Data Table on Drama - Year-over-year growth 2025-2030 (%)

10.5 Comedy - Market size and forecast 2025-2030

Chart on Comedy - Market size and forecast 2025-2030 ($ million)
Data Table on Comedy - Market size and forecast 2025-2030 ($ million)
Chart on Comedy - Year-over-year growth 2025-2030 (%)
Data Table on Comedy - Year-over-year growth 2025-2030 (%)

10.6 Romance - Market size and forecast 2025-2030

Chart on Romance - Market size and forecast 2025-2030 ($ million)
Data Table on Romance - Market size and forecast 2025-2030 ($ million)
Chart on Romance - Year-over-year growth 2025-2030 (%)
Data Table on Romance - Year-over-year growth 2025-2030 (%)

10.7 Others - Market size and forecast 2025-2030

Chart on Others - Market size and forecast 2025-2030 ($ million)
Data Table on Others - Market size and forecast 2025-2030 ($ million)
Chart on Others - Year-over-year growth 2025-2030 (%)
Data Table on Others - Year-over-year growth 2025-2030 (%)

10.8 Market opportunity by Genre

Market opportunity by Genre ($ million)
Data Table on Market opportunity by Genre ($ million)

11. Customer Landscape

11.1 Customer landscape overview

Analysis of price sensitivity, lifecycle, customer purchase basket, adoption rates, and purchase criteria

12. Geographic Landscape

12.1 Geographic segmentation

Chart on Market share by geography 2025-2030 (%)
Data Table on Market share by geography 2025-2030 (%)

12.2 Geographic comparison

Chart on Geographic comparison
Data Table on Geographic comparison

12.3 North America - Market size and forecast 2025-2030

Chart on North America - Market size and forecast 2025-2030 ($ million)
Data Table on North America - Market size and forecast 2025-2030 ($ million)
Chart on North America - Year-over-year growth 2025-2030 (%)
Data Table on North America - Year-over-year growth 2025-2030 (%)
Chart on Regional Comparison - North America
Data Table on Regional Comparison - North America

12.3.1 US - Market size and forecast 2025-2030

Chart on US - Market size and forecast 2025-2030 ($ million)
Data Table on US - Market size and forecast 2025-2030 ($ million)
Chart on US - Year-over-year growth 2025-2030 (%)
Data Table on US - Year-over-year growth 2025-2030 (%)

12.3.2 Canada - Market size and forecast 2025-2030

Chart on Canada - Market size and forecast 2025-2030 ($ million)
Data Table on Canada - Market size and forecast 2025-2030 ($ million)
Chart on Canada - Year-over-year growth 2025-2030 (%)
Data Table on Canada - Year-over-year growth 2025-2030 (%)

12.3.3 Mexico - Market size and forecast 2025-2030

Chart on Mexico - Market size and forecast 2025-2030 ($ million)
Data Table on Mexico - Market size and forecast 2025-2030 ($ million)
Chart on Mexico - Year-over-year growth 2025-2030 (%)
Data Table on Mexico - Year-over-year growth 2025-2030 (%)

12.4 APAC - Market size and forecast 2025-2030

Chart on APAC - Market size and forecast 2025-2030 ($ million)
Data Table on APAC - Market size and forecast 2025-2030 ($ million)
Chart on APAC - Year-over-year growth 2025-2030 (%)
Data Table on APAC - Year-over-year growth 2025-2030 (%)
Chart on Regional Comparison - APAC
Data Table on Regional Comparison - APAC

12.4.1 China - Market size and forecast 2025-2030

Chart on China - Market size and forecast 2025-2030 ($ million)
Data Table on China - Market size and forecast 2025-2030 ($ million)
Chart on China - Year-over-year growth 2025-2030 (%)
Data Table on China - Year-over-year growth 2025-2030 (%)

12.4.2 India - Market size and forecast 2025-2030

Chart on India - Market size and forecast 2025-2030 ($ million)
Data Table on India - Market size and forecast 2025-2030 ($ million)
Chart on India - Year-over-year growth 2025-2030 (%)
Data Table on India - Year-over-year growth 2025-2030 (%)

12.4.3 Japan - Market size and forecast 2025-2030

Chart on Japan - Market size and forecast 2025-2030 ($ million)
Data Table on Japan - Market size and forecast 2025-2030 ($ million)
Chart on Japan - Year-over-year growth 2025-2030 (%)
Data Table on Japan - Year-over-year growth 2025-2030 (%)

12.4.4 South Korea - Market size and forecast 2025-2030

Chart on South Korea - Market size and forecast 2025-2030 ($ million)
Data Table on South Korea - Market size and forecast 2025-2030 ($ million)
Chart on South Korea - Year-over-year growth 2025-2030 (%)
Data Table on South Korea - Year-over-year growth 2025-2030 (%)

12.4.5 Australia - Market size and forecast 2025-2030

Chart on Australia - Market size and forecast 2025-2030 ($ million)
Data Table on Australia - Market size and forecast 2025-2030 ($ million)
Chart on Australia - Year-over-year growth 2025-2030 (%)
Data Table on Australia - Year-over-year growth 2025-2030 (%)

12.4.6 Indonesia - Market size and forecast 2025-2030

Chart on Indonesia - Market size and forecast 2025-2030 ($ million)
Data Table on Indonesia - Market size and forecast 2025-2030 ($ million)
Chart on Indonesia - Year-over-year growth 2025-2030 (%)
Data Table on Indonesia - Year-over-year growth 2025-2030 (%)

12.5 Europe - Market size and forecast 2025-2030

Chart on Europe - Market size and forecast 2025-2030 ($ million)
Data Table on Europe - Market size and forecast 2025-2030 ($ million)
Chart on Europe - Year-over-year growth 2025-2030 (%)
Data Table on Europe - Year-over-year growth 2025-2030 (%)
Chart on Regional Comparison - Europe
Data Table on Regional Comparison - Europe

12.5.1 UK - Market size and forecast 2025-2030

Chart on UK - Market size and forecast 2025-2030 ($ million)
Data Table on UK - Market size and forecast 2025-2030 ($ million)
Chart on UK - Year-over-year growth 2025-2030 (%)
Data Table on UK - Year-over-year growth 2025-2030 (%)

12.5.2 Germany - Market size and forecast 2025-2030

Chart on Germany - Market size and forecast 2025-2030 ($ million)
Data Table on Germany - Market size and forecast 2025-2030 ($ million)
Chart on Germany - Year-over-year growth 2025-2030 (%)
Data Table on Germany - Year-over-year growth 2025-2030 (%)

12.5.3 France - Market size and forecast 2025-2030

Chart on France - Market size and forecast 2025-2030 ($ million)
Data Table on France - Market size and forecast 2025-2030 ($ million)
Chart on France - Year-over-year growth 2025-2030 (%)
Data Table on France - Year-over-year growth 2025-2030 (%)

12.5.4 Italy - Market size and forecast 2025-2030

Chart on Italy - Market size and forecast 2025-2030 ($ million)
Data Table on Italy - Market size and forecast 2025-2030 ($ million)
Chart on Italy - Year-over-year growth 2025-2030 (%)
Data Table on Italy - Year-over-year growth 2025-2030 (%)

12.5.5 Spain - Market size and forecast 2025-2030

Chart on Spain - Market size and forecast 2025-2030 ($ million)
Data Table on Spain - Market size and forecast 2025-2030 ($ million)
Chart on Spain - Year-over-year growth 2025-2030 (%)
Data Table on Spain - Year-over-year growth 2025-2030 (%)

12.5.6 Russia - Market size and forecast 2025-2030

Chart on Russia - Market size and forecast 2025-2030 ($ million)
Data Table on Russia - Market size and forecast 2025-2030 ($ million)
Chart on Russia - Year-over-year growth 2025-2030 (%)
Data Table on Russia - Year-over-year growth 2025-2030 (%)

12.6 South America - Market size and forecast 2025-2030

Chart on South America - Market size and forecast 2025-2030 ($ million)
Data Table on South America - Market size and forecast 2025-2030 ($ million)
Chart on South America - Year-over-year growth 2025-2030 (%)
Data Table on South America - Year-over-year growth 2025-2030 (%)
Chart on Regional Comparison - South America
Data Table on Regional Comparison - South America

12.6.1 Brazil - Market size and forecast 2025-2030

Chart on Brazil - Market size and forecast 2025-2030 ($ million)
Data Table on Brazil - Market size and forecast 2025-2030 ($ million)
Chart on Brazil - Year-over-year growth 2025-2030 (%)
Data Table on Brazil - Year-over-year growth 2025-2030 (%)

12.6.2 Argentina - Market size and forecast 2025-2030

Chart on Argentina - Market size and forecast 2025-2030 ($ million)
Data Table on Argentina - Market size and forecast 2025-2030 ($ million)
Chart on Argentina - Year-over-year growth 2025-2030 (%)
Data Table on Argentina - Year-over-year growth 2025-2030 (%)

12.6.3 Colombia - Market size and forecast 2025-2030

Chart on Colombia - Market size and forecast 2025-2030 ($ million)
Data Table on Colombia - Market size and forecast 2025-2030 ($ million)
Chart on Colombia - Year-over-year growth 2025-2030 (%)
Data Table on Colombia - Year-over-year growth 2025-2030 (%)

12.7 Middle East and Africa - Market size and forecast 2025-2030

Chart on Middle East and Africa - Market size and forecast 2025-2030 ($ million)
Data Table on Middle East and Africa - Market size and forecast 2025-2030 ($ million)
Chart on Middle East and Africa - Year-over-year growth 2025-2030 (%)
Data Table on Middle East and Africa - Year-over-year growth 2025-2030 (%)
Chart on Regional Comparison - Middle East and Africa
Data Table on Regional Comparison - Middle East and Africa

12.7.1 UAE - Market size and forecast 2025-2030

Chart on UAE - Market size and forecast 2025-2030 ($ million)
Data Table on UAE - Market size and forecast 2025-2030 ($ million)
Chart on UAE - Year-over-year growth 2025-2030 (%)
Data Table on UAE - Year-over-year growth 2025-2030 (%)

12.7.2 Saudi Arabia - Market size and forecast 2025-2030

Chart on Saudi Arabia - Market size and forecast 2025-2030 ($ million)
Data Table on Saudi Arabia - Market size and forecast 2025-2030 ($ million)
Chart on Saudi Arabia - Year-over-year growth 2025-2030 (%)
Data Table on Saudi Arabia - Year-over-year growth 2025-2030 (%)

12.7.3 South Africa - Market size and forecast 2025-2030

Chart on South Africa - Market size and forecast 2025-2030 ($ million)
Data Table on South Africa - Market size and forecast 2025-2030 ($ million)
Chart on South Africa - Year-over-year growth 2025-2030 (%)
Data Table on South Africa - Year-over-year growth 2025-2030 (%)

12.7.4 Egypt - Market size and forecast 2025-2030

Chart on Egypt - Market size and forecast 2025-2030 ($ million)
Data Table on Egypt - Market size and forecast 2025-2030 ($ million)
Chart on Egypt - Year-over-year growth 2025-2030 (%)
Data Table on Egypt - Year-over-year growth 2025-2030 (%)

12.7.5 Turkey - Market size and forecast 2025-2030

Chart on Turkey - Market size and forecast 2025-2030 ($ million)
Data Table on Turkey - Market size and forecast 2025-2030 ($ million)
Chart on Turkey - Year-over-year growth 2025-2030 (%)
Data Table on Turkey - Year-over-year growth 2025-2030 (%)

12.8 Market opportunity by geography

Market opportunity by geography ($ million)
Data Tables on Market opportunity by geography ($ million)

13. Drivers, Challenges, and Opportunity

13.1 Market drivers

Expansion of high-speed fiber
Proliferation of connected smart devices
Rising demand for localized content

13.2 Market challenges

Impact of persistent digital piracy
Rising production and licensing costs
Complex and fragmented regulatory landscape

13.3 Impact of drivers and challenges

Impact of drivers and challenges in 2025 and 2030

13.4 Market opportunities

Adoption of advanced AV1 codecs
Integration of cloud-based production
Utilization of blockchain for transparency

14. Competitive Landscape

14.1 Overview

14.2

Overview on criticality of inputs and factors of differentiation

14.3 Landscape disruption

Overview on factors of disruption

14.4 Industry risks

Impact of key risks on business

15. Competitive Analysis

15.1 Companies profiled

Companies covered

15.2 Company ranking index

15.3 Market positioning of companies

Matrix on companies position and classification

15.4 Amazon.com Inc.

Amazon.com Inc. - Overview
Amazon.com Inc. - Business segments
Amazon.com Inc. - Key news
Amazon.com Inc. - Key offerings
Amazon.com Inc. - Segment focus
SWOT

15.5 Apple Inc.

Apple Inc. - Overview
Apple Inc. - Business segments
Apple Inc. - Key news
Apple Inc. - Key offerings
Apple Inc. - Segment focus
SWOT

15.6 Baidu Inc.

Baidu Inc. - Overview
Baidu Inc. - Business segments
Baidu Inc. - Key news
Baidu Inc. - Key offerings
Baidu Inc. - Segment focus
SWOT

15.7 Crave

Crave - Overview
Crave - Product / Service
Crave - Key offerings
SWOT

15.8 CuriosityStream Inc.

CuriosityStream Inc. - Overview
CuriosityStream Inc. - Product / Service
CuriosityStream Inc. - Key offerings
SWOT

15.9 Google LLC

Google LLC - Overview
Google LLC - Product / Service
Google LLC - Key offerings
SWOT

15.10 Joyn GmbH

Joyn GmbH - Overview
Joyn GmbH - Product / Service
Joyn GmbH - Key offerings
SWOT

15.11 Netflix Inc.

Netflix Inc. - Overview
Netflix Inc. - Product / Service
Netflix Inc. - Key offerings
SWOT

15.12 Paramount

Paramount - Overview
Paramount - Product / Service
Paramount - Key offerings
SWOT

15.13 Peacock TV LLC

Peacock TV LLC - Overview
Peacock TV LLC - Product / Service
Peacock TV LLC - Key offerings
SWOT

15.14 Rakuten Group Inc.

Rakuten Group Inc. - Overview
Rakuten Group Inc. - Business segments
Rakuten Group Inc. - Key news
Rakuten Group Inc. - Key offerings
Rakuten Group Inc. - Segment focus
SWOT

15.15 Sony Group Corp.

Sony Group Corp. - Overview
Sony Group Corp. - Business segments
Sony Group Corp. - Key news
Sony Group Corp. - Key offerings
Sony Group Corp. - Segment focus
SWOT

15.16 The Walt Disney Co.

The Walt Disney Co. - Overview
The Walt Disney Co. - Business segments
The Walt Disney Co. - Key offerings
The Walt Disney Co. - Segment focus
SWOT

15.17 Warner Bros Discovery Inc.

Warner Bros Discovery Inc. - Overview
Warner Bros Discovery Inc. - Business segments
Warner Bros Discovery Inc. - Key news
Warner Bros Discovery Inc. - Key offerings
Warner Bros Discovery Inc. - Segment focus
SWOT

15.18 Zee Entertainment Ltd.

Zee Entertainment Ltd. - Overview
Zee Entertainment Ltd. - Product / Service
Zee Entertainment Ltd. - Key offerings
SWOT

16. Appendix

16.1 Scope of the report

Market definition
Objectives
Notes and caveats

16.2 Inclusions and exclusions checklist

Inclusions checklist
Exclusions checklist

16.3 Currency conversion rates for US$

16.4 Research methodology

16.5 Data procurement

Information sources

16.6 Data validation

16.7 Validation techniques employed for market sizing

16.8 Data synthesis

16.9 360 degree market analysis

16.10 List of abbreviations

Research Methodology

Technavio presents a detailed picture of the market by way of study, synthesis, and summation of data from multiple sources. The analysts have presented the various facets of the market with a particular focus on identifying the key industry influencers. The data thus presented is comprehensive, reliable, and the result of extensive research, both primary and secondary.

INFORMATION SOURCES

Primary sources

  • Manufacturers and suppliers
  • Channel partners
  • Industry experts
  • Strategic decision makers

Secondary sources

  • Industry journals and periodicals
  • Government data
  • Financial reports of key industry players
  • Historical data
  • Press releases

DATA ANALYSIS

Data Synthesis

  • Collation of data
  • Estimation of key figures
  • Analysis of derived insights

Data Validation

  • Triangulation with data models
  • Reference against proprietary databases
  • Corroboration with industry experts

REPORT WRITING

Qualitative

  • Market drivers
  • Market challenges
  • Market trends
  • Five forces analysis

Quantitative

  • Market size and forecast
  • Market segmentation
  • Geographical insights
  • Competitive landscape

Interested in this report?

Get your sample now to see our research methodology and insights!

Download Now

Frequently Asked Questions

Online Movie market growth will increase by USD 70791.0 million during 2026-2030.

The Online Movie market is expected to grow at a CAGR of 25.2% during 2026-2030.

Online Movie market is segmented by Application (Website, App) Platform (Smartphones, Smart TVs, Laptop and desktops, Others) Genre (Action, Drama, Comedy, Romance, Others)

Amazon.com Inc., Apple Inc., Baidu Inc., Canal Plus, Crave, CuriosityStream Inc., Google LLC, Joyn GmbH, JustWatch GmbH, Netflix Inc., Paramount, Peacock TV LLC, Rakuten Group Inc., Sony Group Corp., The Walt Disney Co., Warner Bros Discovery Inc., YuppTV Inc., Zee Entertainment Ltd. are a few of the key vendors in the Online Movie market.

North America will register the highest growth rate of 38.6% among the other regions. Therefore, the Online Movie market in North America is expected to garner significant business opportunities for the vendors during the forecast period.

US, Canada, Mexico, China, India, Japan, South Korea, Australia, Indonesia, UK, Germany, France, Italy, Spain, Russia, Brazil, Argentina, Colombia, UAE, Saudi Arabia, South Africa, Egypt, Turkey

  • Expansion of high-speed fiber is the driving factor this market.

The Online Movie market vendors should focus on grabbing business opportunities from the Application segment as it accounted for the largest market share in the base year.
RIA - Research AI Assistant
Ask RIA