US Online Gambling Market Analysis, Size, and Forecast 2025-2029

US Online Gambling Market Analysis, Size, and Forecast 2025-2029

Published: Apr 2025 161 Pages SKU: IRTNTR72612

Market Overview at a Glance

$54.8 B
Market Opportunity
11.6%
CAGR
10.1
YoY growth 2024-2025(%)

US Online Gambling Market Size 2025-2029 

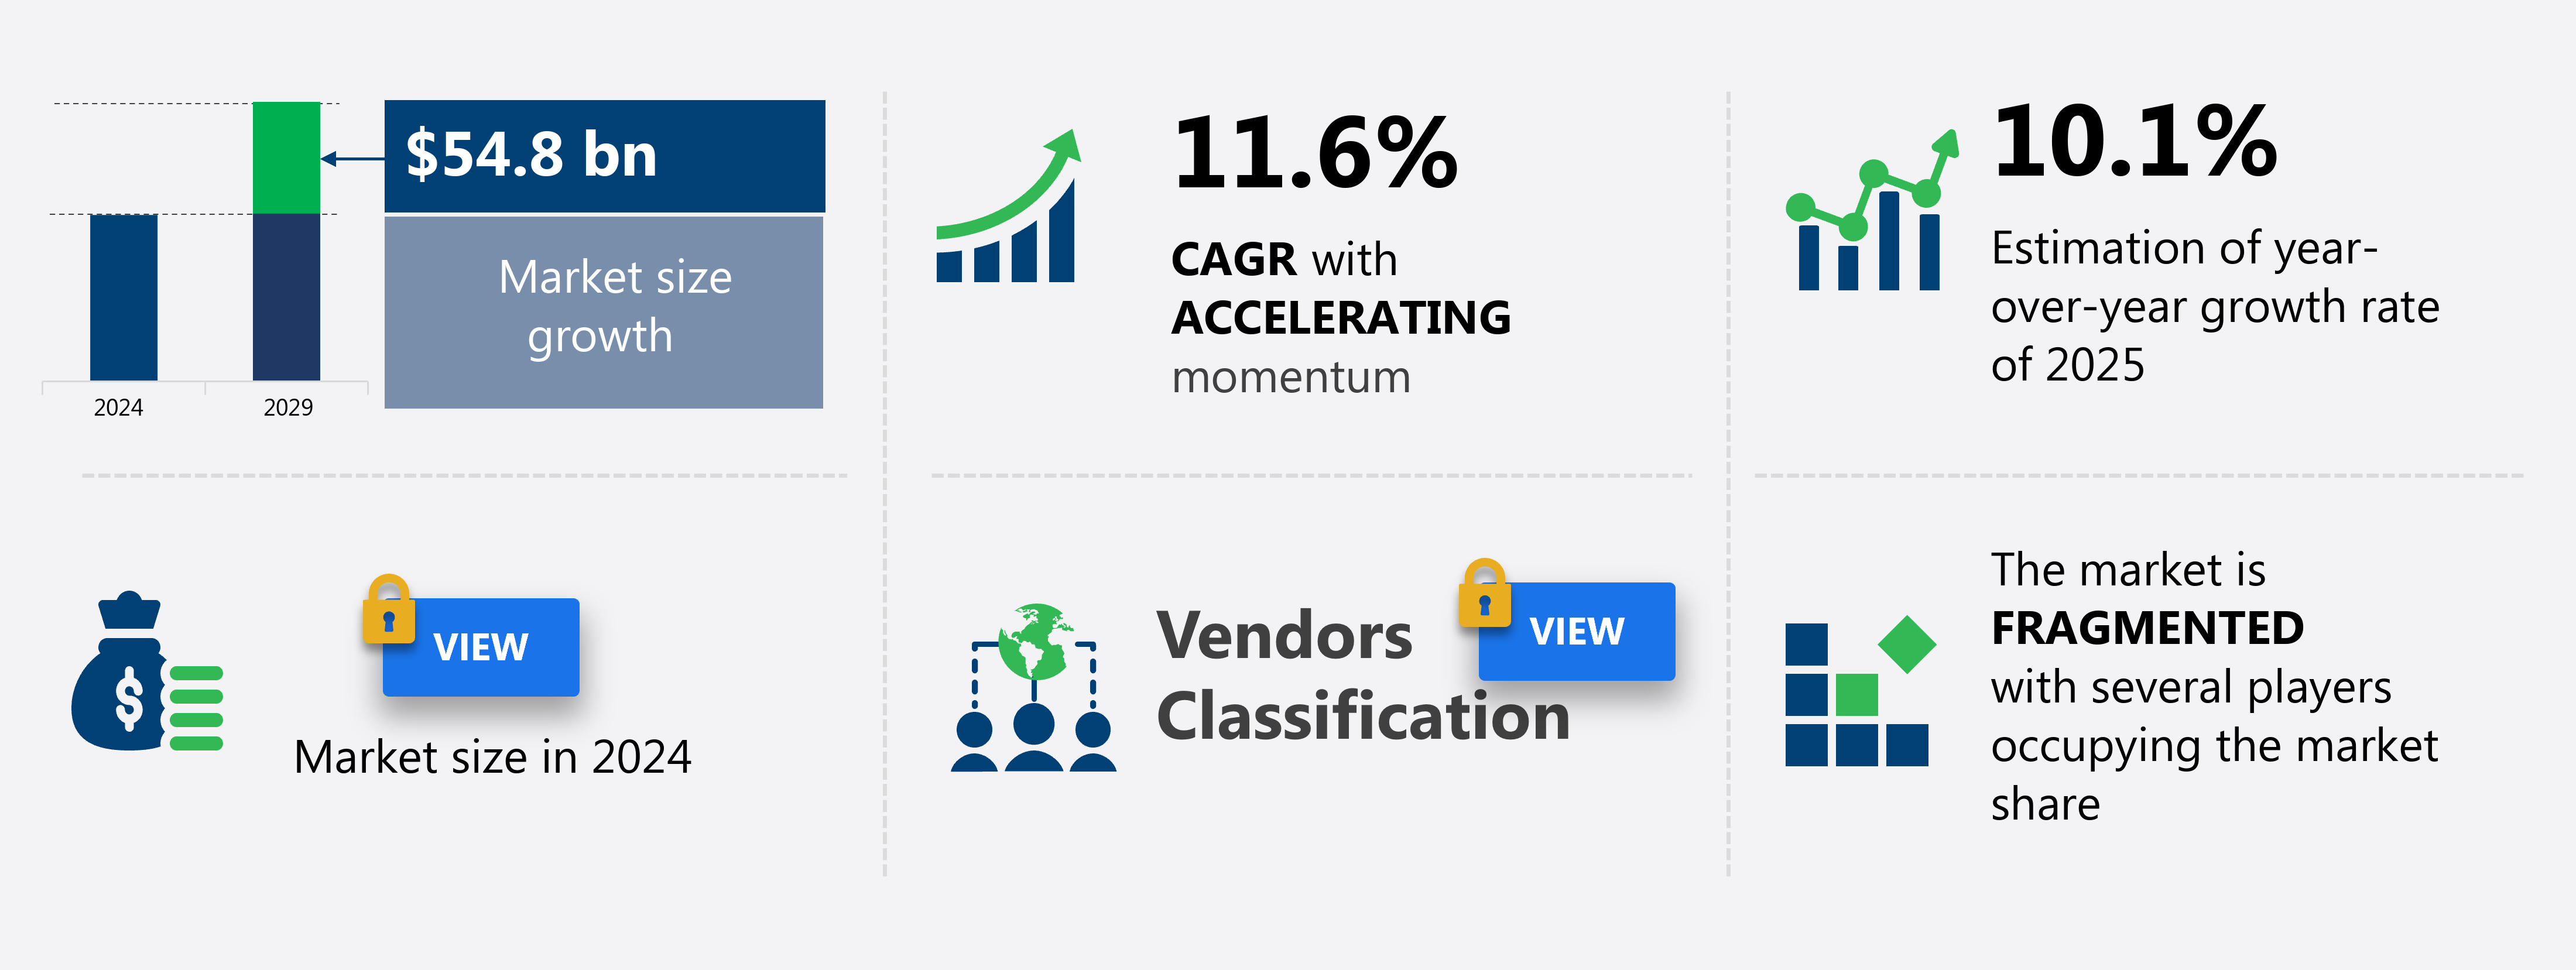
The online gambling market in US size is forecast to increase by USD 54.8 billion billion at a CAGR of 11.6% between 2024 and 2029.

  • The online gambling market is experiencing significant growth due to several key trends. The relaxation of government regulations in various regions is driving market expansion. Virtual reality (VR) technology is revolutionizing online gaming, offering an experience that appeals to a wide audience, including those seeking an alternative to traditional casino games or as a means to curb gambling addiction. Security and credibility concerns are being addressed through advancements in data analytics, multi-factor authentication, and blockchain technology. Sports betting and fantasy sports continue to be popular segments, with the integration of artificial intelligence and chatbots enhancing user experience. The increasing use of smartphones and LED screens for online gambling further boosts market growth. These trends are shaping the future of the online gambling industry, offering new opportunities for innovation and growth. Brand Awareness and Player Behavior are vital areas of focus, with Player Retention strategies employing Machine Learning and Artificial Intelligence to analyze trends and tailor offerings accordingly.

What will be the Size of the market During the Forecast Period?

Online Gambling Market in US Size

 Request Free Sample

  • In the dynamic online gambling market, mobile apps have become a primary platform for engaging players. Affiliate networks play a crucial role in driving traffic and revenue for operators. Deposit and loss limits are essential player protection measures, while gamification techniques and personalized offers enhance user experience. Evolution Gaming and other game providers offer live casino games, poker rooms, and virtual reality gaming for a more experience. Data analysis and risk assessment are key components of effective player retention strategies. Compliance regulations ensure a responsible gambling environment. Company partnerships provide access to AI-powered recommendations, financial audits, and brand building tools. The market encompasses various forms of internet-based gambling, including casino games such as poker and blackjack, sports betting on soccer, rugby, and other popular events, lotteries, and bingo. Mobile devices dominate the landscape, with desktop usage declining.

    Social media strategies and email support offer channels for customer acquisition and engagement. Cybersecurity measures and phone support ensure a secure and seamless experience. User experience optimization, machine learning algorithms, and random number generators contribute to the overall quality of the gaming experience. Online lotteries, bingo halls, and slot machines cater to diverse customer preferences. UI/UX design and content creation are essential for attracting and retaining players. VIP programs and welcome bonuses offer incentives for loyalty. Live chat and responsible gambling tools promote player satisfaction and trust. Match bonuses and free spins reward new and returning players. Brand building and customer segmentation strategies help operators target their audience effectively. Game mechanics, such as poker rooms and slot machines, offer a balance of skill and chance. Overall, the online gambling market continues to evolve, driven by technological advancements and changing player preferences.

How is this market segmented and which is the largest segment?

The market research report provides comprehensive data (region-wise segment analysis), with forecasts and estimates in "USD billion" for the period 2025-2029, as well as historical data from 2019-2023 for the following segments.
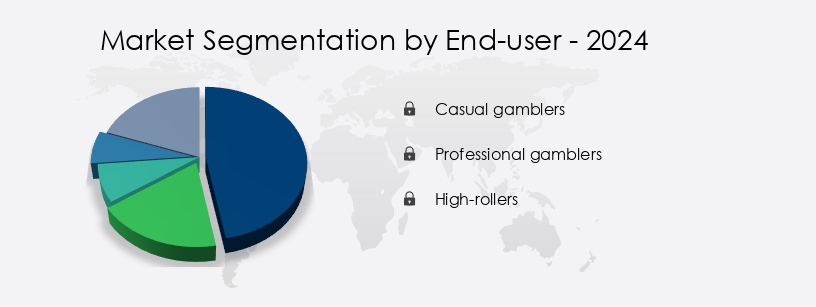
  • End-user
    • Casual gamblers
    • Professional gamblers
    • High-rollers
  • Type
    • Sports betting
    • Casino games
    • Poker
    • Bingo
    • Lottery
  • Device
    • Desktop
    • Mobile
  • Geography
    • US

By End-user Insights

  • The casual gamblers segment is estimated to witness significant growth during the forecast period. In the dynamic online gambling market, entities such as Game Design and User Experience play pivotal roles in catering to the preferences of diverse segments, including casual gamblers. These individuals primarily engage in gambling activities for entertainment and leisure, often favoring platforms with user-friendly interfaces and a wide range of offerings, including slots, poker, and sports betting. To retain and engage this demographic, operators incorporate various strategies. For instance, they offer promotions, bonuses, and free-play options, ensuring a rewarding and enjoyable experience. StartFragment Responsible gaming and anti-money laundering measures are integral to maintaining a secure and trustworthy environment, while software providers and payment gateways facilitate seamless transactions.EndFragment
  • StartFragment Market penetration and customer acquisition are crucial for businesses, with paid advertising, content marketing, and social media marketing employed to attract new users. User engagement is further enhanced through esports betting, table games, and loyalty programs. Fraud prevention and risk management are essential components, with big data analytics and machine learning used to monitor and mitigate potential threats. Data security and data privacy are non-negotiable, ensuring that sensitive information is protected. Moreover, the increasing popularity of mobile gaming and real money gaming necessitates the implementation of efficient withdrawal methods and deposit methods. Virtual sports and live dealer games add to the overall appeal, providing a more experience.EndFragment

Online Gambling Market in US Share by End-user

Get a glance at the market report of share of various segments Request Free Sample

Market Dynamics

Our US Online Gambling Market researchers analyzed the data with 2024 as the base year, along with the key drivers, trends, and challenges. A holistic analysis of drivers will help companies refine their marketing strategies to gain a competitive advantage.

What are the key market drivers leading to the rise in adoption of US Online Gambling Market?

  • Easing of government regulations is the key driver of the market. Online gambling in the US has witnessed significant developments since the passing of the Unlawful Internet Gambling Enforcement Act in 2006, which prohibited all forms of online gambling. However, in 2012, a new law permitted individual states to issue licenses for online and mobile casinos, sportsbooks, and poker sites within their jurisdictions. As of 2023, New Jersey, Delaware, Michigan, West Virginia, Pennsylvania, and Connecticut have legalized online gambling in the US. The relaxation of online gambling laws is expected to bring substantial revenue for the government through taxes. Moreover, online gambling offers several advantages, including responsible gaming initiatives, advanced software providers, customer support, and fraud prevention measures. Major sporting events such as the FIFA World Cup and Olympics attract a large number of bettors, driving revenue growth In the online gambling market.
  • The market is characterized by the availability of various games, such as table games, slot games, and live dealer games, catering to diverse player preferences. Market penetration is facilitated through various channels, including payment gateways, player verification, and withdrawal methods. User engagement is enhanced through loyalty programs, affiliate marketing, and content marketing. Esports betting and virtual sports have emerged as popular categories, attracting a younger demographic. Big data analytics, data security, and artificial intelligence are integral to ensuring a seamless user experience. Anti-money laundering and risk management systems are essential to maintaining data privacy and player behavior analysis. With the increasing popularity of mobile gaming, online gambling providers are focusing on optimizing their platforms for mobile devices.

What are the market trends shaping the US Online Gambling Market?

  • Emergence of VR as cure for gambling addiction is the upcoming trend in the market. In the online gambling market, game design plays a crucial role in user engagement and player retention. Responsible gaming initiatives are integrated into software providers' offerings, ensuring a safe and secure gaming experience. Customer support is prioritized to address any concerns and queries promptly. Market penetration is driven by various factors, including the availability of various deposit and withdrawal methods, such as payment gateways and e-wallets. Fraud prevention and anti-money laundering measures are implemented to maintain data security and protect players. Live dealer games offer a more authentic casino experience, while user experience is enhanced through big data analytics and artificial intelligence.
  • Mobile gaming and real money gaming continue to dominate the market, with user behavior and player preferences shaping the industry. Player verification and loyalty programs are essential for player retention, while affiliate marketing and content marketing are used for customer acquisition. Esports betting and virtual sports have emerged as popular categories, with social media marketing and search engine optimization used for brand awareness. Risk management and data privacy are critical components of the online gambling ecosystem, with machine learning and data protection ensuring a secure environment for all players. Table games and sports betting remain staples in the online gambling market, with various deposit and withdrawal methods catering to diverse player needs.

What challenges does US Online Gambling Market face during the growth?

  • Security and credibility issues associated with online gambling is a key challenge affecting the market growth. The online gambling market in the US faces challenges related to security and credibility, which hinder its growth. Many gambling websites lack a dispute resolution framework, transparency in cash prize payouts, and adherence to fair and responsible gaming standards. These issues undermine the credibility of gambling operators and platform providers, impeding market penetration and discouraging new users. Furthermore, online gambling platforms are prime targets for cyber attacks and scams, posing significant risks to user data, including sensitive financial information. To mitigate these concerns, it is essential for gambling websites to prioritize responsible gaming, implement strong fraud prevention measures, and ensure secure payment gateways and user verification processes.
  • Additionally, software providers must focus on data security, data privacy, and data protection, utilizing advanced technologies such as artificial intelligence, machine learning, and big data analytics to enhance security and user experience. Effective customer support, loyalty programs, and brand awareness campaigns can also help build trust and retain players. Esports betting, virtual sports, and social media marketing offer opportunities for customer acquisition and engagement. Effective risk management, deposit and withdrawal methods, and content marketing strategies are also crucial for success in the online gambling market.

Exclusive Customer Landscape

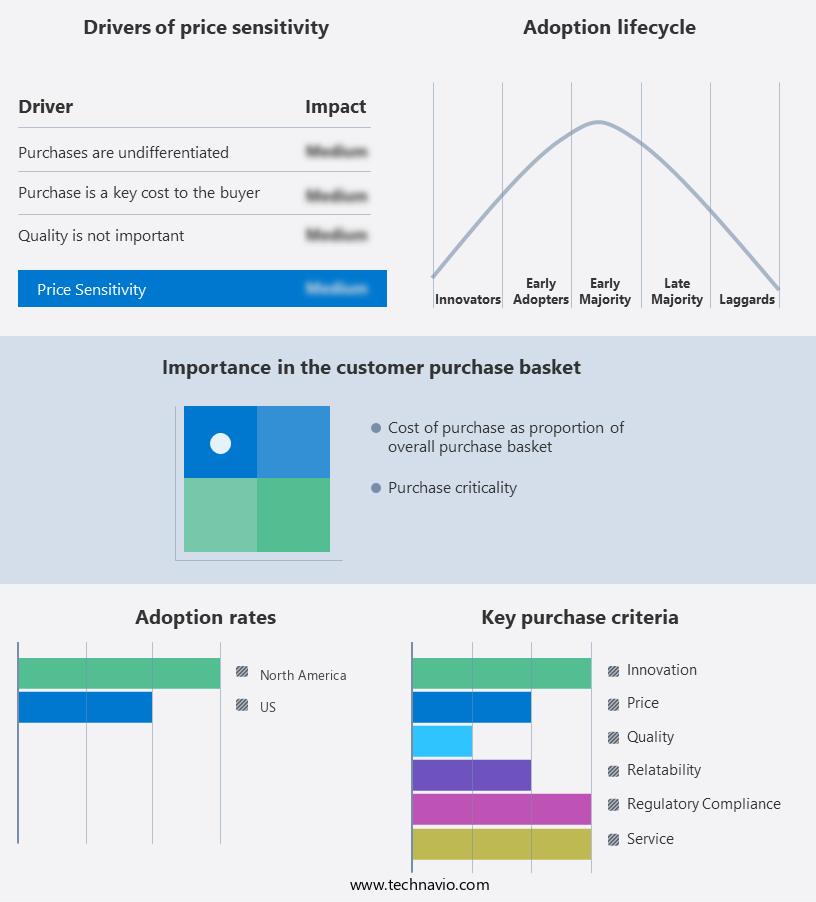
The market forecasting report includes the adoption lifecycle of the market, covering from the innovator's stage to the laggard's stage. It focuses on adoption rates in different regions based on penetration. Furthermore, the market report also includes key purchase criteria and drivers of price sensitivity to help companies evaluate and develop their market growth analysis strategies.

Online Gambling Market in US Share by Geography

 Customer Landscape

Key Companies & Market Insights

Companies are implementing various strategies, such as strategic alliances, market forecast , partnerships, mergers and acquisitions, geographical expansion, and product/service launches, to enhance their presence in the market.

Ballys Corp. -  The online gambling market encompasses various poker games, with the company providing access to popular options such as seven card stud, ring games, Omaha Hi Lo, and Omaha Hi.

The market research and growth report includes detailed analyses of the competitive landscape of the market and information about key companies, including:

  • Ballys Corp.
  • Bet365 Group Ltd.
  • BOVADA.LV
  • Caesars Entertainment Inc.
  • DraftKings Inc.
  • Flutter Entertainment Plc
  • Game Taco Inc.
  • Harrington Raceway and Casino
  • Infiniti Media Group Ltd.
  • Landrys LLC
  • Light and Wonder Inc.
  • MGM Resorts International
  • Midwest Gaming and Entertainment LLC
  • PENN Entertainment Inc.
  • Playtech Plc
  • Rational Intellectual Holdings Ltd.
  • Realtime Gaming
  • Resorts Digital Gaming LLC

Qualitative and quantitative analysis of companies has been conducted to help clients understand the wider business environment as well as the strengths and weaknesses of key market players. Data is qualitatively analyzed to categorize companies as pure play, category-focused, industry-focused, and diversified; it is quantitatively analyzed to categorize companies as dominant, leading, strong, tentative, and weak.

Research Analyst Overview

Online gambling has emerged as a significant market, offering players a convenient experience. The industry's growth is driven by several factors, including the continuous advancements in technology and the increasing demand for accessible and engaging forms of entertainment. One of the critical aspects of the online gambling market is game design. Software providers are continually innovating to create visually appealing and games, ensuring a positive user experience. Responsible gaming is another essential element, with operators implementing measures to promote safe gambling practices and prevent problem gambling. Customer support is a crucial component of any successful online gambling business. Key applications include real-time data analytics, personalized bonuses, loyalty programs, and live betting.

Providing efficient and effective support is essential for resolving player queries and concerns, ensuring customer satisfaction and loyalty. Market penetration is a key focus for operators, with efforts to expand into new markets and demographics. Anti-money laundering and fraud prevention are essential for maintaining the integrity of the online gambling market. Operators invest heavily in advanced technologies and processes to detect and prevent fraudulent activities, ensuring a secure and trustworthy environment for players. Live dealer games have gained significant popularity in recent years, offering a more authentic casino experience. Payment gateways and withdrawal methods are also essential, with operators providing a range of options to cater to different player preferences and locations. Prominent players, such as Flutter Entertainment PLC in Great Britain and Entain PLC, invest in product innovations, including AI algorithms, gamification features, and predictive analytics, to enhance user experience.

Player verification and data privacy are critical concerns for online gambling operators. Implementing verification processes and adhering to data protection regulations is essential for maintaining player trust and ensuring regulatory compliance. User engagement is a key focus for operators, with efforts to create personalized experiences and loyalty programs to retain players. Mobile gaming and real money gaming are also growing areas, with operators optimizing their platforms for mobile devices and offering various payment methods to cater to this market. Big data analytics and artificial intelligence are increasingly being used to gain insights into player behavior and preferences. In-play betting, esports betting, and augmented reality betting are emerging trends, as are skill-based games and social gambling. Mental health concerns, such as chronic stress and hypertension, are being addressed through responsible gambling tools and streaming content. Betting exchanges and payment gateways facilitate convenient payment options for users.

This data is used to improve user experience, optimize marketing efforts, and enhance risk management strategies. Brand awareness and content marketing are essential for customer acquisition and retention. Operators invest heavily in digital marketing channels, including social media and search engine optimization, to reach new audiences and engage existing players. Esports betting and game development are emerging areas of the online gambling market. Operators are partnering with game developers to offer integrated betting experiences and capitalize on the growing popularity of esports. Risk management is a critical aspect of the online gambling market, with operators implementing various strategies to mitigate risks and ensure regulatory compliance.

Withdrawal methods and deposit methods are essential components of risk management, with operators offering a range of options to cater to different player preferences and locations. Virtual sports and player retention are also key areas of focus for operators. Virtual sports offer a more convenient and accessible alternative to traditional sports betting, while player retention strategies aim to keep players engaged and loyal to the platform. In summary, the online gambling market is a dynamic and evolving industry, driven by technological advancements and changing player preferences. Operators are continually innovating to create engaging experiences, ensure regulatory compliance, and maintain a secure and trustworthy environment for players.

Market Scope

Report Coverage

Details

Page number

161

Base year

2024

Historic period

2019-2023

Forecast period

2025-2029

Growth momentum & CAGR

Accelerate at a CAGR of 11.6%

Market growth 2025-2029

USD 54.8 billion

Market structure

Fragmented

YoY growth 2024-2025(%)

10.1

Key countries

US

Competitive landscape

Leading Companies, Market Positioning of Companies, Competitive Strategies, and Industry Risks

Request Free Sample

What are the Key Data Covered in this Market Research and Growth Report?

  • CAGR of the market during the forecast period
  • Detailed information on factors that will drive the market growth and forecasting between 2025 and 2029
  • Precise estimation of the size of the market  and its contribution of the market in focus to the parent market
  • Accurate predictions about upcoming market growth and trends and changes in consumer behaviour
  • Growth of the market across US
  • Thorough analysis of the market's competitive landscape and detailed information about companies
  • Comprehensive analysis of factors that will challenge the growth of market companies

We can help! Our analysts can customize this market research report to meet your requirements. Get in touch

1 Executive Summary

  • 1.1 Market overview
    • Executive Summary - Chart on Market Overview
    • Executive Summary - Data Table on Market Overview
    • Executive Summary - Chart on Country Market Characteristics
    • Executive Summary - Chart on Market Segmentation by End-user
    • Executive Summary - Chart on Market Segmentation by Type
    • Executive Summary - Chart on Market Segmentation by Device
    • Executive Summary - Chart on Company Market Positioning

2 Technavio Analysis

  • 2.1 Analysis of price sensitivity, lifecycle, customer purchase basket, adoption rates, and purchase criteria
    • Analysis of price sensitivity, lifecycle, customer purchase basket, adoption rates, and purchase criteria
  • 2.2 Criticality of inputs and Factors of differentiation
    • Overview on criticality of inputs and factors of differentiation
  • 2.3 Factors of disruption
    • Overview on factors of disruption
  • 2.4 Impact of drivers and challenges
    • Impact of drivers and challenges in 2024 and 2029

3 Market Landscape

  • 3.1 Market ecosystem
    • Parent Market
    • Data Table on - Parent Market
  • 3.2 Market characteristics
    • Market characteristics analysis
  • 3.3 Value chain analysis
    • Value chain analysis

4 Market Sizing

  • 4.1 Market definition
    • Offerings of companies included in the market definition
  • 4.2 Market segment analysis
    • Market segments
  • 4.3 Market size 2024
    • 4.4 Market outlook: Forecast for 2024-2029
      • Chart on US - Market size and forecast 2024-2029 ($ billion)
      • Data Table on US - Market size and forecast 2024-2029 ($ billion)
      • Chart on US: Year-over-year growth 2024-2029 (%)
      • Data Table on US: Year-over-year growth 2024-2029 (%)

    5 Historic Market Size

    • 5.1 Online Gambling Market in US 2019 - 2023
      • Historic Market Size - Data Table on Online Gambling Market in US 2019 - 2023 ($ billion)
    • 5.2 End-user segment analysis 2019 - 2023
      • Historic Market Size - End-user Segment 2019 - 2023 ($ billion)
    • 5.3 Type segment analysis 2019 - 2023
      • Historic Market Size - Type Segment 2019 - 2023 ($ billion)
    • 5.4 Device segment analysis 2019 - 2023
      • Historic Market Size - Device Segment 2019 - 2023 ($ billion)

    6 Qualitative Analysis

    • 6.1 Impact of AI on Online Gambling Market in US

      7 Five Forces Analysis

      • 7.1 Five forces summary
        • Five forces analysis - Comparison between 2024 and 2029
      • 7.2 Bargaining power of buyers
        • Bargaining power of buyers - Impact of key factors 2024 and 2029
      • 7.3 Bargaining power of suppliers
        • Bargaining power of suppliers - Impact of key factors in 2024 and 2029
      • 7.4 Threat of new entrants
        • Threat of new entrants - Impact of key factors in 2024 and 2029
      • 7.5 Threat of substitutes
        • Threat of substitutes - Impact of key factors in 2024 and 2029
      • 7.6 Threat of rivalry
        • Threat of rivalry - Impact of key factors in 2024 and 2029
      • 7.7 Market condition
        • Chart on Market condition - Five forces 2024 and 2029

      8 Market Segmentation by End-user

      • 8.1 Market segments
        • Chart on End-user - Market share 2024-2029 (%)
        • Data Table on End-user - Market share 2024-2029 (%)
      • 8.2 Comparison by End-user
        • Chart on Comparison by End-user
        • Data Table on Comparison by End-user
      • 8.3 Casual gamblers - Market size and forecast 2024-2029
        • Chart on Casual gamblers - Market size and forecast 2024-2029 ($ billion)
        • Data Table on Casual gamblers - Market size and forecast 2024-2029 ($ billion)
        • Chart on Casual gamblers - Year-over-year growth 2024-2029 (%)
        • Data Table on Casual gamblers - Year-over-year growth 2024-2029 (%)
      • 8.4 Professional gamblers - Market size and forecast 2024-2029
        • Chart on Professional gamblers - Market size and forecast 2024-2029 ($ billion)
        • Data Table on Professional gamblers - Market size and forecast 2024-2029 ($ billion)
        • Chart on Professional gamblers - Year-over-year growth 2024-2029 (%)
        • Data Table on Professional gamblers - Year-over-year growth 2024-2029 (%)
      • 8.5 High-rollers - Market size and forecast 2024-2029
        • Chart on High-rollers - Market size and forecast 2024-2029 ($ billion)
        • Data Table on High-rollers - Market size and forecast 2024-2029 ($ billion)
        • Chart on High-rollers - Year-over-year growth 2024-2029 (%)
        • Data Table on High-rollers - Year-over-year growth 2024-2029 (%)
      • 8.6 Market opportunity by End-user
        • Market opportunity by End-user ($ billion)
        • Data Table on Market opportunity by End-user ($ billion)

      9 Market Segmentation by Type

      • 9.1 Market segments
        • Chart on Type - Market share 2024-2029 (%)
        • Data Table on Type - Market share 2024-2029 (%)
      • 9.2 Comparison by Type
        • Chart on Comparison by Type
        • Data Table on Comparison by Type
      • 9.3 Sports betting - Market size and forecast 2024-2029
        • Chart on Sports betting - Market size and forecast 2024-2029 ($ billion)
        • Data Table on Sports betting - Market size and forecast 2024-2029 ($ billion)
        • Chart on Sports betting - Year-over-year growth 2024-2029 (%)
        • Data Table on Sports betting - Year-over-year growth 2024-2029 (%)
      • 9.4 Casino games - Market size and forecast 2024-2029
        • Chart on Casino games - Market size and forecast 2024-2029 ($ billion)
        • Data Table on Casino games - Market size and forecast 2024-2029 ($ billion)
        • Chart on Casino games - Year-over-year growth 2024-2029 (%)
        • Data Table on Casino games - Year-over-year growth 2024-2029 (%)
      • 9.5 Poker - Market size and forecast 2024-2029
        • Chart on Poker - Market size and forecast 2024-2029 ($ billion)
        • Data Table on Poker - Market size and forecast 2024-2029 ($ billion)
        • Chart on Poker - Year-over-year growth 2024-2029 (%)
        • Data Table on Poker - Year-over-year growth 2024-2029 (%)
      • 9.6 Bingo - Market size and forecast 2024-2029
        • Chart on Bingo - Market size and forecast 2024-2029 ($ billion)
        • Data Table on Bingo - Market size and forecast 2024-2029 ($ billion)
        • Chart on Bingo - Year-over-year growth 2024-2029 (%)
        • Data Table on Bingo - Year-over-year growth 2024-2029 (%)
      • 9.7 Lottery - Market size and forecast 2024-2029
        • Chart on Lottery - Market size and forecast 2024-2029 ($ billion)
        • Data Table on Lottery - Market size and forecast 2024-2029 ($ billion)
        • Chart on Lottery - Year-over-year growth 2024-2029 (%)
        • Data Table on Lottery - Year-over-year growth 2024-2029 (%)
      • 9.8 Market opportunity by Type
        • Market opportunity by Type ($ billion)
        • Data Table on Market opportunity by Type ($ billion)

      10 Market Segmentation by Device

      • 10.1 Market segments
        • Chart on Device - Market share 2024-2029 (%)
        • Data Table on Device - Market share 2024-2029 (%)
      • 10.2 Comparison by Device
        • Chart on Comparison by Device
        • Data Table on Comparison by Device
      • 10.3 Desktop - Market size and forecast 2024-2029
        • Chart on Desktop - Market size and forecast 2024-2029 ($ billion)
        • Data Table on Desktop - Market size and forecast 2024-2029 ($ billion)
        • Chart on Desktop - Year-over-year growth 2024-2029 (%)
        • Data Table on Desktop - Year-over-year growth 2024-2029 (%)
      • 10.4 Mobile - Market size and forecast 2024-2029
        • Chart on Mobile - Market size and forecast 2024-2029 ($ billion)
        • Data Table on Mobile - Market size and forecast 2024-2029 ($ billion)
        • Chart on Mobile - Year-over-year growth 2024-2029 (%)
        • Data Table on Mobile - Year-over-year growth 2024-2029 (%)
      • 10.5 Market opportunity by Device
        • Market opportunity by Device ($ billion)
        • Data Table on Market opportunity by Device ($ billion)

      11 Customer Landscape

      • 11.1 Customer landscape overview
        • Analysis of price sensitivity, lifecycle, customer purchase basket, adoption rates, and purchase criteria

      12 Drivers, Challenges, and Opportunity/Restraints

      • 12.1 Market drivers
        • 12.2 Market challenges
          • 12.3 Impact of drivers and challenges
            • Impact of drivers and challenges in 2024 and 2029
          • 12.4 Market opportunities/restraints

            13 Competitive Landscape

            • 13.1 Overview
              • 13.2 Competitive Landscape
                • Overview on criticality of inputs and factors of differentiation
              • 13.3 Landscape disruption
                • Overview on factors of disruption
              • 13.4 Industry risks
                • Impact of key risks on business

              14 Competitive Analysis

              • 14.1 Companies profiled
                • Companies covered
              • 14.2 Company ranking index
                • Company ranking index
              • 14.3 Market positioning of companies
                • Matrix on companies position and classification
              • 14.4 Ballys Corp.
                • Ballys Corp. - Overview
                • Ballys Corp. - Business segments
                • Ballys Corp. - Key offerings
                • Ballys Corp. - Segment focus
                • SWOT
              • 14.5 BOVADA.LV
                • BOVADA.LV - Overview
                • BOVADA.LV - Product / Service
                • BOVADA.LV - Key offerings
                • SWOT
              • 14.6 Caesars Entertainment Inc.
                • Caesars Entertainment Inc. - Overview
                • Caesars Entertainment Inc. - Business segments
                • Caesars Entertainment Inc. - Key offerings
                • Caesars Entertainment Inc. - Segment focus
                • SWOT
              • 14.7 DraftKings Inc.
                • DraftKings Inc. - Overview
                • DraftKings Inc. - Business segments
                • DraftKings Inc. - Key offerings
                • DraftKings Inc. - Segment focus
                • SWOT
              • 14.8 Flutter Entertainment Plc
                • Flutter Entertainment Plc - Overview
                • Flutter Entertainment Plc - Business segments
                • Flutter Entertainment Plc - Key offerings
                • Flutter Entertainment Plc - Segment focus
                • SWOT
              • 14.9 Game Taco Inc.
                • Game Taco Inc. - Overview
                • Game Taco Inc. - Product / Service
                • Game Taco Inc. - Key offerings
                • SWOT
              • 14.10 Harrington Raceway and Casino
                • Harrington Raceway and Casino - Overview
                • Harrington Raceway and Casino - Product / Service
                • Harrington Raceway and Casino - Key offerings
                • SWOT
              • 14.11 Landrys LLC
                • Landrys LLC - Overview
                • Landrys LLC - Product / Service
                • Landrys LLC - Key offerings
                • SWOT
              • 14.12 Light and Wonder Inc.
                • Light and Wonder Inc. - Overview
                • Light and Wonder Inc. - Business segments
                • Light and Wonder Inc. - Key offerings
                • Light and Wonder Inc. - Segment focus
                • SWOT
              • 14.13 MGM Resorts International
                • MGM Resorts International - Overview
                • MGM Resorts International - Business segments
                • MGM Resorts International - Key offerings
                • MGM Resorts International - Segment focus
                • SWOT
              • 14.14 PENN Entertainment Inc.
                • PENN Entertainment Inc. - Overview
                • PENN Entertainment Inc. - Business segments
                • PENN Entertainment Inc. - Key offerings
                • PENN Entertainment Inc. - Segment focus
                • SWOT
              • 14.15 Playtech Plc
                • Playtech Plc - Overview
                • Playtech Plc - Business segments
                • Playtech Plc - Key offerings
                • Playtech Plc - Segment focus
                • SWOT
              • 14.16 Realtime Gaming
                • Realtime Gaming - Overview
                • Realtime Gaming - Product / Service
                • Realtime Gaming - Key offerings
                • SWOT
              • 14.17 Resorts Digital Gaming LLC
                • Resorts Digital Gaming LLC - Overview
                • Resorts Digital Gaming LLC - Product / Service
                • Resorts Digital Gaming LLC - Key offerings
                • SWOT

              15 Appendix

              • 15.1 Scope of the report
                • 15.2 Inclusions and exclusions checklist
                  • Inclusions checklist
                  • Exclusions checklist
                • 15.3 Currency conversion rates for US$
                  • Currency conversion rates for US$
                • 15.4 Research methodology
                  • Research methodology
                • 15.5 Data procurement
                  • Information sources
                • 15.6 Data validation
                  • Data validation
                • 15.7 Validation techniques employed for market sizing
                  • Validation techniques employed for market sizing
                • 15.8 Data synthesis
                  • Data synthesis
                • 15.9 360 degree market analysis
                  • 360 degree market analysis
                • 15.10 List of abbreviations
                  • List of abbreviations

                Research Methodology

                Technavio presents a detailed picture of the market by way of study, synthesis, and summation of data from multiple sources. The analysts have presented the various facets of the market with a particular focus on identifying the key industry influencers. The data thus presented is comprehensive, reliable, and the result of extensive research, both primary and secondary.

                INFORMATION SOURCES

                Primary sources

                • Manufacturers and suppliers
                • Channel partners
                • Industry experts
                • Strategic decision makers

                Secondary sources

                • Industry journals and periodicals
                • Government data
                • Financial reports of key industry players
                • Historical data
                • Press releases

                DATA ANALYSIS

                Data Synthesis

                • Collation of data
                • Estimation of key figures
                • Analysis of derived insights

                Data Validation

                • Triangulation with data models
                • Reference against proprietary databases
                • Corroboration with industry experts

                REPORT WRITING

                Qualitative

                • Market drivers
                • Market challenges
                • Market trends
                • Five forces analysis

                Quantitative

                • Market size and forecast
                • Market segmentation
                • Geographical insights
                • Competitive landscape

                Interested in this report?

                Get your sample now to see our research methodology and insights!

                Download Now

                Frequently Asked Questions

                Online Gambling market growth will increase by $ 54.8 bn during 2025-2029.

                The Online Gambling market is expected to grow at a CAGR of 11.6% during 2025-2029.

                Online Gambling market is segmented by End-user( Casual gamblers, Professional gamblers, High-rollers) Type( Sports betting, Casino games, Poker, Bingo, Lottery) Device( Desktop, Mobile)

                Ballys Corp., Bet365 Group Ltd., BOVADA.LV, Caesars Entertainment Inc., DraftKings Inc., Flutter Entertainment Plc, Game Taco Inc., Harrington Raceway and Casino, Infiniti Media Group Ltd., Landrys LLC, Light and Wonder Inc., MGM Resorts International, Midwest Gaming and Entertainment LLC, PENN Entertainment Inc., Playtech Plc, Rational Intellectual Holdings Ltd., Realtime Gaming, Resorts Digital Gaming LLC are a few of the key vendors in the Online Gambling market.

                North America will register the highest growth rate of 100% among the other regions. Therefore, the Online Gambling market in North America is expected to garner significant business opportunities for the vendors during the forecast period.

                US

                • Easing of government regulationsIn 2006 is the driving factor this market.
                • US Federal government passed the Unlawful Internet Gambling and Enforcement Act is the driving factor this market.
                • which banned all forms of online gambling. However is the driving factor this market.
                • in 2012 is the driving factor this market.
                • a new law was passed that allowed individual states to license online and mobile casinos is the driving factor this market.
                • sportsbooks is the driving factor this market.
                • and poker sites within their borders. As of 2023 is the driving factor this market.
                • New Jersey is the driving factor this market.
                • Delaware is the driving factor this market.
                • Michigan is the driving factor this market.
                • West Virginia is the driving factor this market.
                • Pennsylvania and Connecticut are allowed online gambling in US. With US Federal government relaxing the laws on online gambling is the driving factor this market.
                • more than five states in US were expected to legalize online gambling during the forecast period. Some of the benefits of legalizing online gambling are as follows:Revenue in the form of tax: The government can impose a high rate of tax on the companies of online gambling and use the revenue for the countrys development.Employment opportunities: Legalizing online gambling can create job opportunities for people.Online gambling can aid in overcoming budgetary gaps as it can strengthen the countrys economy further by increasing per capita income and employment opportunities.It can contribute toward societal welfare through NGOs is the driving factor this market.
                • the development of hospitals is the driving factor this market.
                • and educational institutions.Thus is the driving factor this market.
                • the easing of regulations on online gambling in the country is an important factor that will drive the growth of the market in focus during the forecast period. is the driving factor this market.

                The Online Gambling market vendors should focus on grabbing business opportunities from the Casual gamblers segment as it accounted for the largest market share in the base year.