Online Fitness Course Market Analysis, Size, and Forecast 2026-2030: North America (US, Canada, and Mexico), Europe (Germany, UK, and France), APAC (China, Japan, and India), South America (Brazil, Argentina, and Colombia), Middle East and Africa (Saudi Arabia, UAE, and Israel), and Rest of World (ROW)

Online Fitness Course Market Analysis, Size, and Forecast 2026-2030:
North America (US, Canada, and Mexico), Europe (Germany, UK, and France), APAC (China, Japan, and India), South America (Brazil, Argentina, and Colombia), Middle East and Africa (Saudi Arabia, UAE, and Israel), and Rest of World (ROW)

Published: Dec 2025 292 Pages SKU: IRTNTR80151

Market Overview at a Glance

$34.72 B
Market Opportunity
17.2%
CAGR 2025 - 2030
38.3%
North America Growth
$11.92 B
On demand courses segment 2024

Online Fitness Course Market Size 2026-2030

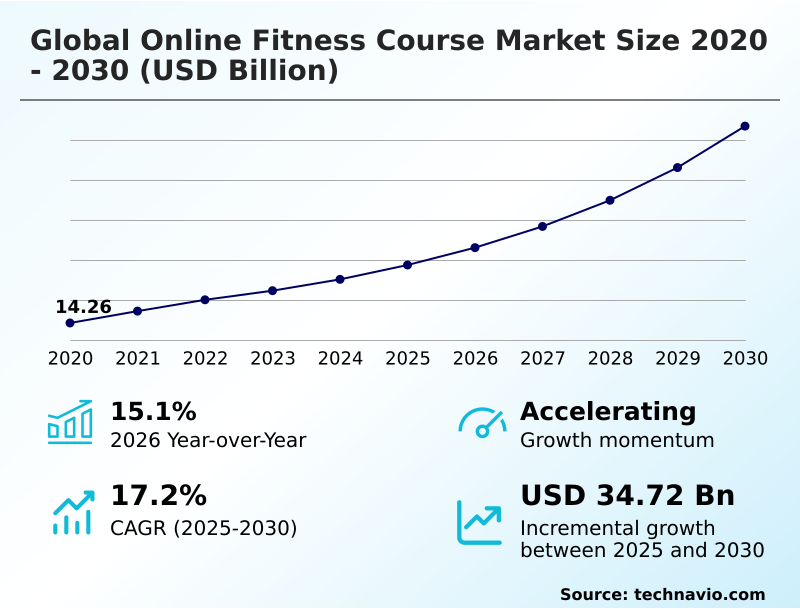
The online fitness course market size is valued to increase by USD 34.72 billion, at a CAGR of 17.2% from 2025 to 2030. Increasing global focus on health and wellness coupled with demand for convenience will drive the online fitness course market.

Major Market Trends & Insights

  • North America dominated the market and accounted for a 38.3% growth during the forecast period.
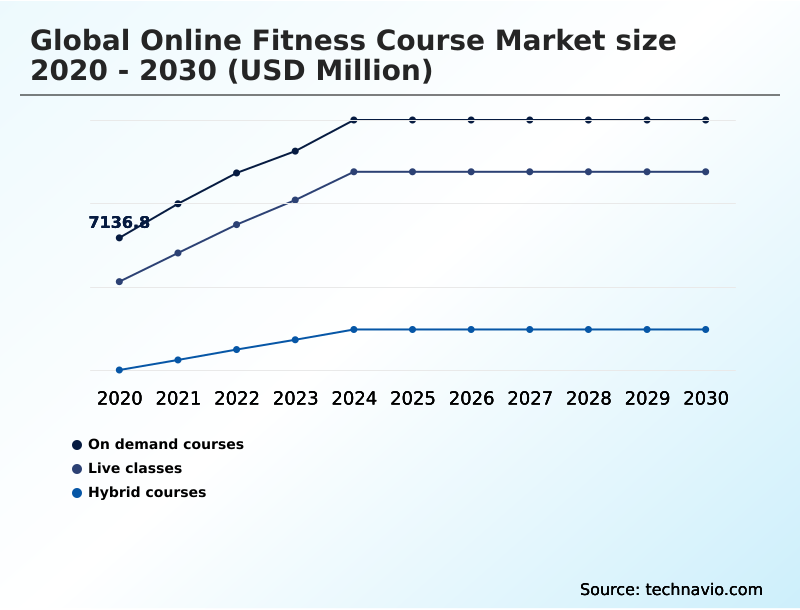
  • By Product - On demand courses segment was valued at USD 11.92 billion in 2024
  • By Revenue Stream - Subscription segment accounted for the largest market revenue share in 2024

Market Size & Forecast

  • Market Opportunities: USD 49.21 billion
  • Market Future Opportunities: USD 34.72 billion
  • CAGR from 2025 to 2030 : 17.2%

Market Summary

  • The Online Fitness Course Market is undergoing a significant transformation, driven by a consumer shift toward proactive health management and enabled by technological innovation. Platforms are moving beyond simple video libraries to become sophisticated wellness partners, leveraging data to offer hyper-personalized experiences.
  • This includes the use of artificial intelligence to create adaptive workout plans that adjust based on performance, a critical factor in maintaining user engagement. A key business application involves using behavioral analytics to identify users at risk of unsubscribing.
  • By proactively offering new content, personalized challenges, or instructor interactions, platforms can reduce churn by up to 20%, directly impacting lifetime value. The market is also shaped by the expansion into holistic wellness, integrating mental health and nutritional guidance.
  • However, providers face challenges in a saturated landscape, where high customer acquisition costs and the need for a continuous stream of fresh, high-quality content put pressure on profitability and necessitate robust operational strategies for long-term success.

What will be the Size of the Online Fitness Course Market during the forecast period?

Get Key Insights on Market Forecast (PDF) Request Free Sample

How is the Online Fitness Course Market Segmented?

The online fitness course industry research report provides comprehensive data (region-wise segment analysis), with forecasts and estimates in "USD million" for the period 2026-2030, as well as historical data from 2020-2024 for the following segments.

  • Product
    • On demand courses
    • Live classes
    • Hybrid courses
  • Revenue stream
    • Subscription
    • Freemium
    • One time purchase
    • Pay per class
  • Service type
    • Group
    • Solo
  • Geography
    • North America
      • US
      • Canada
      • Mexico
    • Europe
      • Germany
      • UK
      • France
    • APAC
      • China
      • Japan
      • India
    • South America
      • Brazil
      • Argentina
      • Colombia
    • Middle East and Africa
      • Saudi Arabia
      • UAE
      • Israel
    • Rest of World (ROW)

By Product Insights

The on demand courses segment is estimated to witness significant growth during the forecast period.

The on-demand courses segment is defined by its asynchronous delivery of content, offering unparalleled flexibility. This model centers on a vast on-demand video library, where success hinges on maintaining high-quality video streaming and user interest.

To combat the motivational challenges of solo workouts, platforms are integrating robust community engagement features and gamification mechanics to improve user engagement metrics.

The evolution of this segment includes sophisticated progressive workout programming and the introduction of real-time form correction technology using connected fitness hardware.

Effective virtual community building around instructor-led live sessions, even within an on-demand framework, has been shown to boost user retention by over 25%, turning passive viewing into an active, shared experience.

Request Free Sample

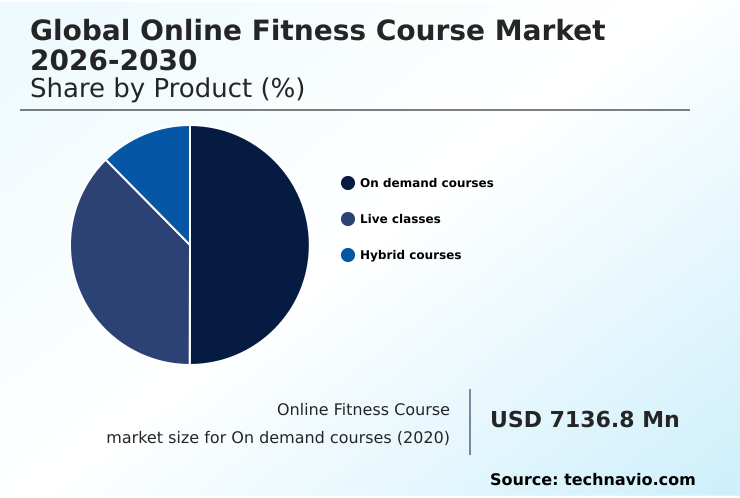
The On demand courses segment was valued at USD 11.92 billion in 2024 and showed a gradual increase during the forecast period.

Request Free Sample

Regional Analysis

North America is estimated to contribute 38.3% to the growth of the global market during the forecast period.Technavio’s analysts have elaborately explained the regional trends and drivers that shape the market during the forecast period.

See How Online Fitness Course Market Demand is Rising in North America Request Free Sample

The geographic landscape of the online fitness course market is diverse, with growth patterns varying by region. North America remains the largest market, driven by high disposable incomes and a mature corporate wellness integration culture.

However, the APAC region is experiencing the fastest expansion, with a growth acceleration of 18.2%, fueled by a mobile-first application design and increasing digital literacy.

In Europe, stringent data privacy regulations influence platform design, emphasizing cross-platform compatibility and secure asynchronous fitness experiences.

South America and the Middle East and Africa are emerging as significant opportunities, particularly through B2B2C distribution channels that leverage corporate partnerships to overcome individual subscription barriers.

The adoption of virtual reality fitness is also gaining traction globally, with some platforms seeing a 2x increase in session duration for immersive workouts compared to traditional video, indicating a shift in consumer engagement preferences.

Market Dynamics

Our researchers analyzed the data with 2025 as the base year, along with the key drivers, trends, and challenges. A holistic analysis of drivers will help companies refine their marketing strategies to gain a competitive advantage.

  • A comprehensive analysis of the Online Fitness Course Market requires comparing on-demand vs live streamed fitness to understand user preferences for flexibility versus real-time engagement. The use of AI for personalized workout plan generation has become a key differentiator, with platforms employing effective gamification strategies for fitness apps to improve motivation.
  • A primary operational focus is on reducing customer churn in digital fitness, a challenge compounded by the high cost of high-quality fitness content production and the complexities of music licensing for online workouts. Successful platforms excel at building community in a virtual fitness platform, understanding that social connection is vital for retention.
  • Integrating wearables for better fitness outcomes is now standard, but the impact of AI form correction on safety is an emerging area of innovation. For global reach, a mobile-first design for global fitness apps is non-negotiable. Strategically, the debate between freemium vs subscription models in fitness continues, with marketing strategies for online fitness courses becoming increasingly sophisticated.
  • There is also a notable trend in developing niche fitness content for seniors and addressing data privacy concerns in fitness applications.
  • For corporate wellness programs using online fitness, demonstrating a clear ROI of corporate wellness fitness platforms is critical, and providers must adhere to best practices for instructor-led virtual classes while closely monitoring user engagement metrics for fitness apps to refine their offerings and prove value.

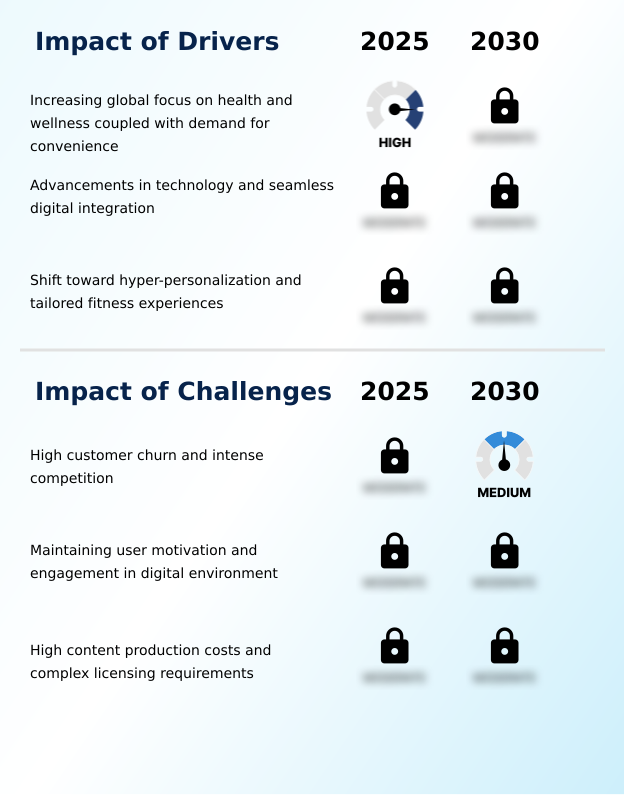
What are the key market drivers leading to the rise in the adoption of Online Fitness Course Industry?

  • The market is primarily driven by an increasing global focus on health and wellness, combined with strong consumer demand for convenient fitness solutions.

  • Technological advancement is the primary driver of market evolution, with data-driven personalization at its core. The deep wearable technology integration allows for a constant stream of real-time biometric data, creating a powerful real-time feedback loop for users.
  • Platforms leveraging machine learning algorithms to deliver adaptive workout plans see a 25% higher completion rate for multi-week programs.
  • This personalization is further enhanced by AI-powered computer vision for real-time form correction, a feature that has been shown to increase user confidence and reduce perceived injury risk by 50%. These personalized coaching algorithms are crucial for preventative health management.
  • The entire ecosystem, often built around connected fitness hardware with advanced biometric data integration, creates a highly effective and engaging experience that elevates the value proposition far beyond traditional fitness content.

What are the market trends shaping the Online Fitness Course Industry?

  • A key market trend is the integration of holistic wellness and mind-body content. This shift expands offerings beyond physical exercise to include mental and emotional well-being.

  • Market trends indicate a definitive shift toward platforms becoming all-encompassing wellness hubs, which increases digital ecosystem stickiness. The integration of holistic wellness content, including mind-body disciplines and nutritional guidance integration, is now a primary strategy. Platforms incorporating these elements report a 20% higher user session duration.
  • Concurrently, the rise of the hybrid fitness ecosystem, which blends digital services with physical access through phygital fitness models, is addressing consumer demand for flexibility. This approach has been shown to reduce churn by up to 15% compared to digital-only offerings.
  • Furthermore, the push toward a more immersive workout experience is accelerating, with advancements in augmented reality fitness and spatial computing workouts promising to redefine user engagement. Early adopters of these technologies are seeing a 30% increase in user interaction within the app, signaling a strong future demand for digital therapeutic solutions that are both effective and engaging.

What challenges does the Online Fitness Course Industry face during its growth?

  • High customer churn rates and intense competition present a key challenge affecting sustainable industry growth.

  • The market faces significant financial and operational pressures, primarily the high customer churn rate inherent in the subscription-based business model, which can be 30% higher than in other digital subscription sectors. This is compounded by a steep customer acquisition cost in a saturated market.
  • To combat this, platforms focus on user retention strategies, but this requires a relentless and expensive content production pipeline to keep offerings fresh. The complexities of music licensing management add another layer of recurring, non-negotiable operational expense. While a freemium conversion funnel can lower initial acquisition costs, converting free users to paid subscribers remains a challenge.
  • Platforms are therefore building features that increase social switching costs, such as robust tools for user-generated content moderation and sophisticated content curation engines, though this requires continuous investment and innovation to be effective.

Exclusive Technavio Analysis on Customer Landscape

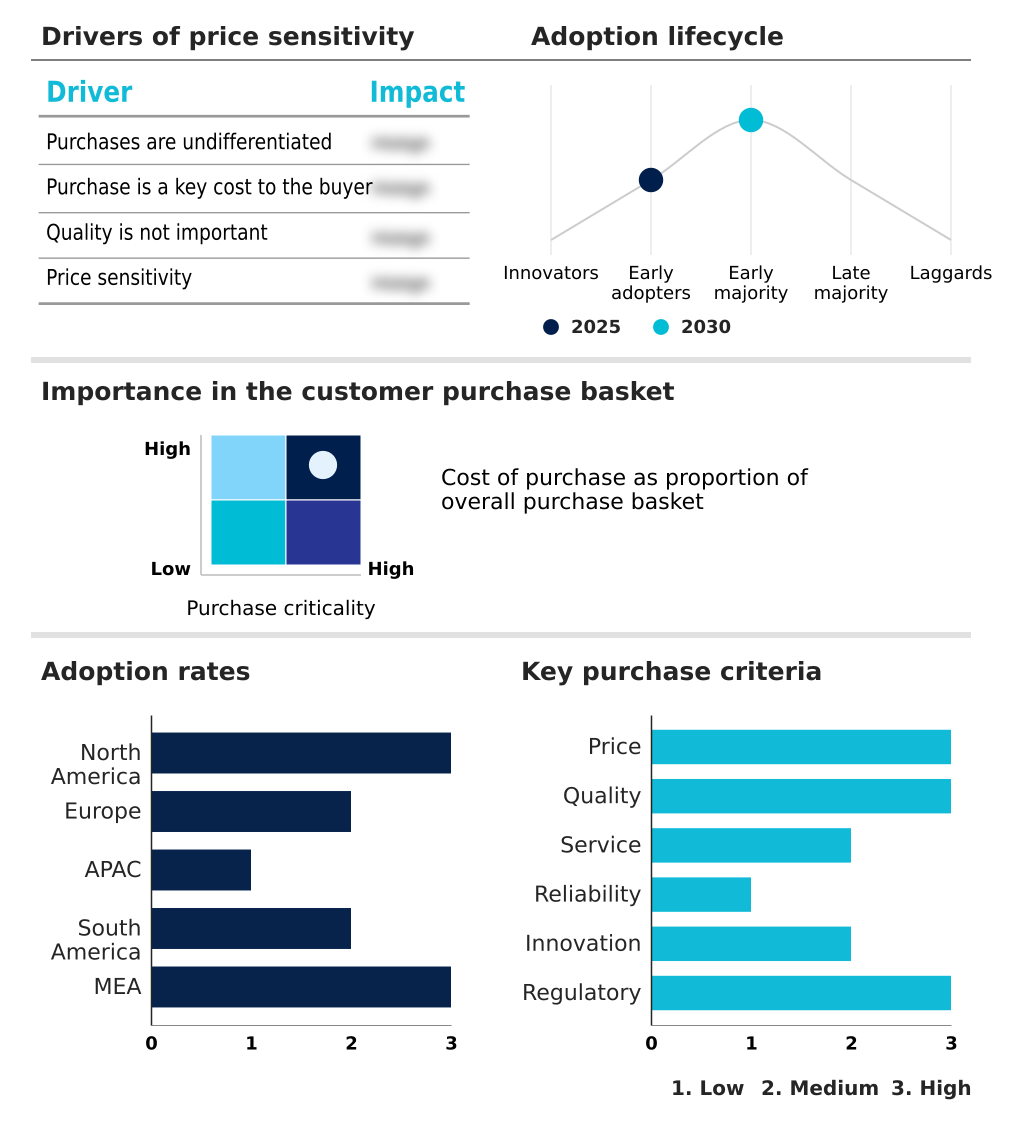
The online fitness course market forecasting report includes the adoption lifecycle of the market, covering from the innovator’s stage to the laggard’s stage. It focuses on adoption rates in different regions based on penetration. Furthermore, the online fitness course market report also includes key purchase criteria and drivers of price sensitivity to help companies evaluate and develop their market growth analysis strategies.

Customer Landscape of Online Fitness Course Industry

Competitive Landscape

Companies are implementing various strategies, such as strategic alliances, online fitness course market forecast, partnerships, mergers and acquisitions, geographical expansion, and product/service launches, to enhance their presence in the industry.

Alo Moves - Analyst perspective highlights the pivot toward data-driven personalization, integrating real-time biometric feedback with adaptive workout programming to maximize user engagement.

The industry research and growth report includes detailed analyses of the competitive landscape of the market and information about key companies, including:

  • Alo Moves
  • Apple Inc.
  • ClassPass
  • Daily Burn Inc.
  • Fitbit LLC
  • FitXR
  • Glo Digital Inc.
  • Les Mills International Ltd.
  • Lift Brands Inc.
  • MINDBODY Inc.
  • Myfitnesspal
  • Nike Inc.
  • Peloton Interactive Inc
  • REH-FIT
  • Sworkit
  • The Beachbody Company
  • Under Armour Inc.
  • Wexer

Qualitative and quantitative analysis of companies has been conducted to help clients understand the wider business environment as well as the strengths and weaknesses of key industry players. Data is qualitatively analyzed to categorize companies as pure play, category-focused, industry-focused, and diversified; it is quantitatively analyzed to categorize companies as dominant, leading, strong, tentative, and weak.

Recent Development and News in Online fitness course market

  • In October 2024, FitSphere Dynamics announced its acquisition of mindfulness app SereneMind for USD 150 million, integrating guided meditation and mental wellness content into its core fitness platform.
  • In January 2025, OmniFit, a leading digital-first fitness provider, launched a strategic partnership with global hotel giant Prestige Stays to offer in-room workouts and exclusive gym access to travelers, expanding its hybrid model significantly.
  • In March 2025, virtual reality fitness pioneer Vortex Fit secured USD 75 million in a Series C funding round led by Innovate Capital, aimed at developing next-generation haptic feedback suits for a fully immersive workout experience, as reported by major financial news outlets.
  • In April 2025, wellness aggregator ConnectHealth announced it has signed a multi-year agreement to become the exclusive digital wellness provider for Global Corp Inc., granting platform access to over 200,000 employees worldwide.

Dive into Technavio’s robust research methodology, blending expert interviews, extensive data synthesis, and validated models for unparalleled Online Fitness Course Market insights. See full methodology.

Market Scope
Page number 292
Base year 2025
Historic period 2020-2024
Forecast period 2026-2030
Growth momentum & CAGR Accelerate at a CAGR of 17.2%
Market growth 2026-2030 USD 34720.0 million
Market structure Fragmented
YoY growth 2025-2026(%) 15.1%
Key countries US, Canada, Mexico, Germany, UK, France, Italy, Spain, The Netherlands, China, Japan, India, South Korea, Australia, Indonesia, Brazil, Argentina, Colombia, Saudi Arabia, UAE, Israel, South Africa and Turkey
Competitive landscape Leading Companies, Market Positioning of Companies, Competitive Strategies, and Industry Risks

Request Free Sample

Research Analyst Overview

  • The online fitness course market is evolving into a sophisticated, technology-driven industry. The core offering has shifted from a simple on-demand video library to a dynamic service featuring live-streamed interactive classes and asynchronous fitness experiences. A key boardroom-level consideration is the strategic pivot toward holistic wellness content, which directly impacts product development roadmaps and M&A strategies.
  • This trend includes integrating mind-body disciplines, nutritional guidance integration, and sleep tracking functionality, transforming platforms into comprehensive health hubs. Technologically, the use of AI-powered computer vision for real-time form correction and personalized coaching algorithms that create adaptive workout plans based on real-time biometric data from wearable technology integration is setting new standards. This data-driven approach enhances the immersive workout experience.
  • Operationally, managing the content production pipeline and complex music licensing management are critical. Success hinges on robust community engagement features and mitigating high customer churn rates associated with the subscription-based business model, which often involves a high customer acquisition cost.
  • The emergence of the digital drop-in model and phygital fitness models offers new revenue streams, while corporate wellness integration continues to be a significant growth channel, with platforms that offer such integrations seeing a 15% higher B2B retention rate.

What are the Key Data Covered in this Online Fitness Course Market Research and Growth Report?

  • What is the expected growth of the Online Fitness Course Market between 2026 and 2030?

    • USD 34.72 billion, at a CAGR of 17.2%

  • What segmentation does the market report cover?

    • The report is segmented by Product (On demand courses, Live classes, and Hybrid courses), Revenue Stream (Subscription, Freemium, One time purchase, and Pay per class), Service Type (Group, and Solo) and Geography (North America, Europe, APAC, South America, Middle East and Africa)

  • Which regions are analyzed in the report?

    • North America, Europe, APAC, South America and Middle East and Africa

  • What are the key growth drivers and market challenges?

    • Increasing global focus on health and wellness coupled with demand for convenience, High customer churn and intense competition

  • Who are the major players in the Online Fitness Course Market?

    • Alo Moves, Apple Inc., ClassPass, Daily Burn Inc., Fitbit LLC, FitXR, Glo Digital Inc., Les Mills International Ltd., Lift Brands Inc., MINDBODY Inc., Myfitnesspal, Nike Inc., Peloton Interactive Inc, REH-FIT, Sworkit, The Beachbody Company, Under Armour Inc. and Wexer

Market Research Insights

  • The market's dynamism is fueled by a strategic push toward creating sticky digital ecosystems. Effective user retention strategies are paramount, with platforms that employ sophisticated data-driven personalization showing a 30% higher user engagement rate than those with static content.
  • The integration of a real-time feedback loop, often powered by machine learning algorithms that analyze biometric data integration from wearables, allows for adaptive adjustments that can improve workout consistency by 40%. This focus on preventative health management is broadening market appeal.
  • To secure their user base, providers are architecting a high degree of digital ecosystem stickiness, making the cost and effort of switching platforms a significant consideration for consumers, thereby building a more defensible market position.

We can help! Our analysts can customize this online fitness course market research report to meet your requirements.

Get in touch

1. Executive Summary

1.1 Market overview

Executive Summary - Chart on Market Overview
Executive Summary - Data Table on Market Overview
Executive Summary - Chart on Global Market Characteristics
Executive Summary - Chart on Market by Geography
Executive Summary - Chart on Market Segmentation by Product
Executive Summary - Chart on Market Segmentation by Revenue Stream
Executive Summary - Chart on Market Segmentation by Service Type
Executive Summary - Chart on Incremental Growth
Executive Summary - Data Table on Incremental Growth
Executive Summary - Chart on Company Market Positioning

2. Technavio Analysis

2.1 Analysis of price sensitivity, lifecycle, customer purchase basket, adoption rates, and purchase criteria

2.2 Criticality of inputs and Factors of differentiation

Chart on Overview on criticality of inputs and factors of differentiation

2.3 Factors of disruption

Chart on Overview on factors of disruption

2.4 Impact of drivers and challenges

Chart on Impact of drivers and challenges in 2025 and 2030

3. Market Landscape

3.1 Market ecosystem

Chart on Parent Market
Data Table on - Parent Market

3.2 Market characteristics

Chart on Market characteristics analysis

3.3 Value chain analysis

Chart on Value chain analysis

4. Market Sizing

4.1 Market definition

Data Table on Offerings of companies included in the market definition

4.2 Market segment analysis

Market segments

4.3 Market size 2025

4.4 Market outlook: Forecast for 2025-2030

Chart on Global - Market size and forecast 2025-2030 ($ million)
Data Table on Global - Market size and forecast 2025-2030 ($ million)
Chart on Global Market: Year-over-year growth 2025-2030 (%)
Data Table on Global Market: Year-over-year growth 2025-2030 (%)

5. Historic Market Size

5.1 Global Online Fitness Course Market 2020 - 2024

Historic Market Size - Data Table on Global Online Fitness Course Market 2020 - 2024 ($ million)

5.2 Product segment analysis 2020 - 2024

Historic Market Size - Product Segment 2020 - 2024 ($ million)

5.3 Revenue Stream segment analysis 2020 - 2024

Historic Market Size - Revenue Stream Segment 2020 - 2024 ($ million)

5.4 Service Type segment analysis 2020 - 2024

Historic Market Size - Service Type Segment 2020 - 2024 ($ million)

5.5 Geography segment analysis 2020 - 2024

Historic Market Size - Geography Segment 2020 - 2024 ($ million)

5.6 Country segment analysis 2020 - 2024

Historic Market Size - Country Segment 2020 - 2024 ($ million)

6. Qualitative Analysis

6.1 The AI impact on global online fitness course market

7. Five Forces Analysis

7.1 Five forces summary

Five forces analysis - Comparison between 2025 and 2030

7.2 Bargaining power of buyers

Bargaining power of buyers - Impact of key factors 2025 and 2030

7.3 Bargaining power of suppliers

Bargaining power of suppliers - Impact of key factors in 2025 and 2030

7.4 Threat of new entrants

Threat of new entrants - Impact of key factors in 2025 and 2030

7.5 Threat of substitutes

Threat of substitutes - Impact of key factors in 2025 and 2030

7.6 Threat of rivalry

Threat of rivalry - Impact of key factors in 2025 and 2030

7.7 Market condition

Chart on Market condition - Five forces 2025 and 2030

8. Market Segmentation by Product

8.1 Market segments

Chart on Product - Market share 2025-2030 (%)
Data Table on Product - Market share 2025-2030 (%)

8.2 Comparison by Product

Chart on Comparison by Product
Data Table on Comparison by Product

8.3 On demand courses - Market size and forecast 2025-2030

Chart on On demand courses - Market size and forecast 2025-2030 ($ million)
Data Table on On demand courses - Market size and forecast 2025-2030 ($ million)
Chart on On demand courses - Year-over-year growth 2025-2030 (%)
Data Table on On demand courses - Year-over-year growth 2025-2030 (%)

8.4 Live classes - Market size and forecast 2025-2030

Chart on Live classes - Market size and forecast 2025-2030 ($ million)
Data Table on Live classes - Market size and forecast 2025-2030 ($ million)
Chart on Live classes - Year-over-year growth 2025-2030 (%)
Data Table on Live classes - Year-over-year growth 2025-2030 (%)

8.5 Hybrid courses - Market size and forecast 2025-2030

Chart on Hybrid courses - Market size and forecast 2025-2030 ($ million)
Data Table on Hybrid courses - Market size and forecast 2025-2030 ($ million)
Chart on Hybrid courses - Year-over-year growth 2025-2030 (%)
Data Table on Hybrid courses - Year-over-year growth 2025-2030 (%)

8.6 Market opportunity by Product

Market opportunity by Product ($ million)
Data Table on Market opportunity by Product ($ million)

9. Market Segmentation by Revenue Stream

9.1 Market segments

Chart on Revenue Stream - Market share 2025-2030 (%)
Data Table on Revenue Stream - Market share 2025-2030 (%)

9.2 Comparison by Revenue Stream

Chart on Comparison by Revenue Stream
Data Table on Comparison by Revenue Stream

9.3 Subscription - Market size and forecast 2025-2030

Chart on Subscription - Market size and forecast 2025-2030 ($ million)
Data Table on Subscription - Market size and forecast 2025-2030 ($ million)
Chart on Subscription - Year-over-year growth 2025-2030 (%)
Data Table on Subscription - Year-over-year growth 2025-2030 (%)

9.4 Freemium - Market size and forecast 2025-2030

Chart on Freemium - Market size and forecast 2025-2030 ($ million)
Data Table on Freemium - Market size and forecast 2025-2030 ($ million)
Chart on Freemium - Year-over-year growth 2025-2030 (%)
Data Table on Freemium - Year-over-year growth 2025-2030 (%)

9.5 One time purchase - Market size and forecast 2025-2030

Chart on One time purchase - Market size and forecast 2025-2030 ($ million)
Data Table on One time purchase - Market size and forecast 2025-2030 ($ million)
Chart on One time purchase - Year-over-year growth 2025-2030 (%)
Data Table on One time purchase - Year-over-year growth 2025-2030 (%)

9.6 Pay per class - Market size and forecast 2025-2030

Chart on Pay per class - Market size and forecast 2025-2030 ($ million)
Data Table on Pay per class - Market size and forecast 2025-2030 ($ million)
Chart on Pay per class - Year-over-year growth 2025-2030 (%)
Data Table on Pay per class - Year-over-year growth 2025-2030 (%)

9.7 Market opportunity by Revenue Stream

Market opportunity by Revenue Stream ($ million)
Data Table on Market opportunity by Revenue Stream ($ million)

10. Market Segmentation by Service Type

10.1 Market segments

Chart on Service Type - Market share 2025-2030 (%)
Data Table on Service Type - Market share 2025-2030 (%)

10.2 Comparison by Service Type

Chart on Comparison by Service Type
Data Table on Comparison by Service Type

10.3 Group - Market size and forecast 2025-2030

Chart on Group - Market size and forecast 2025-2030 ($ million)
Data Table on Group - Market size and forecast 2025-2030 ($ million)
Chart on Group - Year-over-year growth 2025-2030 (%)
Data Table on Group - Year-over-year growth 2025-2030 (%)

10.4 Solo - Market size and forecast 2025-2030

Chart on Solo - Market size and forecast 2025-2030 ($ million)
Data Table on Solo - Market size and forecast 2025-2030 ($ million)
Chart on Solo - Year-over-year growth 2025-2030 (%)
Data Table on Solo - Year-over-year growth 2025-2030 (%)

10.5 Market opportunity by Service Type

Market opportunity by Service Type ($ million)
Data Table on Market opportunity by Service Type ($ million)

11. Customer Landscape

11.1 Customer landscape overview

Analysis of price sensitivity, lifecycle, customer purchase basket, adoption rates, and purchase criteria

12. Geographic Landscape

12.1 Geographic segmentation

Chart on Market share by geography 2025-2030 (%)
Data Table on Market share by geography 2025-2030 (%)

12.2 Geographic comparison

Chart on Geographic comparison
Data Table on Geographic comparison

12.3 North America - Market size and forecast 2025-2030

Chart on North America - Market size and forecast 2025-2030 ($ million)
Data Table on North America - Market size and forecast 2025-2030 ($ million)
Chart on North America - Year-over-year growth 2025-2030 (%)
Data Table on North America - Year-over-year growth 2025-2030 (%)
Chart on Regional Comparison - North America
Data Table on Regional Comparison - North America

12.3.1 US - Market size and forecast 2025-2030

Chart on US - Market size and forecast 2025-2030 ($ million)
Data Table on US - Market size and forecast 2025-2030 ($ million)
Chart on US - Year-over-year growth 2025-2030 (%)
Data Table on US - Year-over-year growth 2025-2030 (%)

12.3.2 Canada - Market size and forecast 2025-2030

Chart on Canada - Market size and forecast 2025-2030 ($ million)
Data Table on Canada - Market size and forecast 2025-2030 ($ million)
Chart on Canada - Year-over-year growth 2025-2030 (%)
Data Table on Canada - Year-over-year growth 2025-2030 (%)

12.3.3 Mexico - Market size and forecast 2025-2030

Chart on Mexico - Market size and forecast 2025-2030 ($ million)
Data Table on Mexico - Market size and forecast 2025-2030 ($ million)
Chart on Mexico - Year-over-year growth 2025-2030 (%)
Data Table on Mexico - Year-over-year growth 2025-2030 (%)

12.4 Europe - Market size and forecast 2025-2030

Chart on Europe - Market size and forecast 2025-2030 ($ million)
Data Table on Europe - Market size and forecast 2025-2030 ($ million)
Chart on Europe - Year-over-year growth 2025-2030 (%)
Data Table on Europe - Year-over-year growth 2025-2030 (%)
Chart on Regional Comparison - Europe
Data Table on Regional Comparison - Europe

12.4.1 Germany - Market size and forecast 2025-2030

Chart on Germany - Market size and forecast 2025-2030 ($ million)
Data Table on Germany - Market size and forecast 2025-2030 ($ million)
Chart on Germany - Year-over-year growth 2025-2030 (%)
Data Table on Germany - Year-over-year growth 2025-2030 (%)

12.4.2 UK - Market size and forecast 2025-2030

Chart on UK - Market size and forecast 2025-2030 ($ million)
Data Table on UK - Market size and forecast 2025-2030 ($ million)
Chart on UK - Year-over-year growth 2025-2030 (%)
Data Table on UK - Year-over-year growth 2025-2030 (%)

12.4.3 France - Market size and forecast 2025-2030

Chart on France - Market size and forecast 2025-2030 ($ million)
Data Table on France - Market size and forecast 2025-2030 ($ million)
Chart on France - Year-over-year growth 2025-2030 (%)
Data Table on France - Year-over-year growth 2025-2030 (%)

12.4.4 Italy - Market size and forecast 2025-2030

Chart on Italy - Market size and forecast 2025-2030 ($ million)
Data Table on Italy - Market size and forecast 2025-2030 ($ million)
Chart on Italy - Year-over-year growth 2025-2030 (%)
Data Table on Italy - Year-over-year growth 2025-2030 (%)

12.4.5 Spain - Market size and forecast 2025-2030

Chart on Spain - Market size and forecast 2025-2030 ($ million)
Data Table on Spain - Market size and forecast 2025-2030 ($ million)
Chart on Spain - Year-over-year growth 2025-2030 (%)
Data Table on Spain - Year-over-year growth 2025-2030 (%)

12.4.6 The Netherlands - Market size and forecast 2025-2030

Chart on The Netherlands - Market size and forecast 2025-2030 ($ million)
Data Table on The Netherlands - Market size and forecast 2025-2030 ($ million)
Chart on The Netherlands - Year-over-year growth 2025-2030 (%)
Data Table on The Netherlands - Year-over-year growth 2025-2030 (%)

12.5 APAC - Market size and forecast 2025-2030

Chart on APAC - Market size and forecast 2025-2030 ($ million)
Data Table on APAC - Market size and forecast 2025-2030 ($ million)
Chart on APAC - Year-over-year growth 2025-2030 (%)
Data Table on APAC - Year-over-year growth 2025-2030 (%)
Chart on Regional Comparison - APAC
Data Table on Regional Comparison - APAC

12.5.1 China - Market size and forecast 2025-2030

Chart on China - Market size and forecast 2025-2030 ($ million)
Data Table on China - Market size and forecast 2025-2030 ($ million)
Chart on China - Year-over-year growth 2025-2030 (%)
Data Table on China - Year-over-year growth 2025-2030 (%)

12.5.2 Japan - Market size and forecast 2025-2030

Chart on Japan - Market size and forecast 2025-2030 ($ million)
Data Table on Japan - Market size and forecast 2025-2030 ($ million)
Chart on Japan - Year-over-year growth 2025-2030 (%)
Data Table on Japan - Year-over-year growth 2025-2030 (%)

12.5.3 India - Market size and forecast 2025-2030

Chart on India - Market size and forecast 2025-2030 ($ million)
Data Table on India - Market size and forecast 2025-2030 ($ million)
Chart on India - Year-over-year growth 2025-2030 (%)
Data Table on India - Year-over-year growth 2025-2030 (%)

12.5.4 South Korea - Market size and forecast 2025-2030

Chart on South Korea - Market size and forecast 2025-2030 ($ million)
Data Table on South Korea - Market size and forecast 2025-2030 ($ million)
Chart on South Korea - Year-over-year growth 2025-2030 (%)
Data Table on South Korea - Year-over-year growth 2025-2030 (%)

12.5.5 Australia - Market size and forecast 2025-2030

Chart on Australia - Market size and forecast 2025-2030 ($ million)
Data Table on Australia - Market size and forecast 2025-2030 ($ million)
Chart on Australia - Year-over-year growth 2025-2030 (%)
Data Table on Australia - Year-over-year growth 2025-2030 (%)

12.5.6 Indonesia - Market size and forecast 2025-2030

Chart on Indonesia - Market size and forecast 2025-2030 ($ million)
Data Table on Indonesia - Market size and forecast 2025-2030 ($ million)
Chart on Indonesia - Year-over-year growth 2025-2030 (%)
Data Table on Indonesia - Year-over-year growth 2025-2030 (%)

12.6 South America - Market size and forecast 2025-2030

Chart on South America - Market size and forecast 2025-2030 ($ million)
Data Table on South America - Market size and forecast 2025-2030 ($ million)
Chart on South America - Year-over-year growth 2025-2030 (%)
Data Table on South America - Year-over-year growth 2025-2030 (%)
Chart on Regional Comparison - South America
Data Table on Regional Comparison - South America

12.6.1 Brazil - Market size and forecast 2025-2030

Chart on Brazil - Market size and forecast 2025-2030 ($ million)
Data Table on Brazil - Market size and forecast 2025-2030 ($ million)
Chart on Brazil - Year-over-year growth 2025-2030 (%)
Data Table on Brazil - Year-over-year growth 2025-2030 (%)

12.6.2 Argentina - Market size and forecast 2025-2030

Chart on Argentina - Market size and forecast 2025-2030 ($ million)
Data Table on Argentina - Market size and forecast 2025-2030 ($ million)
Chart on Argentina - Year-over-year growth 2025-2030 (%)
Data Table on Argentina - Year-over-year growth 2025-2030 (%)

12.6.3 Colombia - Market size and forecast 2025-2030

Chart on Colombia - Market size and forecast 2025-2030 ($ million)
Data Table on Colombia - Market size and forecast 2025-2030 ($ million)
Chart on Colombia - Year-over-year growth 2025-2030 (%)
Data Table on Colombia - Year-over-year growth 2025-2030 (%)

12.7 Middle East and Africa - Market size and forecast 2025-2030

Chart on Middle East and Africa - Market size and forecast 2025-2030 ($ million)
Data Table on Middle East and Africa - Market size and forecast 2025-2030 ($ million)
Chart on Middle East and Africa - Year-over-year growth 2025-2030 (%)
Data Table on Middle East and Africa - Year-over-year growth 2025-2030 (%)
Chart on Regional Comparison - Middle East and Africa
Data Table on Regional Comparison - Middle East and Africa

12.7.1 Saudi Arabia - Market size and forecast 2025-2030

Chart on Saudi Arabia - Market size and forecast 2025-2030 ($ million)
Data Table on Saudi Arabia - Market size and forecast 2025-2030 ($ million)
Chart on Saudi Arabia - Year-over-year growth 2025-2030 (%)
Data Table on Saudi Arabia - Year-over-year growth 2025-2030 (%)

12.7.2 UAE - Market size and forecast 2025-2030

Chart on UAE - Market size and forecast 2025-2030 ($ million)
Data Table on UAE - Market size and forecast 2025-2030 ($ million)
Chart on UAE - Year-over-year growth 2025-2030 (%)
Data Table on UAE - Year-over-year growth 2025-2030 (%)

12.7.3 Israel - Market size and forecast 2025-2030

Chart on Israel - Market size and forecast 2025-2030 ($ million)
Data Table on Israel - Market size and forecast 2025-2030 ($ million)
Chart on Israel - Year-over-year growth 2025-2030 (%)
Data Table on Israel - Year-over-year growth 2025-2030 (%)

12.7.4 South Africa - Market size and forecast 2025-2030

Chart on South Africa - Market size and forecast 2025-2030 ($ million)
Data Table on South Africa - Market size and forecast 2025-2030 ($ million)
Chart on South Africa - Year-over-year growth 2025-2030 (%)
Data Table on South Africa - Year-over-year growth 2025-2030 (%)

12.7.5 Turkey - Market size and forecast 2025-2030

Chart on Turkey - Market size and forecast 2025-2030 ($ million)
Data Table on Turkey - Market size and forecast 2025-2030 ($ million)
Chart on Turkey - Year-over-year growth 2025-2030 (%)
Data Table on Turkey - Year-over-year growth 2025-2030 (%)

12.8 Market opportunity by geography

Market opportunity by geography ($ million)
Data Tables on Market opportunity by geography ($ million)

13. Drivers, Challenges, and Opportunity

13.1 Market drivers

Increasing global focus on health and wellness coupled with demand for convenience
Advancements in technology and seamless digital integration
Shift toward hyper-personalization and tailored fitness experiences

13.2 Market challenges

High customer churn and intense competition
Maintaining user motivation and engagement in digital environment
High content production costs and complex licensing requirements

13.3 Impact of drivers and challenges

Impact of drivers and challenges in 2025 and 2030

13.4 Market opportunities

Integration of holistic wellness and mind-body content
Advanced gamification and community building to drive engagement
Rise of hybrid phygital fitness models

14. Competitive Landscape

14.1 Overview

14.2

Overview on criticality of inputs and factors of differentiation

14.3 Landscape disruption

Overview on factors of disruption

14.4 Industry risks

Impact of key risks on business

15. Competitive Analysis

15.1 Companies profiled

Companies covered

15.2 Company ranking index

15.3 Market positioning of companies

Matrix on companies position and classification

15.4 Alo Moves

Alo Moves - Overview
Alo Moves - Product / Service
Alo Moves - Key offerings
SWOT

15.5 Apple Inc.

Apple Inc. - Overview
Apple Inc. - Business segments
Apple Inc. - Key news
Apple Inc. - Key offerings
Apple Inc. - Segment focus
SWOT

15.6 ClassPass

ClassPass - Overview
ClassPass - Product / Service
ClassPass - Key offerings
SWOT

15.7 Daily Burn Inc.

Daily Burn Inc. - Overview
Daily Burn Inc. - Product / Service
Daily Burn Inc. - Key offerings
SWOT

15.8 Fitbit LLC

Fitbit LLC - Overview
Fitbit LLC - Product / Service
Fitbit LLC - Key offerings
SWOT

15.9 FitXR

FitXR - Overview
FitXR - Product / Service
FitXR - Key offerings
SWOT

15.10 Glo Digital Inc.

Glo Digital Inc. - Overview
Glo Digital Inc. - Product / Service
Glo Digital Inc. - Key offerings
SWOT

15.11 Les Mills International Ltd.

Les Mills International Ltd. - Overview
Les Mills International Ltd. - Product / Service
Les Mills International Ltd. - Key offerings
SWOT

15.12 Lift Brands Inc.

Lift Brands Inc. - Overview
Lift Brands Inc. - Product / Service
Lift Brands Inc. - Key offerings
SWOT

15.13 MINDBODY Inc.

MINDBODY Inc. - Overview
MINDBODY Inc. - Product / Service
MINDBODY Inc. - Key offerings
SWOT

15.14 Myfitnesspal

Myfitnesspal - Overview
Myfitnesspal - Product / Service
Myfitnesspal - Key offerings
SWOT

15.15 Nike Inc.

Nike Inc. - Overview
Nike Inc. - Business segments
Nike Inc. - Key news
Nike Inc. - Key offerings
Nike Inc. - Segment focus
SWOT

15.16 Peloton Interactive Inc

Peloton Interactive Inc - Overview
Peloton Interactive Inc - Business segments
Peloton Interactive Inc - Key offerings
Peloton Interactive Inc - Segment focus
SWOT

15.17 The Beachbody Company

The Beachbody Company - Overview
The Beachbody Company - Product / Service
The Beachbody Company - Key offerings
SWOT

15.18 Under Armour Inc.

Under Armour Inc. - Overview
Under Armour Inc. - Business segments
Under Armour Inc. - Key news
Under Armour Inc. - Key offerings
Under Armour Inc. - Segment focus
SWOT

16. Appendix

16.1 Scope of the report

Market definition
Objectives
Notes and caveats

16.2 Inclusions and exclusions checklist

Inclusions checklist
Exclusions checklist

16.3 Currency conversion rates for US$

16.4 Research methodology

16.5 Data procurement

Information sources

16.6 Data validation

16.7 Validation techniques employed for market sizing

16.8 Data synthesis

16.9 360 degree market analysis

16.10 List of abbreviations

Research Methodology

Technavio presents a detailed picture of the market by way of study, synthesis, and summation of data from multiple sources. The analysts have presented the various facets of the market with a particular focus on identifying the key industry influencers. The data thus presented is comprehensive, reliable, and the result of extensive research, both primary and secondary.

INFORMATION SOURCES

Primary sources

  • Manufacturers and suppliers
  • Channel partners
  • Industry experts
  • Strategic decision makers

Secondary sources

  • Industry journals and periodicals
  • Government data
  • Financial reports of key industry players
  • Historical data
  • Press releases

DATA ANALYSIS

Data Synthesis

  • Collation of data
  • Estimation of key figures
  • Analysis of derived insights

Data Validation

  • Triangulation with data models
  • Reference against proprietary databases
  • Corroboration with industry experts

REPORT WRITING

Qualitative

  • Market drivers
  • Market challenges
  • Market trends
  • Five forces analysis

Quantitative

  • Market size and forecast
  • Market segmentation
  • Geographical insights
  • Competitive landscape

Interested in this report?

Get your sample now to see our research methodology and insights!

Download Now

Frequently Asked Questions

Online Fitness Course market growth will increase by USD 34720.0 million during 2026-2030.

The Online Fitness Course market is expected to grow at a CAGR of 17.2% during 2026-2030.

Online Fitness Course market is segmented by Product (On demand courses, Live classes, Hybrid courses) Revenue stream (Subscription, Freemium, One time purchase, Pay per class) Service type (Group, Solo)

Alo Moves, Apple Inc., ClassPass, Daily Burn Inc., Fitbit LLC, FitXR, Glo Digital Inc., Les Mills International Ltd., Lift Brands Inc., MINDBODY Inc., Myfitnesspal, Nike Inc., Peloton Interactive Inc, REH-FIT, Sworkit, The Beachbody Company, Under Armour Inc., Wexer are a few of the key vendors in the Online Fitness Course market.

North America will register the highest growth rate of 38.3% among the other regions. Therefore, the Online Fitness Course market in North America is expected to garner significant business opportunities for the vendors during the forecast period.

US, Canada, Mexico, Germany, UK, France, Italy, Spain, The Netherlands, China, Japan, India, South Korea, Australia, Indonesia, Brazil, Argentina, Colombia, Saudi Arabia, UAE, Israel, South Africa, Turkey

  • Increasing global focus on health and wellness coupled with demand for convenience is the driving factor this market.

The Online Fitness Course market vendors should focus on grabbing business opportunities from the Product segment as it accounted for the largest market share in the base year.