On-device AI Market Analysis, Size, and Forecast 2026-2030: APAC (China, Japan, and India), North America (US, Canada, and Mexico), Europe (Germany, UK, and France), South America (Brazil and Argentina), Middle East and Africa (Saudi Arabia, UAE, and South Africa), and Rest of World (ROW)

On-device AI Market Analysis, Size, and Forecast 2026-2030:
APAC (China, Japan, and India), North America (US, Canada, and Mexico), Europe (Germany, UK, and France), South America (Brazil and Argentina), Middle East and Africa (Saudi Arabia, UAE, and South Africa), and Rest of World (ROW)

Published: Apr 2026 307 Pages SKU: IRTNTR80657

Market Overview at a Glance

$150.98 B
Market Opportunity
28.5%
CAGR 2025 - 2030
47.1%
APAC Growth
$26.22 B
Hardware segment 2024

On-device AI Market Size 2026-2030

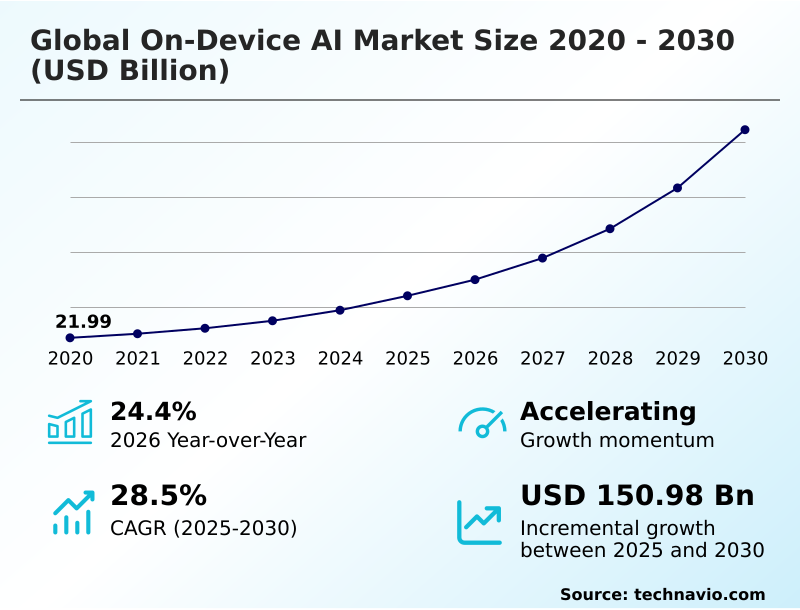
The on-device ai market size is valued to increase by USD 150.98 billion, at a CAGR of 28.5% from 2025 to 2030. Growing demand for enhanced data privacy and security will drive the on-device ai market.

Major Market Trends & Insights

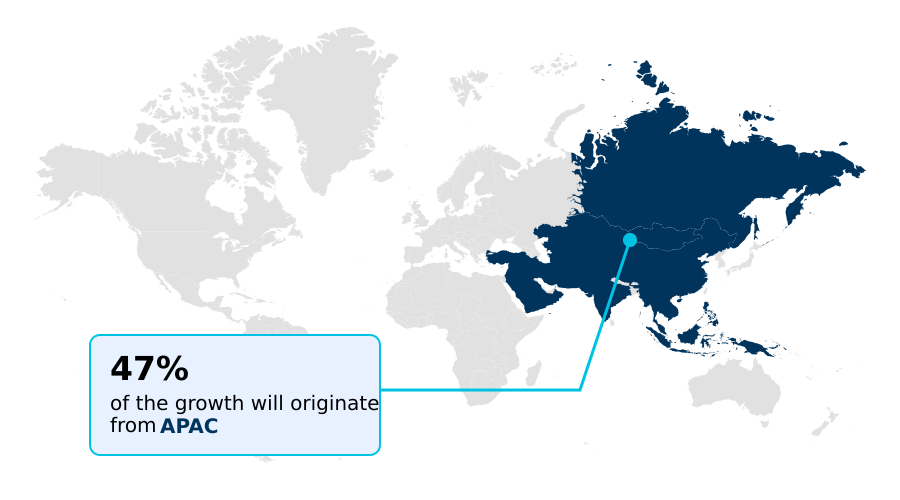
  • APAC dominated the market and accounted for a 47.1% growth during the forecast period.
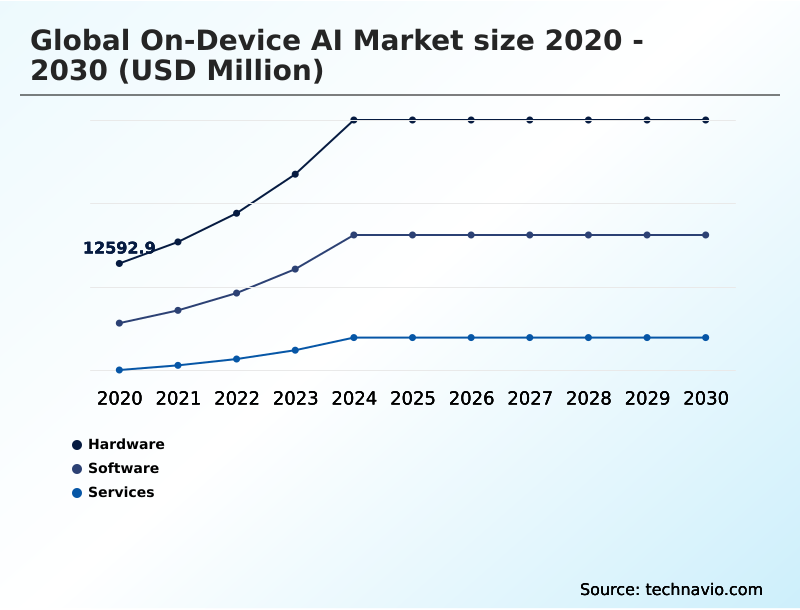
  • By Component - Hardware segment was valued at USD 26.22 billion in 2024
  • By Technology - 7 nm segment accounted for the largest market revenue share in 2024

Market Size & Forecast

  • Market Opportunities: USD 189.18 billion
  • Market Future Opportunities: USD 150.98 billion
  • CAGR from 2025 to 2030 : 28.5%

Market Summary

  • The on-device AI market is defined by the integration of sophisticated intelligence directly into hardware, eliminating the need for constant cloud connectivity. This shift is driven by the demand for real-time responsiveness, enhanced data privacy, and improved power efficiency in devices ranging from smartphones to industrial sensors.
  • Key technologies such as AI-optimized silicon, including neural processing units and tensor processing cores, provide the necessary computational power for local inference. A significant trend is the development of small language models and on-device generative AI, which allow for complex tasks like text and image creation without sending data to external servers.
  • For instance, in a connected vehicle, on-device AI processes sensor data for autonomous navigation, ensuring split-second decisions that are critical for safety, a task where latency from cloud processing would be unacceptable. However, the industry faces challenges related to power consumption, thermal management, and the complexity of model optimization for diverse hardware.
  • As hardware and software co-design advances, the capabilities of on-device AI are expected to expand, further embedding intelligent, privacy-preserving features into everyday technology and enterprise systems.

What will be the Size of the On-device AI Market during the forecast period?

Get Key Insights on Market Forecast (PDF) Request Free Sample

How is the On-device AI Market Segmented?

The on-device ai industry research report provides comprehensive data (region-wise segment analysis), with forecasts and estimates in "USD million" for the period 2026-2030, as well as historical data from 2020-2024 for the following segments.

  • Component
    • Hardware
    • Software
    • Services
  • Technology
    • 7 nm
    • 10 nm
    • 20 to 28 nm
  • Application
    • Smartphones
    • Wearables
    • Smart speakers
  • Geography
    • APAC
      • China
      • Japan
      • India
    • North America
      • US
      • Canada
      • Mexico
    • Europe
      • Germany
      • UK
      • France
    • South America
      • Brazil
      • Argentina
    • Middle East and Africa
      • Saudi Arabia
      • UAE
      • South Africa
    • Rest of World (ROW)

By Component Insights

The hardware segment is estimated to witness significant growth during the forecast period.

The hardware segment serves as the physical foundation for the global on-device AI market 2026-2030, comprising the essential semiconductor architectures that execute complex machine learning algorithms.

This includes neural processing units, tensor processing cores, and other forms of AI-optimized silicon integrated into a system-on-chip. These components are engineered for the parallel processing and matrix multiplication inherent in deep learning, enabling features like on-device generative AI.

Effective thermal management solutions are critical, as they prevent performance throttling during intensive workloads. By using techniques like weight sharing, these systems achieve high efficiency.

Innovations in this area have shown to improve inference speed by 25% in certain applications, facilitating real-time responsiveness and advanced local inference without constant cloud dependency.

Request Free Sample

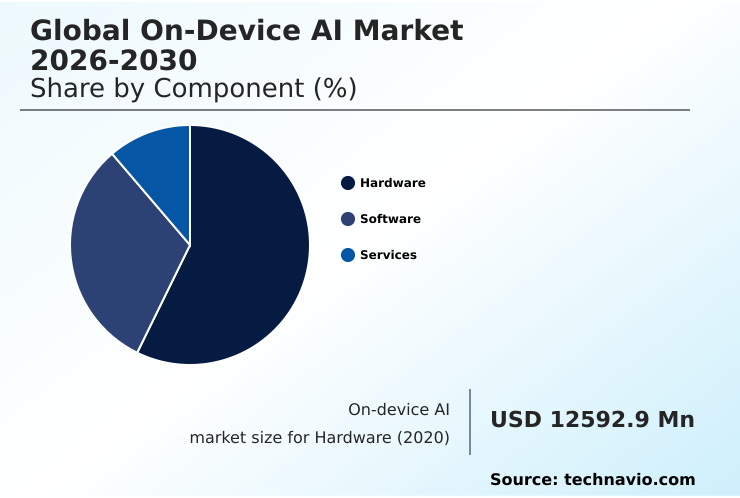
The Hardware segment was valued at USD 26.22 billion in 2024 and showed a gradual increase during the forecast period.

Request Free Sample

Regional Analysis

APAC is estimated to contribute 47.1% to the growth of the global market during the forecast period.Technavio’s analysts have elaborately explained the regional trends and drivers that shape the market during the forecast period.

See How On-device AI Market Demand is Rising in APAC Request Free Sample

The geographic landscape of the on-device AI market is diverse, with regional priorities shaping innovation and adoption. In APAC, the focus is on mass-market hardware manufacturing, integrating AI-optimized silicon and neural processing units into consumer electronics at scale.

North America leads in foundational research and development, pioneering hardware-software co-design and vertical integration to create high-performance systems for advanced applications.

The region's emphasis on local inference and low latency processing has resulted in systems that improve data throughput by over 40% compared to previous generations.

Europe distinguishes itself with a strong regulatory focus on data privacy, driving the adoption of privacy-preserving AI and hybrid AI architecture.

This has spurred the development of technologies compliant with strict data sovereignty laws, positioning the region as a leader in ethical AI model deployment.

Market Dynamics

Our researchers analyzed the data with 2025 as the base year, along with the key drivers, trends, and challenges. A holistic analysis of drivers will help companies refine their marketing strategies to gain a competitive advantage.

  • The evolution of the on-device AI market is increasingly defined by sophisticated, long-tail applications that demand specialized hardware and software integration. The development of on-device AI for autonomous navigation is a prime example, where real-time sensor data fusion is critical for safety and requires robust, low-latency processing.
  • Similarly, the push for low latency AI in augmented reality is transforming user experiences by enabling seamless digital overlays without perceptible lag. At the core of these advancements is the pursuit of power-efficient deep learning inference, allowing complex neural networks to run on battery-powered devices.
  • The complexity of edge AI deployment on embedded systems remains a significant focus, as developers work to bring intelligence to a wider range of connected products. In industrial settings, real-time video analysis at the edge has demonstrated more than double the defect detection accuracy compared to previous cloud-reliant models.
  • The challenge of optimizing generative AI for mobile devices is being met with innovative model compression techniques. Furthermore, strategies for hybrid cloud-edge AI workload balancing are becoming essential for managing computational resources efficiently. This is complemented by a focus on secure on-device biometric processing, which enhances security without compromising user privacy.
  • The market's trajectory is clearly toward more autonomous, responsive, and secure intelligent systems deployed directly at the data source.

What are the key market drivers leading to the rise in the adoption of On-device AI Industry?

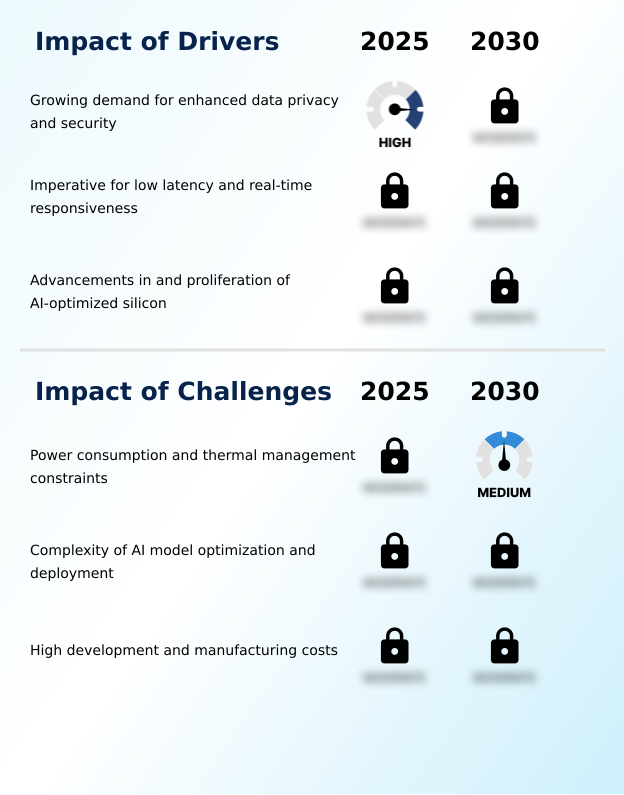
  • The growing demand for enhanced data privacy and security is a primary driver for the on-device AI market, as processing data locally mitigates risks associated with cloud transmission.

  • Market growth is propelled by a confluence of factors addressing fundamental user and enterprise needs.
  • The imperative for enhanced data privacy is a primary driver, as local inference on devices eliminates the need to transmit sensitive information, a method shown to reduce data breach risks by over 60%.
  • Equally important is the demand for real-time responsiveness and low latency processing, which is non-negotiable for applications like autonomous systems and augmented reality. On-device processing can cut latency by more than 95% compared to round-trip cloud communication.
  • This is made possible by advancements in AI-optimized silicon, including specialized system-on-chip designs that deliver high performance with lower power consumption. The proliferation of this technology is enabling a new generation of intelligent, responsive, and secure applications.

What are the market trends shaping the On-device AI Industry?

  • The emergence of on-device generative AI and small language models signifies a key market trend. This development involves shrinking large architectures to run sophisticated AI locally on consumer hardware.

  • Key market trends are centered on making AI more accessible and efficient at the edge. The emergence of on-device generative AI, powered by small language models, allows devices to perform creative and reasoning tasks locally.
  • This is enabled by advanced techniques like model distillation and knowledge distillation, which have proven to reduce model size by up to 80% without significant accuracy loss. Another dominant trend is the shift to a hybrid AI architecture, combining the benefits of local inference with the power of the cloud.
  • This approach optimizes workloads, with studies showing a 40% improvement in application responsiveness. Furthermore, hardware-software co-design and vertical integration have become critical, enabling companies to achieve performance gains of over 50% compared to using off-the-shelf components.

What challenges does the On-device AI Industry face during its growth?

  • Significant challenges for the on-device AI market include managing power consumption and thermal management constraints inherent in portable, high-performance hardware.

  • Despite strong drivers, the market faces significant technical and economic hurdles. Power consumption constraints and thermal management are primary challenges, as intensive AI workloads can reduce battery life by up to 40% in mobile devices and trigger performance-throttling. The complexity of AI model deployment is another major barrier.
  • Optimizing models for fragmented hardware environments through techniques like quantization and pruning requires specialized expertise and can increase development time by 30%. Furthermore, the high development costs associated with custom silicon and software stacks limit market entry for smaller players, as the initial investment for a new chip design can be substantial, concentrating market power among a few large organizations.

Exclusive Technavio Analysis on Customer Landscape

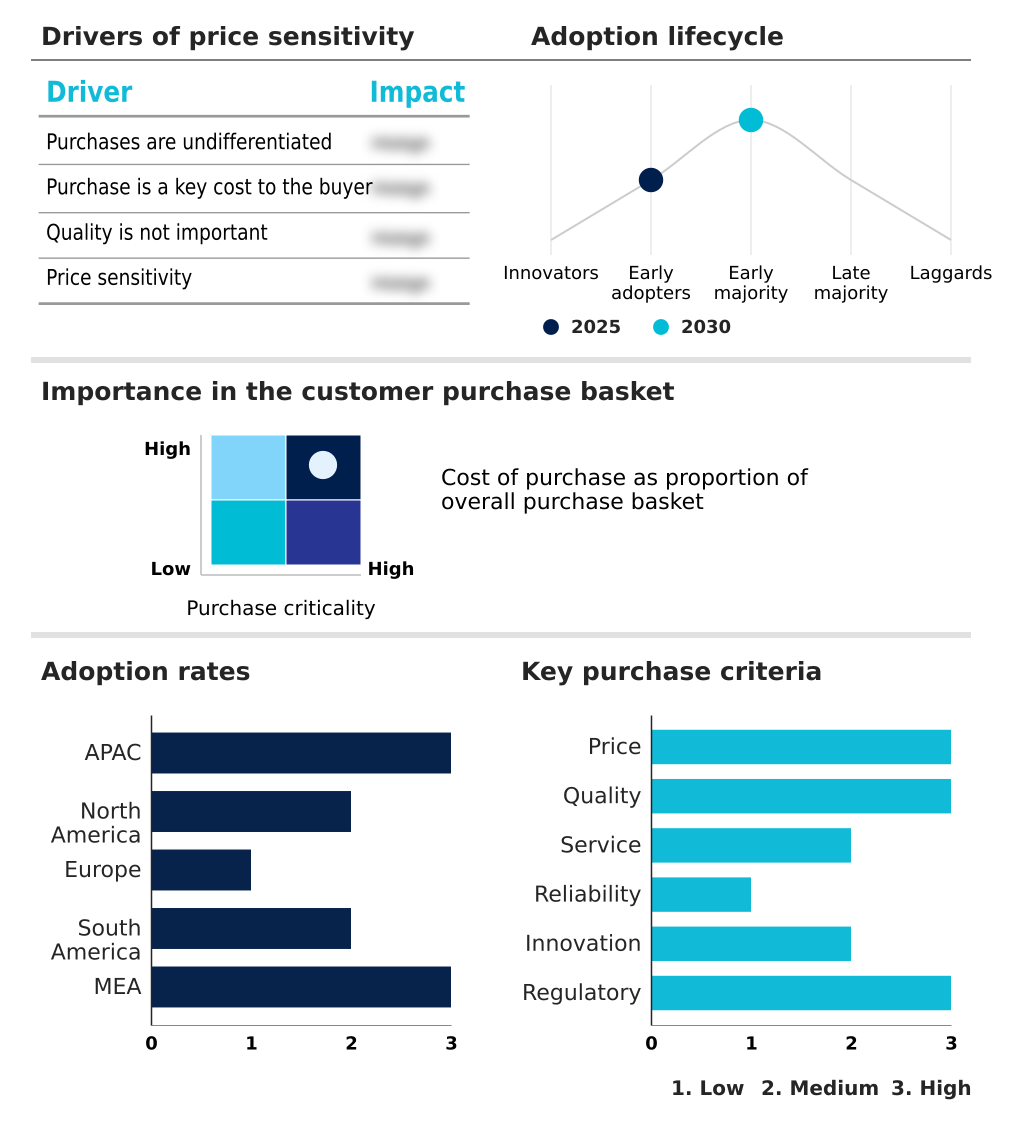
The on-device ai market forecasting report includes the adoption lifecycle of the market, covering from the innovator’s stage to the laggard’s stage. It focuses on adoption rates in different regions based on penetration. Furthermore, the on-device ai market report also includes key purchase criteria and drivers of price sensitivity to help companies evaluate and develop their market growth analysis strategies.

Customer Landscape of On-device AI Industry

Competitive Landscape

Companies are implementing various strategies, such as strategic alliances, on-device ai market forecast, partnerships, mergers and acquisitions, geographical expansion, and product/service launches, to enhance their presence in the industry.

Advanced Micro Devices Inc. - The company offers on-device AI, including Ryzen AI processors, XDNA NPUs, and Radeon AI accelerators, designed for edge and local AI applications.

The industry research and growth report includes detailed analyses of the competitive landscape of the market and information about key companies, including:

  • Advanced Micro Devices Inc.
  • Ambarella Inc.
  • Apple Inc.
  • Google LLC
  • Hailo Technologies Ltd.
  • Huawei Technologies Co. Ltd.
  • Infineon Technologies AG
  • Intel Corp.
  • MediaTek Inc.
  • Microchip Technology Inc.
  • Mythic Inc.
  • NVIDIA Corp.
  • NXP Semiconductors NV
  • Qualcomm Inc.
  • Renesas Electronics Corp.
  • Samsung Electronics Co. Ltd.
  • SiMa Technologies Inc.
  • Sony Semiconductor Solutions
  • STMicroelectronics NV
  • Texas Instruments Inc.

Qualitative and quantitative analysis of companies has been conducted to help clients understand the wider business environment as well as the strengths and weaknesses of key industry players. Data is qualitatively analyzed to categorize companies as pure play, category-focused, industry-focused, and diversified; it is quantitatively analyzed to categorize companies as dominant, leading, strong, tentative, and weak.

Recent Development and News in On-device ai market

  • In September 2024, Qualcomm Inc. announced its next-generation Snapdragon platform, featuring an upgraded Hexagon processor capable of running generative AI models with up to 20 billion parameters, enhancing on-device text-to-image generation.
  • In November 2024, NVIDIA Corp. and a leading automotive manufacturer entered a strategic partnership to integrate the NVIDIA DRIVE platform into the automaker's 2027 vehicle lineup, enabling advanced driver-assistance systems powered by on-device AI.
  • In February 2025, Apple Inc. acquired 'SynthEdge,' a startup specializing in ultra-low-power neural network models for an undisclosed amount, aiming to bolster its on-device processing capabilities for future products.
  • In May 2025, Google LLC released an update to its TensorFlow Lite framework that improves model execution speed by 15% on NPUs through enhanced delegate support and optimized operators, expanding AI capabilities on mid-range devices.

Dive into Technavio’s robust research methodology, blending expert interviews, extensive data synthesis, and validated models for unparalleled On-device AI Market insights. See full methodology.

Market Scope
Page number 307
Base year 2025
Historic period 2020-2024
Forecast period 2026-2030
Growth momentum & CAGR Accelerate at a CAGR of 28.5%
Market growth 2026-2030 USD 150980.7 million
Market structure Fragmented
YoY growth 2025-2026(%) 24.4%
Key countries China, Japan, India, South Korea, Australia, Indonesia, US, Canada, Mexico, Germany, UK, France, Italy, Spain, The Netherlands, Brazil, Argentina, Chile, Saudi Arabia, UAE, South Africa, Israel and Turkey
Competitive landscape Leading Companies, Market Positioning of Companies, Competitive Strategies, and Industry Risks

Request Free Sample

Research Analyst Overview

  • The on-device AI market is advancing through deep integration of hardware and software, a trend critical for achieving performance and efficiency gains. Innovations in AI-optimized silicon, including specialized neural processing units and tensor processing cores, are foundational.
  • These components are not standalone solutions but are part of a vertical integration strategy where system-on-chip designs are co-developed with specialized compilers and runtime environments. This hardware-software co-design approach allows for superior optimization, addressing challenges like power consumption constraints and thermal management.
  • For instance, companies that master this synergy have demonstrated a 30% reduction in processing time for complex AI tasks. This level of performance directly impacts boardroom decisions regarding product differentiation and market positioning. The process involves complex techniques such as model distillation, weight sharing, quantization, and pruning to shrink large models, like small language models, for local inference.
  • This allows for the deployment of on-device generative AI while maintaining a responsive user experience, a key competitive advantage.

What are the Key Data Covered in this On-device AI Market Research and Growth Report?

  • What is the expected growth of the On-device AI Market between 2026 and 2030?

    • USD 150.98 billion, at a CAGR of 28.5%

  • What segmentation does the market report cover?

    • The report is segmented by Component (Hardware, Software, and Services), Technology (7 nm, 10 nm, and 20 to 28 nm), Application (Smartphones, Wearables, and Smart speakers) and Geography (APAC, North America, Europe, South America, Middle East and Africa)

  • Which regions are analyzed in the report?

    • APAC, North America, Europe, South America and Middle East and Africa

  • What are the key growth drivers and market challenges?

    • Growing demand for enhanced data privacy and security, Power consumption and thermal management constraints

  • Who are the major players in the On-device AI Market?

    • Advanced Micro Devices Inc., Ambarella Inc., Apple Inc., Google LLC, Hailo Technologies Ltd., Huawei Technologies Co. Ltd., Infineon Technologies AG, Intel Corp., MediaTek Inc., Microchip Technology Inc., Mythic Inc., NVIDIA Corp., NXP Semiconductors NV, Qualcomm Inc., Renesas Electronics Corp., Samsung Electronics Co. Ltd., SiMa Technologies Inc., Sony Semiconductor Solutions, STMicroelectronics NV and Texas Instruments Inc.

Market Research Insights

  • Market dynamics are shaped by the strategic shift toward hybrid AI architectures, which balance local processing with cloud capabilities to optimize performance and efficiency. This approach has demonstrated an ability to reduce server-side operational costs by up to 30% while enhancing application responsiveness.
  • The drive for low latency processing is particularly critical in autonomous systems, where a delay reduction of just 50 milliseconds can be the difference in operational safety. Concurrently, the adoption of privacy-preserving AI is a key differentiator, with systems that process data locally seeing a 40% higher trust rating in consumer surveys.
  • As edge intelligence becomes more sophisticated, the focus on secure, efficient AI model deployment and local inference continues to intensify, pushing the boundaries of what is possible on connected devices.

We can help! Our analysts can customize this on-device ai market research report to meet your requirements.

Get in touch

1. Executive Summary

1.1 Market overview

Executive Summary - Chart on Market Overview
Executive Summary - Data Table on Market Overview
Executive Summary - Chart on Global Market Characteristics
Executive Summary - Chart on Market by Geography
Executive Summary - Chart on Market Segmentation by Component
Executive Summary - Chart on Market Segmentation by Technology
Executive Summary - Chart on Market Segmentation by Application
Executive Summary - Chart on Incremental Growth
Executive Summary - Data Table on Incremental Growth
Executive Summary - Chart on Company Market Positioning

2. Technavio Analysis

2.1 Analysis of price sensitivity, lifecycle, customer purchase basket, adoption rates, and purchase criteria

2.2 Criticality of inputs and Factors of differentiation

Chart on Overview on criticality of inputs and factors of differentiation

2.3 Factors of disruption

Chart on Overview on factors of disruption

2.4 Impact of drivers and challenges

Chart on Impact of drivers and challenges in 2025 and 2030

3. Market Landscape

3.1 Market ecosystem

Chart on Parent Market
Data Table on - Parent Market

3.2 Market characteristics

Chart on Market characteristics analysis

3.3 Value chain analysis

Chart on Value chain analysis

4. Market Sizing

4.1 Market definition

Data Table on Offerings of companies included in the market definition

4.2 Market segment analysis

Market segments

4.3 Market size 2025

4.4 Market outlook: Forecast for 2025-2030

Chart on Global - Market size and forecast 2025-2030 ($ million)
Data Table on Global - Market size and forecast 2025-2030 ($ million)
Chart on Global Market: Year-over-year growth 2025-2030 (%)
Data Table on Global Market: Year-over-year growth 2025-2030 (%)

5. Historic Market Size

5.1 Global On-Device AI Market 2020 - 2024

Historic Market Size - Data Table on Global On-Device AI Market 2020 - 2024 ($ million)

5.2 Component segment analysis 2020 - 2024

Historic Market Size - Component Segment 2020 - 2024 ($ million)

5.3 Technology segment analysis 2020 - 2024

Historic Market Size - Technology Segment 2020 - 2024 ($ million)

5.4 Application segment analysis 2020 - 2024

Historic Market Size - Application Segment 2020 - 2024 ($ million)

5.5 Geography segment analysis 2020 - 2024

Historic Market Size - Geography Segment 2020 - 2024 ($ million)

5.6 Country segment analysis 2020 - 2024

Historic Market Size - Country Segment 2020 - 2024 ($ million)

6. Qualitative Analysis

6.1 Impact of AI on Global On-Device AI Market

6.2 Impact of Geopolitical Conflicts on Global On-Device AI Market

7. Five Forces Analysis

7.1 Five forces summary

Five forces analysis - Comparison between 2025 and 2030

7.2 Bargaining power of buyers

Bargaining power of buyers - Impact of key factors 2025 and 2030

7.3 Bargaining power of suppliers

Bargaining power of suppliers - Impact of key factors in 2025 and 2030

7.4 Threat of new entrants

Threat of new entrants - Impact of key factors in 2025 and 2030

7.5 Threat of substitutes

Threat of substitutes - Impact of key factors in 2025 and 2030

7.6 Threat of rivalry

Threat of rivalry - Impact of key factors in 2025 and 2030

7.7 Market condition

Chart on Market condition - Five forces 2025 and 2030

8. Market Segmentation by Component

8.1 Market segments

Chart on Component - Market share 2025-2030 (%)
Data Table on Component - Market share 2025-2030 (%)

8.2 Comparison by Component

Chart on Comparison by Component
Data Table on Comparison by Component

8.3 Hardware - Market size and forecast 2025-2030

Chart on Hardware - Market size and forecast 2025-2030 ($ million)
Data Table on Hardware - Market size and forecast 2025-2030 ($ million)
Chart on Hardware - Year-over-year growth 2025-2030 (%)
Data Table on Hardware - Year-over-year growth 2025-2030 (%)

8.4 Software - Market size and forecast 2025-2030

Chart on Software - Market size and forecast 2025-2030 ($ million)
Data Table on Software - Market size and forecast 2025-2030 ($ million)
Chart on Software - Year-over-year growth 2025-2030 (%)
Data Table on Software - Year-over-year growth 2025-2030 (%)

8.5 Services - Market size and forecast 2025-2030

Chart on Services - Market size and forecast 2025-2030 ($ million)
Data Table on Services - Market size and forecast 2025-2030 ($ million)
Chart on Services - Year-over-year growth 2025-2030 (%)
Data Table on Services - Year-over-year growth 2025-2030 (%)

8.6 Market opportunity by Component

Market opportunity by Component ($ million)
Data Table on Market opportunity by Component ($ million)

9. Market Segmentation by Technology

9.1 Market segments

Chart on Technology - Market share 2025-2030 (%)
Data Table on Technology - Market share 2025-2030 (%)

9.2 Comparison by Technology

Chart on Comparison by Technology
Data Table on Comparison by Technology

9.3 7 nm - Market size and forecast 2025-2030

Chart on 7 nm - Market size and forecast 2025-2030 ($ million)
Data Table on 7 nm - Market size and forecast 2025-2030 ($ million)
Chart on 7 nm - Year-over-year growth 2025-2030 (%)
Data Table on 7 nm - Year-over-year growth 2025-2030 (%)

9.4 10 nm - Market size and forecast 2025-2030

Chart on 10 nm - Market size and forecast 2025-2030 ($ million)
Data Table on 10 nm - Market size and forecast 2025-2030 ($ million)
Chart on 10 nm - Year-over-year growth 2025-2030 (%)
Data Table on 10 nm - Year-over-year growth 2025-2030 (%)

9.5 20 to 28 nm - Market size and forecast 2025-2030

Chart on 20 to 28 nm - Market size and forecast 2025-2030 ($ million)
Data Table on 20 to 28 nm - Market size and forecast 2025-2030 ($ million)
Chart on 20 to 28 nm - Year-over-year growth 2025-2030 (%)
Data Table on 20 to 28 nm - Year-over-year growth 2025-2030 (%)

9.6 Market opportunity by Technology

Market opportunity by Technology ($ million)
Data Table on Market opportunity by Technology ($ million)

10. Market Segmentation by Application

10.1 Market segments

Chart on Application - Market share 2025-2030 (%)
Data Table on Application - Market share 2025-2030 (%)

10.2 Comparison by Application

Chart on Comparison by Application
Data Table on Comparison by Application

10.3 Smartphones - Market size and forecast 2025-2030

Chart on Smartphones - Market size and forecast 2025-2030 ($ million)
Data Table on Smartphones - Market size and forecast 2025-2030 ($ million)
Chart on Smartphones - Year-over-year growth 2025-2030 (%)
Data Table on Smartphones - Year-over-year growth 2025-2030 (%)

10.4 Wearables - Market size and forecast 2025-2030

Chart on Wearables - Market size and forecast 2025-2030 ($ million)
Data Table on Wearables - Market size and forecast 2025-2030 ($ million)
Chart on Wearables - Year-over-year growth 2025-2030 (%)
Data Table on Wearables - Year-over-year growth 2025-2030 (%)

10.5 Smart speakers - Market size and forecast 2025-2030

Chart on Smart speakers - Market size and forecast 2025-2030 ($ million)
Data Table on Smart speakers - Market size and forecast 2025-2030 ($ million)
Chart on Smart speakers - Year-over-year growth 2025-2030 (%)
Data Table on Smart speakers - Year-over-year growth 2025-2030 (%)

10.6 Market opportunity by Application

Market opportunity by Application ($ million)
Data Table on Market opportunity by Application ($ million)

11. Customer Landscape

11.1 Customer landscape overview

Analysis of price sensitivity, lifecycle, customer purchase basket, adoption rates, and purchase criteria

12. Geographic Landscape

12.1 Geographic segmentation

Chart on Market share by geography 2025-2030 (%)
Data Table on Market share by geography 2025-2030 (%)

12.2 Geographic comparison

Chart on Geographic comparison
Data Table on Geographic comparison

12.3 APAC - Market size and forecast 2025-2030

Chart on APAC - Market size and forecast 2025-2030 ($ million)
Data Table on APAC - Market size and forecast 2025-2030 ($ million)
Chart on APAC - Year-over-year growth 2025-2030 (%)
Data Table on APAC - Year-over-year growth 2025-2030 (%)
Chart on Regional Comparison - APAC
Data Table on Regional Comparison - APAC

12.3.1 China - Market size and forecast 2025-2030

Chart on China - Market size and forecast 2025-2030 ($ million)
Data Table on China - Market size and forecast 2025-2030 ($ million)
Chart on China - Year-over-year growth 2025-2030 (%)
Data Table on China - Year-over-year growth 2025-2030 (%)

12.3.2 Japan - Market size and forecast 2025-2030

Chart on Japan - Market size and forecast 2025-2030 ($ million)
Data Table on Japan - Market size and forecast 2025-2030 ($ million)
Chart on Japan - Year-over-year growth 2025-2030 (%)
Data Table on Japan - Year-over-year growth 2025-2030 (%)

12.3.3 India - Market size and forecast 2025-2030

Chart on India - Market size and forecast 2025-2030 ($ million)
Data Table on India - Market size and forecast 2025-2030 ($ million)
Chart on India - Year-over-year growth 2025-2030 (%)
Data Table on India - Year-over-year growth 2025-2030 (%)

12.3.4 South Korea - Market size and forecast 2025-2030

Chart on South Korea - Market size and forecast 2025-2030 ($ million)
Data Table on South Korea - Market size and forecast 2025-2030 ($ million)
Chart on South Korea - Year-over-year growth 2025-2030 (%)
Data Table on South Korea - Year-over-year growth 2025-2030 (%)

12.3.5 Australia - Market size and forecast 2025-2030

Chart on Australia - Market size and forecast 2025-2030 ($ million)
Data Table on Australia - Market size and forecast 2025-2030 ($ million)
Chart on Australia - Year-over-year growth 2025-2030 (%)
Data Table on Australia - Year-over-year growth 2025-2030 (%)

12.3.6 Indonesia - Market size and forecast 2025-2030

Chart on Indonesia - Market size and forecast 2025-2030 ($ million)
Data Table on Indonesia - Market size and forecast 2025-2030 ($ million)
Chart on Indonesia - Year-over-year growth 2025-2030 (%)
Data Table on Indonesia - Year-over-year growth 2025-2030 (%)

12.4 North America - Market size and forecast 2025-2030

Chart on North America - Market size and forecast 2025-2030 ($ million)
Data Table on North America - Market size and forecast 2025-2030 ($ million)
Chart on North America - Year-over-year growth 2025-2030 (%)
Data Table on North America - Year-over-year growth 2025-2030 (%)
Chart on Regional Comparison - North America
Data Table on Regional Comparison - North America

12.4.1 US - Market size and forecast 2025-2030

Chart on US - Market size and forecast 2025-2030 ($ million)
Data Table on US - Market size and forecast 2025-2030 ($ million)
Chart on US - Year-over-year growth 2025-2030 (%)
Data Table on US - Year-over-year growth 2025-2030 (%)

12.4.2 Canada - Market size and forecast 2025-2030

Chart on Canada - Market size and forecast 2025-2030 ($ million)
Data Table on Canada - Market size and forecast 2025-2030 ($ million)
Chart on Canada - Year-over-year growth 2025-2030 (%)
Data Table on Canada - Year-over-year growth 2025-2030 (%)

12.4.3 Mexico - Market size and forecast 2025-2030

Chart on Mexico - Market size and forecast 2025-2030 ($ million)
Data Table on Mexico - Market size and forecast 2025-2030 ($ million)
Chart on Mexico - Year-over-year growth 2025-2030 (%)
Data Table on Mexico - Year-over-year growth 2025-2030 (%)

12.5 Europe - Market size and forecast 2025-2030

Chart on Europe - Market size and forecast 2025-2030 ($ million)
Data Table on Europe - Market size and forecast 2025-2030 ($ million)
Chart on Europe - Year-over-year growth 2025-2030 (%)
Data Table on Europe - Year-over-year growth 2025-2030 (%)
Chart on Regional Comparison - Europe
Data Table on Regional Comparison - Europe

12.5.1 Germany - Market size and forecast 2025-2030

Chart on Germany - Market size and forecast 2025-2030 ($ million)
Data Table on Germany - Market size and forecast 2025-2030 ($ million)
Chart on Germany - Year-over-year growth 2025-2030 (%)
Data Table on Germany - Year-over-year growth 2025-2030 (%)

12.5.2 UK - Market size and forecast 2025-2030

Chart on UK - Market size and forecast 2025-2030 ($ million)
Data Table on UK - Market size and forecast 2025-2030 ($ million)
Chart on UK - Year-over-year growth 2025-2030 (%)
Data Table on UK - Year-over-year growth 2025-2030 (%)

12.5.3 France - Market size and forecast 2025-2030

Chart on France - Market size and forecast 2025-2030 ($ million)
Data Table on France - Market size and forecast 2025-2030 ($ million)
Chart on France - Year-over-year growth 2025-2030 (%)
Data Table on France - Year-over-year growth 2025-2030 (%)

12.5.4 Italy - Market size and forecast 2025-2030

Chart on Italy - Market size and forecast 2025-2030 ($ million)
Data Table on Italy - Market size and forecast 2025-2030 ($ million)
Chart on Italy - Year-over-year growth 2025-2030 (%)
Data Table on Italy - Year-over-year growth 2025-2030 (%)

12.5.5 Spain - Market size and forecast 2025-2030

Chart on Spain - Market size and forecast 2025-2030 ($ million)
Data Table on Spain - Market size and forecast 2025-2030 ($ million)
Chart on Spain - Year-over-year growth 2025-2030 (%)
Data Table on Spain - Year-over-year growth 2025-2030 (%)

12.5.6 The Netherlands - Market size and forecast 2025-2030

Chart on The Netherlands - Market size and forecast 2025-2030 ($ million)
Data Table on The Netherlands - Market size and forecast 2025-2030 ($ million)
Chart on The Netherlands - Year-over-year growth 2025-2030 (%)
Data Table on The Netherlands - Year-over-year growth 2025-2030 (%)

12.6 South America - Market size and forecast 2025-2030

Chart on South America - Market size and forecast 2025-2030 ($ million)
Data Table on South America - Market size and forecast 2025-2030 ($ million)
Chart on South America - Year-over-year growth 2025-2030 (%)
Data Table on South America - Year-over-year growth 2025-2030 (%)
Chart on Regional Comparison - South America
Data Table on Regional Comparison - South America

12.6.1 Brazil - Market size and forecast 2025-2030

Chart on Brazil - Market size and forecast 2025-2030 ($ million)
Data Table on Brazil - Market size and forecast 2025-2030 ($ million)
Chart on Brazil - Year-over-year growth 2025-2030 (%)
Data Table on Brazil - Year-over-year growth 2025-2030 (%)

12.6.2 Argentina - Market size and forecast 2025-2030

Chart on Argentina - Market size and forecast 2025-2030 ($ million)
Data Table on Argentina - Market size and forecast 2025-2030 ($ million)
Chart on Argentina - Year-over-year growth 2025-2030 (%)
Data Table on Argentina - Year-over-year growth 2025-2030 (%)

12.6.3 Chile - Market size and forecast 2025-2030

Chart on Chile - Market size and forecast 2025-2030 ($ million)
Data Table on Chile - Market size and forecast 2025-2030 ($ million)
Chart on Chile - Year-over-year growth 2025-2030 (%)
Data Table on Chile - Year-over-year growth 2025-2030 (%)

12.7 Middle East and Africa - Market size and forecast 2025-2030

Chart on Middle East and Africa - Market size and forecast 2025-2030 ($ million)
Data Table on Middle East and Africa - Market size and forecast 2025-2030 ($ million)
Chart on Middle East and Africa - Year-over-year growth 2025-2030 (%)
Data Table on Middle East and Africa - Year-over-year growth 2025-2030 (%)
Chart on Regional Comparison - Middle East and Africa
Data Table on Regional Comparison - Middle East and Africa

12.7.1 Saudi Arabia - Market size and forecast 2025-2030

Chart on Saudi Arabia - Market size and forecast 2025-2030 ($ million)
Data Table on Saudi Arabia - Market size and forecast 2025-2030 ($ million)
Chart on Saudi Arabia - Year-over-year growth 2025-2030 (%)
Data Table on Saudi Arabia - Year-over-year growth 2025-2030 (%)

12.7.2 UAE - Market size and forecast 2025-2030

Chart on UAE - Market size and forecast 2025-2030 ($ million)
Data Table on UAE - Market size and forecast 2025-2030 ($ million)
Chart on UAE - Year-over-year growth 2025-2030 (%)
Data Table on UAE - Year-over-year growth 2025-2030 (%)

12.7.3 South Africa - Market size and forecast 2025-2030

Chart on South Africa - Market size and forecast 2025-2030 ($ million)
Data Table on South Africa - Market size and forecast 2025-2030 ($ million)
Chart on South Africa - Year-over-year growth 2025-2030 (%)
Data Table on South Africa - Year-over-year growth 2025-2030 (%)

12.7.4 Israel - Market size and forecast 2025-2030

Chart on Israel - Market size and forecast 2025-2030 ($ million)
Data Table on Israel - Market size and forecast 2025-2030 ($ million)
Chart on Israel - Year-over-year growth 2025-2030 (%)
Data Table on Israel - Year-over-year growth 2025-2030 (%)

12.7.5 Turkey - Market size and forecast 2025-2030

Chart on Turkey - Market size and forecast 2025-2030 ($ million)
Data Table on Turkey - Market size and forecast 2025-2030 ($ million)
Chart on Turkey - Year-over-year growth 2025-2030 (%)
Data Table on Turkey - Year-over-year growth 2025-2030 (%)

12.8 Market opportunity by geography

Market opportunity by geography ($ million)
Data Tables on Market opportunity by geography ($ million)

13. Drivers, Challenges, and Opportunity

13.1 Market drivers

Growing demand for enhanced data privacy and security
Imperative for low latency and real-time responsiveness
Advancements in and proliferation of AI-optimized silicon

13.2 Market challenges

Power consumption and thermal management constraints
Complexity of AI model optimization and deployment
High development and manufacturing costs

13.3 Impact of drivers and challenges

Impact of drivers and challenges in 2025 and 2030

13.4 Market opportunities

Emergence of on-device generative AI and small language models
Shift to hybrid AI architecture
Hardware and software co-design and vertical integration

14. Competitive Landscape

14.1 Overview

14.2

Overview on criticality of inputs and factors of differentiation

14.3 Landscape disruption

Overview on factors of disruption

14.4 Industry risks

Impact of key risks on business

15. Competitive Analysis

15.1 Companies profiled

Companies covered

15.2 Company ranking index

15.3 Market positioning of companies

Matrix on companies position and classification

15.4 Advanced Micro Devices Inc.

Advanced Micro Devices Inc. - Overview
Advanced Micro Devices Inc. - Business segments
Advanced Micro Devices Inc. - Key news
Advanced Micro Devices Inc. - Key offerings
Advanced Micro Devices Inc. - Segment focus
SWOT

15.5 Apple Inc.

Apple Inc. - Overview
Apple Inc. - Business segments
Apple Inc. - Key news
Apple Inc. - Key offerings
Apple Inc. - Segment focus
SWOT

15.6 Google LLC

Google LLC - Overview
Google LLC - Product / Service
Google LLC - Key offerings
SWOT

15.7 Huawei Technologies Co. Ltd.

Huawei Technologies Co. Ltd. - Overview
Huawei Technologies Co. Ltd. - Business segments
Huawei Technologies Co. Ltd. - Key news
Huawei Technologies Co. Ltd. - Key offerings
Huawei Technologies Co. Ltd. - Segment focus
SWOT

15.8 Infineon Technologies AG

Infineon Technologies AG - Overview
Infineon Technologies AG - Business segments
Infineon Technologies AG - Key news
Infineon Technologies AG - Key offerings
Infineon Technologies AG - Segment focus
SWOT

15.9 Intel Corp.

Intel Corp. - Overview
Intel Corp. - Business segments
Intel Corp. - Key news
Intel Corp. - Key offerings
Intel Corp. - Segment focus
SWOT

15.10 MediaTek Inc.

MediaTek Inc. - Overview
MediaTek Inc. - Business segments
MediaTek Inc. - Key news
MediaTek Inc. - Key offerings
MediaTek Inc. - Segment focus
SWOT

15.11 Microchip Technology Inc.

Microchip Technology Inc. - Overview
Microchip Technology Inc. - Business segments
Microchip Technology Inc. - Key offerings
Microchip Technology Inc. - Segment focus
SWOT

15.12 NVIDIA Corp.

NVIDIA Corp. - Overview
NVIDIA Corp. - Business segments
NVIDIA Corp. - Key news
NVIDIA Corp. - Key offerings
NVIDIA Corp. - Segment focus
SWOT

15.13 NXP Semiconductors NV

NXP Semiconductors NV - Overview
NXP Semiconductors NV - Business segments
NXP Semiconductors NV - Key news
NXP Semiconductors NV - Key offerings
NXP Semiconductors NV - Segment focus
SWOT

15.14 Qualcomm Inc.

Qualcomm Inc. - Overview
Qualcomm Inc. - Business segments
Qualcomm Inc. - Key news
Qualcomm Inc. - Key offerings
Qualcomm Inc. - Segment focus
SWOT

15.15 Renesas Electronics Corp.

Renesas Electronics Corp. - Overview
Renesas Electronics Corp. - Business segments
Renesas Electronics Corp. - Key news
Renesas Electronics Corp. - Key offerings
Renesas Electronics Corp. - Segment focus
SWOT

15.16 Samsung Electronics Co. Ltd.

Samsung Electronics Co. Ltd. - Overview
Samsung Electronics Co. Ltd. - Business segments
Samsung Electronics Co. Ltd. - Key news
Samsung Electronics Co. Ltd. - Key offerings
Samsung Electronics Co. Ltd. - Segment focus
SWOT

15.17 STMicroelectronics NV

STMicroelectronics NV - Overview
STMicroelectronics NV - Business segments
STMicroelectronics NV - Key offerings
STMicroelectronics NV - Segment focus
SWOT

15.18 Texas Instruments Inc.

Texas Instruments Inc. - Overview
Texas Instruments Inc. - Business segments
Texas Instruments Inc. - Key offerings
Texas Instruments Inc. - Segment focus
SWOT

16. Appendix

16.1 Scope of the report

Market definition
Objectives
Notes and caveats

16.2 Inclusions and exclusions checklist

Inclusions checklist
Exclusions checklist

16.3 Currency conversion rates for US$

16.4 Research methodology

16.5 Data procurement

Information sources

16.6 Data validation

16.7 Validation techniques employed for market sizing

16.8 Data synthesis

16.9 360 degree market analysis

16.10 List of abbreviations

Research Methodology

Technavio presents a detailed picture of the market by way of study, synthesis, and summation of data from multiple sources. The analysts have presented the various facets of the market with a particular focus on identifying the key industry influencers. The data thus presented is comprehensive, reliable, and the result of extensive research, both primary and secondary.

INFORMATION SOURCES

Primary sources

  • Manufacturers and suppliers
  • Channel partners
  • Industry experts
  • Strategic decision makers

Secondary sources

  • Industry journals and periodicals
  • Government data
  • Financial reports of key industry players
  • Historical data
  • Press releases

DATA ANALYSIS

Data Synthesis

  • Collation of data
  • Estimation of key figures
  • Analysis of derived insights

Data Validation

  • Triangulation with data models
  • Reference against proprietary databases
  • Corroboration with industry experts

REPORT WRITING

Qualitative

  • Market drivers
  • Market challenges
  • Market trends
  • Five forces analysis

Quantitative

  • Market size and forecast
  • Market segmentation
  • Geographical insights
  • Competitive landscape

Interested in this report?

Get your sample now to see our research methodology and insights!

Download Now

Frequently Asked Questions

On-device AI market growth will increase by USD 150980.7 million during 2026-2030.

The On-device AI market is expected to grow at a CAGR of 28.5% during 2026-2030.

On-device AI market is segmented by Component (Hardware, Software, Services) Technology (7 nm, 10 nm, 20 to 28 nm) Application (Smartphones, Wearables, Smart speakers)

Advanced Micro Devices Inc., Ambarella Inc., Apple Inc., Google LLC, Hailo Technologies Ltd., Huawei Technologies Co. Ltd., Infineon Technologies AG, Intel Corp., MediaTek Inc., Microchip Technology Inc., Mythic Inc., NVIDIA Corp., NXP Semiconductors NV, Qualcomm Inc., Renesas Electronics Corp., Samsung Electronics Co. Ltd., SiMa Technologies Inc., Sony Semiconductor Solutions, STMicroelectronics NV, Texas Instruments Inc. are a few of the key vendors in the On-device AI market.

APAC will register the highest growth rate of 47.1% among the other regions. Therefore, the On-device AI market in APAC is expected to garner significant business opportunities for the vendors during the forecast period.

China, Japan, India, South Korea, Australia, Indonesia, US, Canada, Mexico, Germany, UK, France, Italy, Spain, The Netherlands, Brazil, Argentina, Chile, Saudi Arabia, UAE, South Africa, Israel, Turkey

  • Growing demand for enhanced data privacy and security is the driving factor this market.

The On-device AI market vendors should focus on grabbing business opportunities from the Component segment as it accounted for the largest market share in the base year.
RIA - Research AI Assistant
Ask RIA