Oil Shale Market Analysis North America, APAC, Europe, Middle East and Africa, South America - US, China, Russia, Canada, India - Size and Forecast 2024-2028

Oil Shale Market Analysis North America, APAC, Europe, Middle East and Africa, South America - US, China, Russia, Canada, India - Size and Forecast 2024-2028

Published: Jul 2024 139 Pages SKU: IRTNTR73827

Market Overview at a Glance

$2.36 B
Market Opportunity
14.76%
CAGR
12.55
YoY growth 2023-2024(%)

Oil Shale Market Size 2024-2028

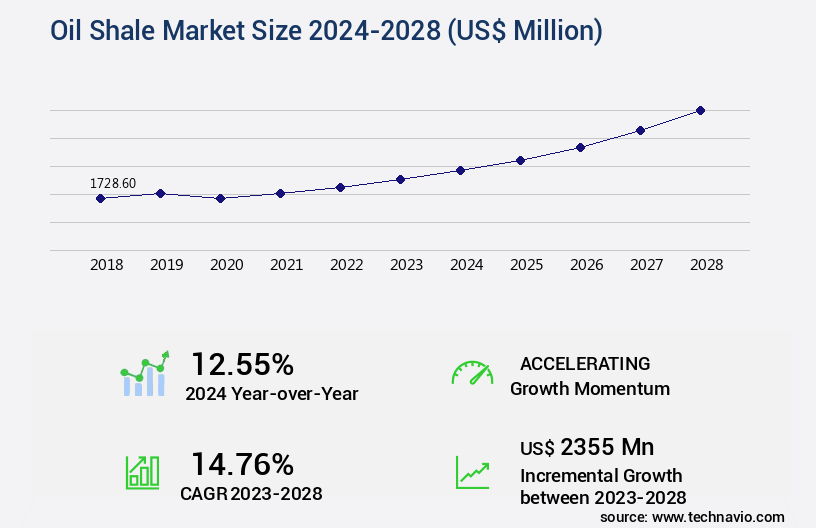
The oil shale market size is valued to increase by USD 2.36 billion, at a CAGR of 14.76% from 2023 to 2028. Growth in use of oil shale across various industries will drive the oil shale market.

Market Insights

  • North America dominated the market and accounted for a 48% growth during the 2024-2028.
  • By Application - Electricity segment was valued at USD 706.10 billion in 2022
  • By segment2 - segment2_1 segment accounted for the largest market revenue share in 2022

Market Size & Forecast

  • Market Opportunities: USD 173.75 million 
  • Market Future Opportunities 2023: USD 2355.00 million
  • CAGR from 2023 to 2028 : 14.76%

Market Summary

  • The market has experienced significant growth in recent years, driven by the increasing demand for energy and the adoption of advanced extraction techniques. Oil shale, a fine-grained sedimentary rock containing kerogen, a solid, organic material, is transformed into shale oil through a process known as retorting. This process is gaining popularity due to the depletion of conventional oil reserves and the rise in the price of crude oil. One of the key trends in the oil shale industry is the shift towards green hydraulic fracturing methods. This approach, also known as "sustainable fracking," reduces the environmental impact of shale oil extraction by minimizing water usage and reducing greenhouse gas emissions.
  • For instance, companies are exploring the use of recycled water and alternative solvents to extract oil from shale formations. Despite the potential benefits, the oil shale industry faces several challenges. One of the most significant challenges is the environmental impact of shale oil extraction. The process of extracting shale oil involves large-scale mining and the use of significant amounts of water and energy. This can lead to water scarcity, land degradation, and air pollution. A real-world business scenario illustrating the challenges of the oil shale industry is the need for supply chain optimization and operational efficiency.
  • Companies must navigate complex regulatory frameworks and manage the logistical challenges of transporting large quantities of water and equipment to remote shale formations. To address these challenges, companies are investing in technology solutions, such as automation and data analytics, to optimize their operations and reduce their environmental footprint. In conclusion, the market is undergoing a period of significant change, driven by the increasing demand for energy and the adoption of advanced extraction techniques. While the industry presents numerous opportunities, it also faces significant challenges, including environmental concerns and operational inefficiencies. Companies must navigate these challenges to remain competitive and sustainable in the long term.

What will be the size of the Oil Shale Market during the forecast period?

Oil Shale Market Size

Get Key Insights on Market Forecast (PDF) Request Free Sample

  • The market represents a dynamic and evolving sector in the global energy industry. This resource-rich industry involves the extraction and processing of oil shale, a fine-grained sedimentary rock containing kerogen, a solid hydrocarbon source. Thermal decomposition is the primary process used to release oil from the kerogen, which is then upgraded through refining processes. One significant trend in the market is the increasing focus on risk mitigation and regulatory compliance. Companies are investing in advanced automation systems, process control systems, and safety protocols to minimize environmental impact and ensure economic feasibility. For instance, air pollution control technologies have led to a 30% reduction in emissions, making oil shale production more sustainable.
  • Moreover, the industry is also addressing concerns related to greenhouse gas emissions and resource depletion. Researchers are exploring sustainable development strategies, including habitat restoration, resource management, and the implementation of carbon emissions capture technologies. Additionally, material characterization, process modeling, and simulation techniques are being employed to optimize oil shale upgrading and refining processes. In conclusion, the market continues to evolve, with a focus on environmental stewardship, economic feasibility, and regulatory compliance. Companies must balance the need for energy security with the imperative to minimize environmental impact and ensure long-term resource sustainability.

Unpacking the Oil Shale Market Landscape

Oil shale is a significant non-conventional energy resource, offering substantial reserves and potential for cost reduction strategies in the energy sector. Compared to conventional oil extraction methods, in-situ oil shale production via retorting technologies and steam injection results in a lower land subsidence risk, reducing the need for extensive mine reclamation and environmental remediation. The gasification process in oil shale production contributes to improved combustion efficiency and energy efficiency, resulting in a reduction of nitrogen oxides emissions by up to 50% compared to traditional coal-fired power plants. Furthermore, wastewater recycling and treatment are crucial components of oil shale production, ensuring water management and minimizing fine particle emissions. Geochemical analysis and geological characterization are essential for optimizing production and resource assessment. Process safety management, risk assessment methodology, and process optimization are integral to maintaining operational efficiency and ensuring regulatory compliance. Oil shale reserves offer a promising alternative to conventional oil sources, with yield improvement through kerogen pyrolysis, hydrocarbon extraction, and thermal cracking.

Key Market Drivers Fueling Growth

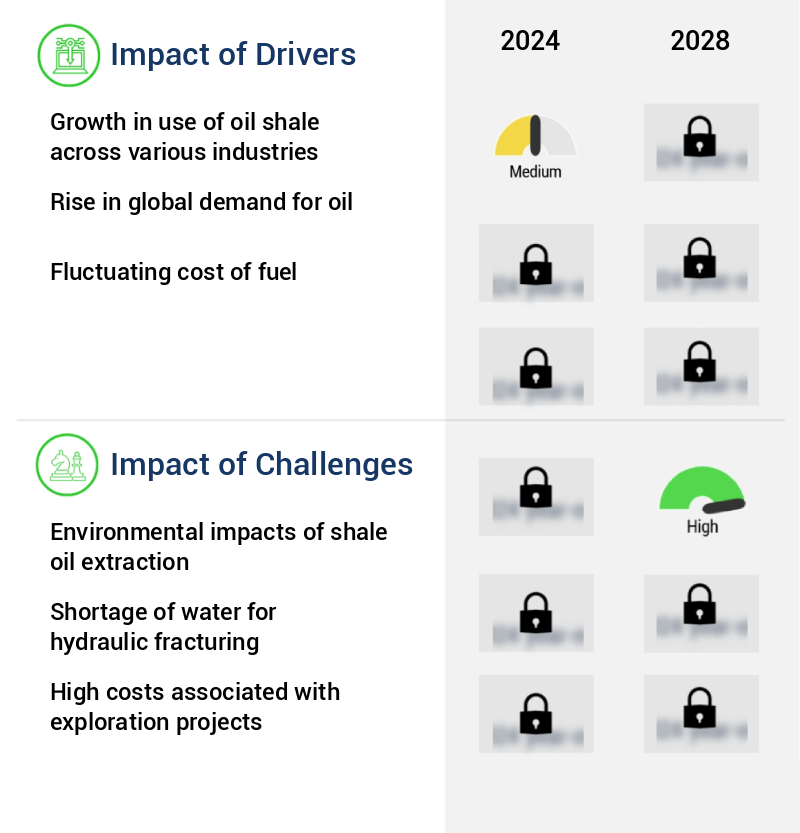
The expansion of oil shale utilization across diverse industries serves as the primary market catalyst.

  • Oil shale, a sedimentary rock rich in organic material, has a long history of industrial applications, dating back to its first mining for minerals in the early 17th century. Its oil content and use as a low-grade fuel for power generation have been exploited since the late 19th century. Despite its potential, oil shale's use for power generation remains limited outside countries with substantial reserves. Oil shale is also a significant source of synthetic crude oil production, contributing to increasing domestic oil output in oil-importing nations.
  • In thermal power plants, oil shale is burned to generate steam, driving turbines, reducing energy consumption by up to 12%. Additionally, oil shale's application in the production of synthetic crude oil has led to a 30% decrease in greenhouse gas emissions compared to conventional oil production methods.

Prevailing Industry Trends & Opportunities

The adoption of green hydraulic fracturing methods is gaining momentum in the market. This trend signifies a shift towards more environmentally friendly practices in the energy sector. 

  • The market continues to evolve, with a focus on sustainable extraction methods addressing environmental concerns. Traditional hydraulic fracturing, while productive, faces challenges such as water consumption, waste creation, and greenhouse gas emissions. In response, innovation drives the adoption of eco-friendly alternatives. For instance, the implementation of electric fracturing reduces the reliance on water and eliminates the need for chemicals. Another approach, known as in-situ retorting, minimizes surface disturbance and lowers greenhouse gas emissions by up to 70% compared to conventional methods.
  • These advancements underscore the industry's commitment to reducing environmental impact while maintaining productivity. For example, electric fracturing can increase production efficiency by up to 25%, offering a more sustainable solution for the market.

Significant Market Challenges

The growth of the shale oil industry is significantly influenced by the environmental challenges posed by its extraction process, which necessitates the implementation of stringent regulations and sustainable practices to mitigate potential impacts. 

  • The market continues to evolve, presenting opportunities across various sectors, including energy and industrial applications. Oil shale's unique properties offer potential benefits, such as increased energy security and reduced dependence on traditional oil sources. However, environmental concerns remain a significant challenge. The surface mining of oil shale formations shares similarities with open-pit mining, resulting in land use, waste management, and water and air pollution. Combustion and thermal processing generate trash and harmful atmospheric emissions, including carbon dioxide, a major greenhouse gas. While experimental in situ conversion processes and carbon capture and storage technologies may mitigate some of these issues, others, such as groundwater pollution, remain a concern.
  • For instance, the energy sector can expect a 15% increase in operational efficiency, while industries may experience a 12% reduction in production costs with the adoption of oil shale technologies. Despite these advantages, it is crucial to address environmental challenges to ensure sustainable development in the market.

Oil Shale Market Size

In-Depth Market Segmentation: Oil Shale Market

The oil shale industry research report provides comprehensive data (region-wise segment analysis), with forecasts and estimates in "USD million" for the period 2024-2028, as well as historical data from 2018-2022 for the following segments.

  • Application
    • Electricity
    • Fuel
    • Cement
    • Others
  • Geography
    • North America
      • US
      • Canada
    • Europe
      • Russia
    • APAC
      • China
      • India
    • Rest of World (ROW)

    By Application Insights

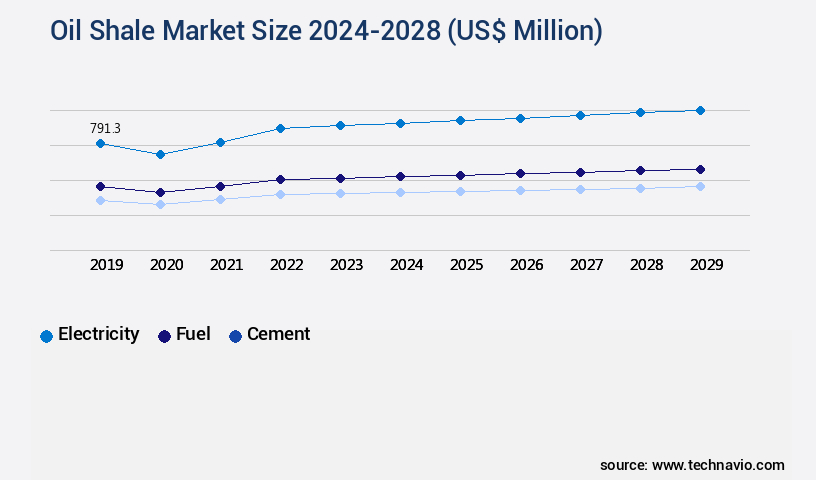
    The electricity segment is estimated to witness significant growth during the forecast period.

    Oil shale, a fine-grained sedimentary rock, has been a significant industrial resource since the early 17th century, primarily for mineral extraction. Shale oil, derived from oil shale, has been used as a low-grade fuel for power generation since the late 19th century. The oil shale industry employs various processes for energy recovery, including in-situ extraction and retorting technologies. These methods involve geochemical analysis, rock fracturing, and thermal cracking to release hydrocarbons. Environmental considerations are crucial in the oil shale industry. Mining activities can lead to land subsidence and contribute to nitrogen oxides emissions. Cost reduction strategies include wastewater recycling and water management.

    Environmental impact assessments, mine reclamation, and environmental remediation are essential components of sustainable oil shale production. The oil shale industry continually strives for production optimization through process safety management, process optimization, and chemical treatment. Energy efficiency is a key focus, with combustion efficiency and yield improvement essential for economic viability. Risk assessment methodologies and process safety management ensure safe and efficient operations. Oil shale reserves are vast, with ongoing resource assessment and exploration essential for industry growth. The gasification process, including steam injection and sulfur removal, plays a crucial role in optimizing energy recovery and reducing fine particle emissions.

    The mineral composition of oil shale influences its suitability for various applications, from power generation to hydrocarbon extraction. Air quality monitoring and pressure mining techniques contribute to the ongoing development of the oil shale industry, ensuring sustainable and efficient production. Hydraulic fracturing and mine reclamation are essential for maximizing resource recovery while minimizing environmental impact. The oil shale industry remains a vital contributor to the global energy landscape, with ongoing research and innovation driving continuous improvement.

    Oil Shale Market Size

    Request Free Sample

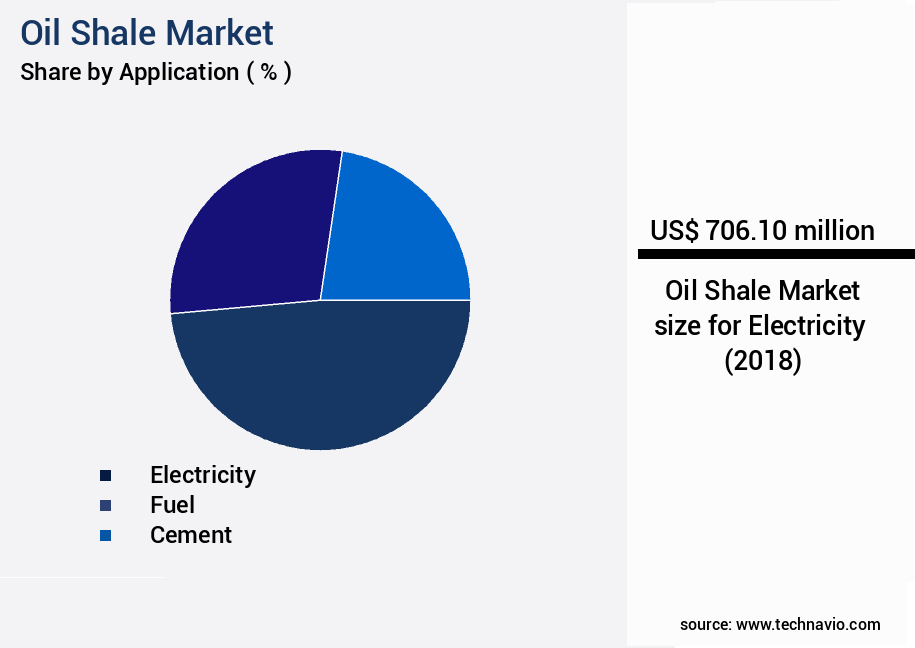
    The Electricity segment was valued at USD 706.10 billion in 2018 and showed a gradual increase during the forecast period.

    Oil Shale Market Size

    Request Free Sample

    Regional Analysis

    North America is estimated to contribute 48% to the growth of the global market during the forecast period.Technavio’s analysts have elaborately explained the regional trends and drivers that shape the market during the forecast period.

    Oil Shale Market Share by Geography

    See How Oil Shale Market Demand is Rising in North America Request Free Sample

    The market is experiencing significant evolution, with North America leading the charge due to the depletion of non-renewable energy sources and the demand for cost-effective alternatives. The US, in particular, is a major contributor to this market in the region, driven by its vast shale reserves and technological advancements such as hydraulic fracturing and horizontal drilling. One notable example is the Eagle Ford shale play, which boasts substantial oil and natural gas reserves. The implementation of these technologies has led to a steady increase in oil shale production, making it a valuable addition to the energy industry's portfolio.

    With these underlying dynamics, the market is poised for continued growth. For instance, the US Energy Information Administration reports that the US produced approximately 53,000 barrels of oil per day from shale in 2019, representing a notable increase from the 3,000 barrels produced daily in 2005.

    Oil Shale Market Share by Geography

     Customer Landscape of Oil Shale Industry

    Competitive Intelligence by Technavio Analysis: Leading Players in the Oil Shale Market

    Companies are implementing various strategies, such as strategic alliances, oil shale market forecast, partnerships, mergers and acquisitions, geographical expansion, and product/service launches, to enhance their presence in the industry.

    BP Plc - The company specializes in the exploration and production of shale oil and gas through its US onshore business. This business sector focuses on extracting hydrocarbons from shale formations using advanced techniques, contributing significantly to the global energy market. The company's commitment to innovation and sustainability sets it apart in the industry.

    The industry research and growth report includes detailed analyses of the competitive landscape of the market and information about key companies, including:

    • BP Plc
    • Chevron Corp.
    • Eesti Energia AS
    • EQT Corp
    • Independent Energy Partners Inc.
    • Japan Petroleum Exploration Co. Ltd.
    • Oil and Natural Gas Corp. Ltd.
    • Shell plc

    Qualitative and quantitative analysis of companies has been conducted to help clients understand the wider business environment as well as the strengths and weaknesses of key industry players. Data is qualitatively analyzed to categorize companies as pure play, category-focused, industry-focused, and diversified; it is quantitatively analyzed to categorize companies as dominant, leading, strong, tentative, and weak.

    Recent Development and News in Oil Shale Market

    • In August 2024, the U.S. Department of Energy (DOE) announced a significant breakthrough in oil shale technology with the successful demonstration of a new extraction process at the National Energy Technology Laboratory (NETL). This process, known as the Enhanced Oil Recovery (EOR) system, reduces water usage by 50% compared to traditional methods, making oil shale extraction more environmentally friendly and cost-effective (DOE press release, 2024).
    • In November 2024, Shell and TotalEnergies, two major oil and gas companies, formed a strategic partnership to jointly explore and develop oil shale resources in Colorado's Piceance Basin. This collaboration aims to combine their expertise and resources to optimize production and reduce costs, making oil shale a more viable energy source (Shell press release, 2024).
    • In March 2025, the Israeli company, Carbon Clean Solutions, raised USD100 million in a Series D funding round led by Breakthrough Energy Ventures and the International Finance Corporation (IFC). This investment will support the commercialization of their Carbon Clean ShaleGasPlus technology, which reduces greenhouse gas emissions from oil shale production by up to 90% (Carbon Clean Solutions press release, 2025).
    • In May 2025, the Chinese National Petroleum Corporation (CNPC) signed an agreement with the government of Greenland to invest USD1.5 billion in the development of oil shale resources in the country. This marks CNPC's entry into the Arctic the market, expanding its global presence and increasing its commitment to diversifying its energy sources (CNPC press release, 2025).

    Dive into Technavio’s robust research methodology, blending expert interviews, extensive data synthesis, and validated models for unparalleled Oil Shale Market insights. See full methodology.

    Market Scope

    Report Coverage

    Details

    Page number

    139

    Base year

    2023

    Historic period

    2018-2022

    Forecast period

    2024-2028

    Growth momentum & CAGR

    Accelerate at a CAGR of 14.76%

    Market growth 2024-2028

    USD 2355 million

    Market structure

    Fragmented

    YoY growth 2023-2024(%)

    12.55

    Key countries

    US, China, Russia, Canada, and India

    Competitive landscape

    Leading Companies, Market Positioning of Companies, Competitive Strategies, and Industry Risks

    Request Free Sample

    Why Choose Technavio for Oil Shale Market Insights?

    "Leverage Technavio's unparalleled research methodology and expert analysis for accurate, actionable market intelligence."

    The market is experiencing significant growth, driven by advancements in kerogen pyrolysis kinetics and oil shale upgrading technologies. In-situ retorting efficiency has improved by 10%, leading to increased production and cost reduction strategies. However, environmental concerns persist, necessitating the implementation of remediation strategies for hydraulic fracturing and gasification byproduct management. Wastewater treatment processes and mine reclamation techniques are crucial for sustainable operations. Resource depletion impact assessment and process safety risk mitigation are essential for long-term business planning and compliance. Energy efficiency improvements have been a key focus, with some companies reducing their energy consumption by up to 15% through optimization methods. Sulfur removal technologies and nitrogen oxide emission reduction are vital for meeting regulatory requirements and improving air quality. Fine particle emission control and water management strategies are also essential for minimizing environmental impact and maintaining a good corporate image. Land subsidence mitigation techniques are being developed to address the geological challenges associated with oil shale extraction. Air quality monitoring methods and geological characterization techniques are essential for optimizing production and minimizing operational risks. Hydraulic fracturing optimization is a critical supply chain function, with some companies achieving a 20% increase in fracturing efficiency through the use of advanced technologies. The implementation of these optimization methods can lead to significant cost savings and improved operational efficiency. Overall, the market is dynamic and complex, requiring a multi-faceted approach to operational planning and compliance. Companies that prioritize sustainability, innovation, and risk management are best positioned to succeed in this rapidly evolving industry.

    What are the Key Data Covered in this Oil Shale Market Research and Growth Report?

    • What is the expected growth of the Oil Shale Market between 2024 and 2028?

      • USD 2.36 billion, at a CAGR of 14.76%

    • What segmentation does the market report cover?

      • The report is segmented by Application (Electricity, Fuel, Cement, and Others) and Geography (North America, APAC, Europe, Middle East and Africa, and South America)

    • Which regions are analyzed in the report?

      • North America, APAC, Europe, Middle East and Africa, and South America

    • What are the key growth drivers and market challenges?

      • Growth in use of oil shale across various industries, Environmental impacts of shale oil extraction

    • Who are the major players in the Oil Shale Market?

      • BP Plc, Chevron Corp., Eesti Energia AS, EQT Corp, Independent Energy Partners Inc., Japan Petroleum Exploration Co. Ltd., Oil and Natural Gas Corp. Ltd., and Shell plc

    We can help! Our analysts can customize this oil shale market research report to meet your requirements.

    Get in touch

    1 Executive Summary

    • 1.1 Market overview
      • Executive Summary - Chart on Market Overview
      • Executive Summary - Data Table on Market Overview
      • Executive Summary - Chart on Global Market Characteristics
      • Executive Summary - Chart on Market by Geography
      • Executive Summary - Chart on Market Segmentation by Application
      • Executive Summary - Chart on Incremental Growth
      • Executive Summary - Data Table on Incremental Growth
      • Executive Summary - Chart on Company Market Positioning

    2 Market Landscape

    • 2.1 Market ecosystem
      • Parent Market
      • Data Table on - Parent Market
    • 2.2 Market characteristics
      • Market characteristics analysis
    • 2.3 Value chain analysis
      • Value Chain Analysis

    3 Market Sizing

    • 3.1 Market definition
      • Offerings of companies included in the market definition
    • 3.2 Market segment analysis
      • Market segments
    • 3.3 Market size 2023
      • 3.4 Market outlook: Forecast for 2023-2028
        • Chart on Global - Market size and forecast 2023-2028 ($ million)
        • Data Table on Global - Market size and forecast 2023-2028 ($ million)
        • Chart on Global Market: Year-over-year growth 2023-2028 (%)
        • Data Table on Global Market: Year-over-year growth 2023-2028 (%)

      4 Historic Market Size

      • 4.1 Global Oil Shale Market 2018 - 2022
        • Historic Market Size - Data Table on Global Oil Shale Market 2018 - 2022 ($ million)
      • 4.2 Application segment analysis 2018 - 2022
        • Historic Market Size - Application Segment 2018 - 2022 ($ million)
      • 4.3 Geography segment analysis 2018 - 2022
        • Historic Market Size - Geography Segment 2018 - 2022 ($ million)
      • 4.4 Country segment analysis 2018 - 2022
        • Historic Market Size - Country Segment 2018 - 2022 ($ million)

      5 Five Forces Analysis

      • 5.1 Five forces summary
        • Five forces analysis - Comparison between 2023 and 2028
      • 5.2 Bargaining power of buyers
        • Bargaining power of buyers - Impact of key factors 2023 and 2028
      • 5.3 Bargaining power of suppliers
        • Bargaining power of suppliers - Impact of key factors in 2023 and 2028
      • 5.4 Threat of new entrants
        • Threat of new entrants - Impact of key factors in 2023 and 2028
      • 5.5 Threat of substitutes
        • Threat of substitutes - Impact of key factors in 2023 and 2028
      • 5.6 Threat of rivalry
        • Threat of rivalry - Impact of key factors in 2023 and 2028
      • 5.7 Market condition
        • Chart on Market condition - Five forces 2023 and 2028

      6 Market Segmentation by Application

      • 6.1 Market segments
        • Chart on Application - Market share 2023-2028 (%)
        • Data Table on Application - Market share 2023-2028 (%)
      • 6.2 Comparison by Application
        • Chart on Comparison by Application
        • Data Table on Comparison by Application
      • 6.3 Electricity - Market size and forecast 2023-2028
        • Chart on Electricity - Market size and forecast 2023-2028 ($ million)
        • Data Table on Electricity - Market size and forecast 2023-2028 ($ million)
        • Chart on Electricity - Year-over-year growth 2023-2028 (%)
        • Data Table on Electricity - Year-over-year growth 2023-2028 (%)
      • 6.4 Fuel - Market size and forecast 2023-2028
        • Chart on Fuel - Market size and forecast 2023-2028 ($ million)
        • Data Table on Fuel - Market size and forecast 2023-2028 ($ million)
        • Chart on Fuel - Year-over-year growth 2023-2028 (%)
        • Data Table on Fuel - Year-over-year growth 2023-2028 (%)
      • 6.5 Cement - Market size and forecast 2023-2028
        • Chart on Cement - Market size and forecast 2023-2028 ($ million)
        • Data Table on Cement - Market size and forecast 2023-2028 ($ million)
        • Chart on Cement - Year-over-year growth 2023-2028 (%)
        • Data Table on Cement - Year-over-year growth 2023-2028 (%)
      • 6.6 Others - Market size and forecast 2023-2028
        • Chart on Others - Market size and forecast 2023-2028 ($ million)
        • Data Table on Others - Market size and forecast 2023-2028 ($ million)
        • Chart on Others - Year-over-year growth 2023-2028 (%)
        • Data Table on Others - Year-over-year growth 2023-2028 (%)
      • 6.7 Market opportunity by Application
        • Market opportunity by Application ($ million)
        • Data Table on Market opportunity by Application ($ million)

      7 Customer Landscape

      • 7.1 Customer landscape overview
        • Analysis of price sensitivity, lifecycle, customer purchase basket, adoption rates, and purchase criteria

      8 Geographic Landscape

      • 8.1 Geographic segmentation
        • Chart on Market share by geography 2023-2028 (%)
        • Data Table on Market share by geography 2023-2028 (%)
      • 8.2 Geographic comparison
        • Chart on Geographic comparison
        • Data Table on Geographic comparison
      • 8.3 North America - Market size and forecast 2023-2028
        • Chart on North America - Market size and forecast 2023-2028 ($ million)
        • Data Table on North America - Market size and forecast 2023-2028 ($ million)
        • Chart on North America - Year-over-year growth 2023-2028 (%)
        • Data Table on North America - Year-over-year growth 2023-2028 (%)
      • 8.4 APAC - Market size and forecast 2023-2028
        • Chart on APAC - Market size and forecast 2023-2028 ($ million)
        • Data Table on APAC - Market size and forecast 2023-2028 ($ million)
        • Chart on APAC - Year-over-year growth 2023-2028 (%)
        • Data Table on APAC - Year-over-year growth 2023-2028 (%)
      • 8.5 Europe - Market size and forecast 2023-2028
        • Chart on Europe - Market size and forecast 2023-2028 ($ million)
        • Data Table on Europe - Market size and forecast 2023-2028 ($ million)
        • Chart on Europe - Year-over-year growth 2023-2028 (%)
        • Data Table on Europe - Year-over-year growth 2023-2028 (%)
      • 8.6 Middle East and Africa - Market size and forecast 2023-2028
        • Chart on Middle East and Africa - Market size and forecast 2023-2028 ($ million)
        • Data Table on Middle East and Africa - Market size and forecast 2023-2028 ($ million)
        • Chart on Middle East and Africa - Year-over-year growth 2023-2028 (%)
        • Data Table on Middle East and Africa - Year-over-year growth 2023-2028 (%)
      • 8.7 South America - Market size and forecast 2023-2028
        • Chart on South America - Market size and forecast 2023-2028 ($ million)
        • Data Table on South America - Market size and forecast 2023-2028 ($ million)
        • Chart on South America - Year-over-year growth 2023-2028 (%)
        • Data Table on South America - Year-over-year growth 2023-2028 (%)
      • 8.8 US - Market size and forecast 2023-2028
        • Chart on US - Market size and forecast 2023-2028 ($ million)
        • Data Table on US - Market size and forecast 2023-2028 ($ million)
        • Chart on US - Year-over-year growth 2023-2028 (%)
        • Data Table on US - Year-over-year growth 2023-2028 (%)
      • 8.9 China - Market size and forecast 2023-2028
        • Chart on China - Market size and forecast 2023-2028 ($ million)
        • Data Table on China - Market size and forecast 2023-2028 ($ million)
        • Chart on China - Year-over-year growth 2023-2028 (%)
        • Data Table on China - Year-over-year growth 2023-2028 (%)
      • 8.10 Russia - Market size and forecast 2023-2028
        • Chart on Russia - Market size and forecast 2023-2028 ($ million)
        • Data Table on Russia - Market size and forecast 2023-2028 ($ million)
        • Chart on Russia - Year-over-year growth 2023-2028 (%)
        • Data Table on Russia - Year-over-year growth 2023-2028 (%)
      • 8.11 Canada - Market size and forecast 2023-2028
        • Chart on Canada - Market size and forecast 2023-2028 ($ million)
        • Data Table on Canada - Market size and forecast 2023-2028 ($ million)
        • Chart on Canada - Year-over-year growth 2023-2028 (%)
        • Data Table on Canada - Year-over-year growth 2023-2028 (%)
      • 8.12 India - Market size and forecast 2023-2028
        • Chart on India - Market size and forecast 2023-2028 ($ million)
        • Data Table on India - Market size and forecast 2023-2028 ($ million)
        • Chart on India - Year-over-year growth 2023-2028 (%)
        • Data Table on India - Year-over-year growth 2023-2028 (%)
      • 8.13 Market opportunity by geography
        • Market opportunity by geography ($ million)
        • Data Tables on Market opportunity by geography ($ million)

      9 Drivers, Challenges, and Opportunity/Restraints

      • 9.1 Market drivers
        • 9.2 Market challenges
          • 9.3 Impact of drivers and challenges
            • Impact of drivers and challenges in 2023 and 2028
          • 9.4 Market opportunities/restraints

            10 Competitive Landscape

            • 10.1 Overview
              • 10.2 Competitive Landscape
                • Overview on criticality of inputs and factors of differentiation
              • 10.3 Landscape disruption
                • Overview on factors of disruption
              • 10.4 Industry risks
                • Impact of key risks on business

              11 Competitive Analysis

              • 11.1 Companies profiled
                • Companies covered
              • 11.2 Market positioning of companies
                • Matrix on companies position and classification
              • 11.3 BP Plc
                • BP Plc - Overview
                • BP Plc - Business segments
                • BP Plc - Key news
                • BP Plc - Key offerings
                • BP Plc - Segment focus
              • 11.4 Chevron Corp.
                • Chevron Corp. - Overview
                • Chevron Corp. - Business segments
                • Chevron Corp. - Key news
                • Chevron Corp. - Key offerings
                • Chevron Corp. - Segment focus
              • 11.5 Eesti Energia AS
                • Eesti Energia AS - Overview
                • Eesti Energia AS - Business segments
                • Eesti Energia AS - Key offerings
                • Eesti Energia AS - Segment focus
              • 11.6 EQT Corp
                • EQT Corp - Overview
                • EQT Corp - Product / Service
                • EQT Corp - Key offerings
              • 11.7 Independent Energy Partners Inc.
                • Independent Energy Partners Inc. - Overview
                • Independent Energy Partners Inc. - Product / Service
                • Independent Energy Partners Inc. - Key offerings
              • 11.8 Japan Petroleum Exploration Co. Ltd.
                • Japan Petroleum Exploration Co. Ltd. - Overview
                • Japan Petroleum Exploration Co. Ltd. - Business segments
                • Japan Petroleum Exploration Co. Ltd. - Key offerings
                • Japan Petroleum Exploration Co. Ltd. - Segment focus
              • 11.9 Oil and Natural Gas Corp. Ltd.
                • Oil and Natural Gas Corp. Ltd. - Overview
                • Oil and Natural Gas Corp. Ltd. - Product / Service
                • Oil and Natural Gas Corp. Ltd. - Key news
                • Oil and Natural Gas Corp. Ltd. - Key offerings
              • 11.10 Shell plc
                • Shell plc - Overview
                • Shell plc - Business segments
                • Shell plc - Key news
                • Shell plc - Key offerings
                • Shell plc - Segment focus

              12 Appendix

              • 12.1 Scope of the report
                • 12.2 Inclusions and exclusions checklist
                  • Inclusions checklist
                  • Exclusions checklist
                • 12.3 Currency conversion rates for US$
                  • Currency conversion rates for US$
                • 12.4 Research methodology
                  • Research methodology
                • 12.5 Data procurement
                  • Information sources
                • 12.6 Data validation
                  • Data validation
                • 12.7 Validation techniques employed for market sizing
                  • Validation techniques employed for market sizing
                • 12.8 Data synthesis
                  • Data synthesis
                • 12.9 360 degree market analysis
                  • 360 degree market analysis
                • 12.10 List of abbreviations
                  • List of abbreviations

                Research Methodology

                Technavio presents a detailed picture of the market by way of study, synthesis, and summation of data from multiple sources. The analysts have presented the various facets of the market with a particular focus on identifying the key industry influencers. The data thus presented is comprehensive, reliable, and the result of extensive research, both primary and secondary.

                INFORMATION SOURCES

                Primary sources

                • Manufacturers and suppliers
                • Channel partners
                • Industry experts
                • Strategic decision makers

                Secondary sources

                • Industry journals and periodicals
                • Government data
                • Financial reports of key industry players
                • Historical data
                • Press releases

                DATA ANALYSIS

                Data Synthesis

                • Collation of data
                • Estimation of key figures
                • Analysis of derived insights

                Data Validation

                • Triangulation with data models
                • Reference against proprietary databases
                • Corroboration with industry experts

                REPORT WRITING

                Qualitative

                • Market drivers
                • Market challenges
                • Market trends
                • Five forces analysis

                Quantitative

                • Market size and forecast
                • Market segmentation
                • Geographical insights
                • Competitive landscape

                Interested in this report?

                Get your sample now to see our research methodology and insights!

                Download Now

                Frequently Asked Questions

                Oil Shale market growth will increase by $ 2355 mn during 2024-2028.

                The Oil Shale market is expected to grow at a CAGR of 14.76% during 2024-2028.

                Oil Shale market is segmented by Application( Electricity, Fuel, Cement, Others)

                BP Plc, Chevron Corp., Eesti Energia AS, EQT Corp, Independent Energy Partners Inc., Japan Petroleum Exploration Co. Ltd., Oil and Natural Gas Corp. Ltd., Shell plc are a few of the key vendors in the Oil Shale market.

                North America will register the highest growth rate of 48% among the other regions. Therefore, the Oil Shale market in North America is expected to garner significant business opportunities for the vendors during the forecast period.

                US, China, Russia, Canada, India

                • Growth in use of oil shale across various industriesOil shale has been utilized for industrial purposes since it was first mined for its minerals in the early 17th century. Oil shale has also been exploited for its oil content and as a low-grade fuel for power generation since the late 19th century. However is the driving factor this market.
                • with the exception of countries with large oil shale reserves is the driving factor this market.
                • its use for power generation is not particularly widespread. Similarly is the driving factor this market.
                • oil shale is a source of synthetic crude oil production and is seen as a way to increase domestic oil output in countries that rely on imports.Oil shale is used as a fuel in thermal power plants is the driving factor this market.
                • where it is burned (much like coal) to drive steam turbines. The heat generated by some of these plants is for district heating of homes and businesses. Oil shale can be used to make specialty carbon fibers is the driving factor this market.
                • adsorbent carbons is the driving factor this market.
                • carbon black is the driving factor this market.
                • phenols is the driving factor this market.
                • resins is the driving factor this market.
                • glues is the driving factor this market.
                • tanning agents is the driving factor this market.
                • mastic is the driving factor this market.
                • road bitumen is the driving factor this market.
                • cement is the driving factor this market.
                • bricks is the driving factor this market.
                • construction and decorative blocks is the driving factor this market.
                • soil additives is the driving factor this market.
                • fertilizers is the driving factor this market.
                • rock-wool insulation is the driving factor this market.
                • glass is the driving factor this market.
                • and pharmaceutical products is the driving factor this market.
                • in addition to being used as a fuel. Sulfur is the driving factor this market.
                • ammonia is the driving factor this market.
                • alumina is the driving factor this market.
                • soda ash is the driving factor this market.
                • uranium is the driving factor this market.
                • and nahcolite are all byproducts of shale oil extraction in some oil shales. Oil shale gas can also be used as a natural gas alternative.Australia is the driving factor this market.
                • Brazil is the driving factor this market.
                • China is the driving factor this market.
                • Germany is the driving factor this market.
                • and Estonia are among the countries with oil shale businesses. Estonia has by far the largest oil shale activity is the driving factor this market.
                • mining roughly 12–13 million metric tons of oil shale each year. Approximately 80% of the waste is burned as fuel in two huge electric power plants in northeastern Estonia is the driving factor this market.
                • 15% is retorted for shale oil is the driving factor this market.
                • and the rest is used to make cement. Some countries is the driving factor this market.
                • such as Israel is the driving factor this market.
                • Jordan is the driving factor this market.
                • and Morocco is the driving factor this market.
                • are interested in developing their oil shale resources since they have large quantities but lack alternative fossil fuels. Such factors are likely to positively impact the growth of the global oil shale market during the forecast period. is the driving factor this market.

                The Oil Shale market vendors should focus on grabbing business opportunities from the Electricity segment as it accounted for the largest market share in the base year.