Oil And Gas Upstream Equipment Market Analysis, Size, and Forecast 2025-2029: North America (US and Canada), Europe (France, Germany, UK), APAC (China, India, Japan), South America (Brazil), and Middle East and Africa (UAE)

Oil And Gas Upstream Equipment Market Analysis, Size, and Forecast 2025-2029:
North America (US and Canada), Europe (France, Germany, UK), APAC (China, India, Japan), South America (Brazil), and Middle East and Africa (UAE)

Published: Feb 2025 229 Pages SKU: IRTNTR73168

Market Overview at a Glance

$11.81 B
Market Opportunity
3.3%
CAGR
3.2
YoY growth 2024-2025(%)

Oil And Gas Upstream Equipment Market Size 2025-2029

The oil and gas upstream equipment market size is forecast to increase by USD 11.81 billion, at a CAGR of 3.3% between 2024 and 2029.

  • The market is driven by the increasing preference for pipeline transportation and the rising adoption of digitalization and automation in upstream operations. Pipeline transportation is favored due to its cost-effectiveness and environmental sustainability, making it an attractive alternative to traditional methods of transporting oil and gas. Furthermore, the integration of digital technologies and automation in upstream processes enhances operational efficiency, reduces costs, and improves safety. However, the market faces challenges from the uncertainties associated with low crude oil prices. The volatility in oil prices can significantly impact the profitability of upstream projects, making it essential for companies to adopt risk management strategies and explore alternative revenue streams.
  • Additionally, the implementation of digitalization and automation requires substantial investment, which may be a barrier for smaller players in the market. Companies seeking to capitalize on opportunities in the market must focus on optimizing their pipeline networks and investing in digital technologies to enhance operational efficiency while managing risks associated with price volatility.

What will be the Size of the Oil And Gas Upstream Equipment Market during the forecast period?

Oil And Gas Upstream Equipment Market Size

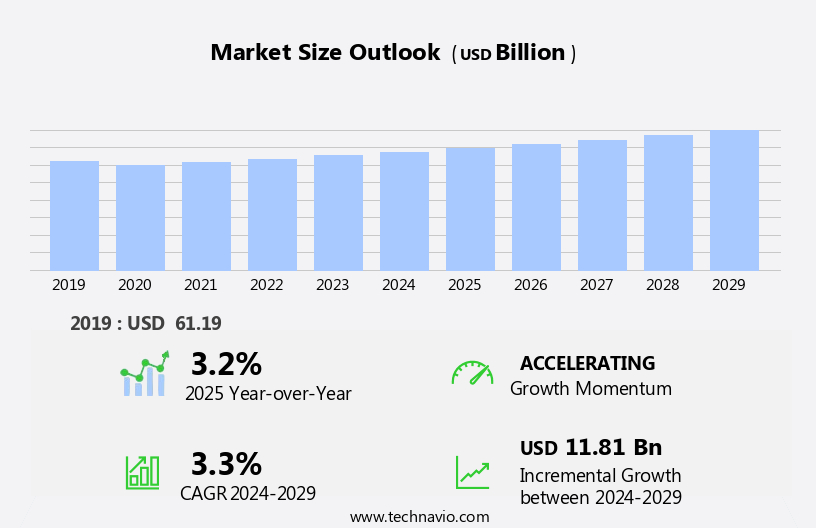
Explore in-depth regional segment analysis with market size data - historical 2019-2023 and forecasts 2025-2029 - in the full report.  
Request Free Sample

The market is characterized by its continuous evolution and dynamic nature, driven by the ever-changing requirements of various sectors. Entities such as flow assurance, reservoir stimulation, downstream operations, market volatility, drilling services, renewable energy, sustainable energy, hydrocarbon recovery, drilling efficiency, safety equipment, upstream operations, well logging, remote operations, enhanced oil recovery, reservoir characterization, workforce development, energy security, resource estimation, training and certification, seismic surveys, environmental regulations, geopolitical risks, and more, play integral roles in this complex ecosystem. Flow assurance solutions ensure uninterrupted production by addressing challenges related to solid and liquid formation in pipelines, while reservoir stimulation techniques enhance hydrocarbon recovery through the injection of chemicals or gases.

Downstream operations encompass the processing and refining of crude oil into marketable products, while renewable energy and sustainable energy solutions are increasingly being integrated into the industry to reduce emissions and promote sustainability. Market volatility, driven by factors such as supply chain disruptions, geopolitical risks, and ESG factors, necessitates the adoption of flexible and efficient drilling services. Drilling efficiency is a critical focus area, with horizontal drilling, directional drilling, and pressure testing playing essential roles in optimizing drilling operations. Safety equipment and upstream operations are paramount to maintaining operational excellence and ensuring the wellbeing of personnel.

Well logging and remote operations enable real-time data analysis and intervention, enhancing production optimization and efficiency. Enhanced oil recovery techniques, such as hydraulic fracturing, are employed to extract residual hydrocarbons from mature reservoirs. Cloud computing and big data analytics facilitate the digital oilfield, enabling data-driven decision-making and improving overall industry performance. The ongoing energy transition and the integration of renewable energy and sustainable energy solutions into the oil and gas industry present new opportunities and challenges. Pipeline infrastructure and gas processing remain crucial components of the value chain, while industry standards continue to evolve to address emerging trends and technologies.

The market is a dynamic and intricate system, requiring a deep understanding of its various components and their interconnectedness to effectively navigate its complexities.

How is this Oil And Gas Upstream Equipment Industry segmented?

The oil and gas upstream equipment industry research report provides comprehensive data (region-wise segment analysis), with forecasts and estimates in "USD billion" for the period 2025-2029, as well as historical data from 2019-2023 for the following segments.

  • Application
    • Exploration and drilling
    • Completion and procedure
    • Others
  • Deployment
    • Onshore
    • Offshore
  • Type
    • Drilling equipment
    • Production equipment
    • Well intervention equipment
    • Pressure control equipment
    • Others
  • Component
    • Surface Equipment
    • Subsurface Equipment
    • Drilling Tools
    • Pumps and Valves
    • Others
  • Geography
    • North America
      • US
      • Canada
    • Europe
      • France
      • Germany
      • UK
    • Middle East and Africa
      • UAE
    • APAC
      • China
      • India
      • Japan
    • South America
      • Brazil
    • Rest of World (ROW)

    By Application Insights

    The exploration and drilling segment is estimated to witness significant growth during the forecast period.

    In the upstream sector of the oil and gas industry, the exploration process begins with advanced geological mapping using seismic surveys. Technologically advanced methods, including reflective, passive, gravity, and magnetic surveys, are employed to identify potentially hydrocarbon-bearing rocks, or prospects. Subsequently, exploratory wells are drilled to recover crude oil or natural gas. Seismic surveys utilize sophisticated technologies such as streamers, vessels, hydrophones, geophones, and receivers to capture vast amounts of high-frequency data throughout the entire seismic survey value chain. Geologists analyze this data in real-time to pinpoint the optimal location for production. Drilling fluids play a crucial role in the drilling process, ensuring efficient and safe drilling operations.

    Well performance analysis and well intervention are essential to optimize production and maintain well integrity. Horizontal drilling and directional drilling techniques enhance reservoir access and recovery. Reservoir engineering and characterization are integral to understanding the reservoir's properties and maximizing hydrocarbon recovery. Corrosion prevention and emissions reduction are essential aspects of upstream operations, ensuring safety, efficiency, and environmental compliance. Well completion and production platforms facilitate the production process, while petroleum geology and reservoir stimulation techniques, such as hydraulic fracturing, enhance oil and gas recovery. Cloud computing and big data analytics enable real-time data processing and analysis, optimizing production efficiency and flow assurance.

    Industry standards and regulations govern safety, environmental, and operational aspects of upstream operations. The energy transition and the integration of renewable and sustainable energy sources impact the oil and gas industry, necessitating adaptations and innovations. Midstream operations, downstream operations, and the digital oilfield facilitate the integration of various aspects of the energy value chain. Market volatility, geopolitical risks, and supply chain disruptions pose challenges to the upstream sector. Safety equipment, remote operations, and enhanced oil recovery techniques mitigate these risks and improve production efficiency. Workforce development, training, and certification are essential for maintaining a skilled workforce and ensuring energy security.

    Subsea equipment and offshore platforms expand the reach of upstream operations, enabling exploration and production in deeper waters and challenging environments. Data management and ESG factors are increasingly important considerations in upstream operations, ensuring transparency, sustainability, and social responsibility.

    Oil And Gas Upstream Equipment Market Size

    Request Free Sample

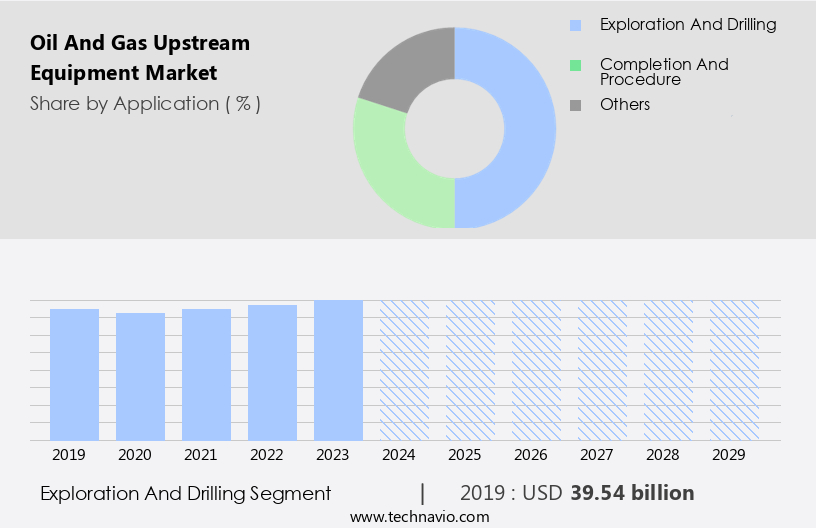
    The Exploration and drilling segment was valued at USD 39.54 billion in 2019 and showed a gradual increase during the forecast period.

    Regional Analysis

    North America is estimated to contribute 36% to the growth of the global market during the forecast period.Technavio’s analysts have elaborately explained the regional trends and drivers that shape the market during the forecast period.

    Oil And Gas Upstream Equipment Market Share by Geography

     Request Free Sample

    The North American region dominates the market due to its high rig count and the resumption of deep and ultra-deep oil and gas projects in the Gulf of Mexico. Crude oil price stabilization has fueled this trend, increasing the potential for market growth. Unconventional energy sources, such as shale and oil sands, are also driving demand for upstream equipment as drilling and production continue in this sector. Advancements in technologies like artificial intelligence (AI), big data analytics, cloud computing, and digital oilfield are transforming upstream operations. These technologies enable real-time well performance analysis, production optimization, and remote operations, enhancing efficiency and safety.

    Horizontal drilling and hydraulic fracturing have become essential techniques for accessing unconventional resources, leading to increased demand for drilling services, well completion equipment, and production services. Corrosion prevention and emissions reduction technologies are also gaining traction due to environmental regulations and the energy transition towards renewable and sustainable energy sources. Midstream operations, including pipeline infrastructure and gas processing, require upstream equipment for transportation and processing of raw hydrocarbons. Industry standards and regulations, such as those related to safety, flow assurance, and reservoir characterization, are crucial for ensuring the safe and efficient operation of upstream equipment. Directional drilling and reservoir engineering play a significant role in maximizing hydrocarbon recovery, while reservoir stimulation techniques like enhanced oil recovery are essential for extracting hard-to-reach reserves.

    Upstream equipment is also critical for downstream operations, including refining and petrochemical processing. Market volatility, geopolitical risks, and supply chain disruptions are some challenges facing the market. However, opportunities exist for innovation and growth, particularly in the areas of ESG factors, subsea equipment, and offshore platforms. In conclusion, the market is dynamic and evolving, driven by factors such as technological advancements, market trends, and regulatory requirements. The market's future potential lies in its ability to adapt to these changes and meet the demands of the energy industry.

    Market Dynamics

    Our researchers analyzed the data with 2024 as the base year, along with the key drivers, trends, and challenges. A holistic analysis of drivers will help companies refine their marketing strategies to gain a competitive advantage.

    What are the key market drivers leading to the rise in the adoption of Oil And Gas Upstream Equipment Industry?

    • The growing demand for pipeline transportation is the primary factor fueling market growth. (Maintaining a professional tone, ensuring grammatical correctness, and adhering to the 100-word limit.) 

    • The market encompasses the production phase of the energy value chain, focusing on wellhead equipment, hydraulic fracturing, directional drilling, and gas processing. This market is characterized by the adoption of advanced technologies such as cloud computing, big data analytics, and the digital oilfield to enhance production services and optimize production efficiency. Hydraulic fracturing, a critical process in extracting shale gas and oil, has significantly impacted global energy markets by increasing production volumes. The oil and gas industry is undergoing a transformation, with the energy transition towards renewable energy sources gaining momentum. However, the oil and gas sector continues to invest in technology to improve production and reduce operational costs.
    • Production optimization and efficiency are key priorities, with industry standards and regulations driving the adoption of new technologies. Gas processing is another crucial aspect of the upstream equipment market, ensuring the purity and quality of natural gas before it is transported to end-users. The transportation of oil and gas is primarily through pipelines due to their energy efficiency and low carbon footprint, making them the preferred choice for long-distance transport. The market is a long-term investment, with projects having an average life cycle of 20-30 years.

    What are the market trends shaping the Oil And Gas Upstream Equipment Industry?

    • The increasing prevalence of digitalization and automation represents a significant market trend. This shift towards technology-driven solutions is mandatory for businesses seeking to remain competitive and efficient.

    • In the market, digitalization plays a significant role in enhancing operations' efficiency and safety. The integration of sensors and IoT devices enables real-time data collection from equipment and assets, allowing operators to monitor performance and condition remotely. Advanced analytics and machine learning algorithms are employed to predict equipment failures, optimize production processes, and schedule maintenance proactively. Automation facilitates remote monitoring and control of drilling rigs, production facilities, and pipelines, reducing the need for on-site personnel and operational costs. Furthermore, digitalization supports enhanced oil recovery techniques such as flow assurance, reservoir stimulation, and well logging. Market volatility, driven by factors like crude oil prices, geopolitical risks, and regulatory changes, necessitates the adoption of digital solutions to improve hydrocarbon recovery and drilling efficiency.
    • Safety equipment and remote operations are essential in upstream operations, especially in hazardous environments. The transition towards sustainable energy and renewable sources may impact the market's growth, but digitalization offers opportunities for cost savings and operational improvements.

    What challenges does the Oil And Gas Upstream Equipment Industry face during its growth?

    • The uncertainties surrounding the impact of low crude oil prices on industry growth represent a significant challenge for the sector. 

    • The market experiences significant influence from various factors. Commodity price fluctuations, a key market driver, can significantly impact the financial health of upstream sector companies. The recent trend of low crude oil prices has put immense pressure on these firms, compelling many to halt exploration and drilling projects. Pureplay upstream companies have been particularly affected, as they lack the diversification offered by integrated oil companies. However, the market dynamics are not entirely bleak. Workforce development and reservoir characterization remain crucial for enhancing resource estimation and improving operational efficiency. Training and certification programs, geopolitical risks, and environmental regulations are other critical factors shaping the market.
    • Seismic surveys and data management are essential for effective reservoir characterization. Environmental regulations and ESG factors are becoming increasingly important, as companies strive to minimize their carbon footprint and adhere to sustainability standards. Moreover, supply chain disruptions and geopolitical risks pose significant challenges. The ongoing tensions in various regions can lead to uncertainties and potential disruptions in the supply of raw materials and equipment. Drilling rigs, subsea equipment, and offshore platforms are integral components of the upstream sector, requiring continuous innovation and technological advancements to maintain competitiveness. In conclusion, the market faces numerous challenges, including price volatility, regulatory pressures, and geopolitical risks.
    • However, companies that invest in workforce development, technology, and operational efficiency are well-positioned to navigate these challenges and thrive in the evolving energy landscape.

    Exclusive Customer Landscape

    The oil and gas upstream equipment market forecasting report includes the adoption lifecycle of the market, covering from the innovator’s stage to the laggard’s stage. It focuses on adoption rates in different regions based on penetration. Furthermore, the oil and gas upstream equipment market report also includes key purchase criteria and drivers of price sensitivity to help companies evaluate and develop their market growth analysis strategies.

    Oil And Gas Upstream Equipment Market Share by Geography

     Customer Landscape

    Key Companies & Market Insights

    Companies are implementing various strategies, such as strategic alliances, oil and gas upstream equipment market forecast, partnerships, mergers and acquisitions, geographical expansion, and product/service launches, to enhance their presence in the industry.

    Aker Solutions ASA - The company specializes in supplying advanced Oil & Gas upstream solutions, encompassing equipment such as wellheads, subsea trees, and tie-in systems. These offerings optimize operational efficiency and enhance overall performance in the energy sector. Our expertise lies in delivering cutting-edge technology and exceptional engineering, ensuring clients' projects are executed with precision and reliability. Our commitment to innovation and quality sets us apart in the market, ultimately contributing to our clients' success.

    The industry research and growth report includes detailed analyses of the competitive landscape of the market and information about key companies, including:

    • Aker Solutions ASA
    • Archer Ltd.
    • ATB Holding Spa
    • Atlas Copco AB
    • AXON Pressure Products Inc.
    • Dril Quip Inc.
    • Evolution Oil Tools Inc.
    • Flowserve Corp.
    • Forum Energy Technologies Inc.
    • General Electric Co.
    • Geometrics Inc.
    • Halliburton Co.
    • Helmerich and Payne Inc.
    • NOV Inc.
    • Schlumberger Ltd.
    • Seadrill Ltd.
    • Siemens AG
    • SPX FLOW Inc.
    • Sumitomo Corp.
    • Weatherford International Plc

    Qualitative and quantitative analysis of companies has been conducted to help clients understand the wider business environment as well as the strengths and weaknesses of key industry players. Data is qualitatively analyzed to categorize companies as pure play, category-focused, industry-focused, and diversified; it is quantitatively analyzed to categorize companies as dominant, leading, strong, tentative, and weak.

    Recent Development and News in Oil And Gas Upstream Equipment Market

    • In March 2023, Baker Hughes, a GE company, announced the launch of its new ShaleReef completions system, which utilizes advanced reservoir modeling and digital technologies to optimize oil and gas production in unconventional reservoirs (Baker Hughes press release, 2023). This innovation is expected to enhance efficiency and reduce costs for upstream oil and gas operators.
    • In August 2024, Shell and TotalEnergies formed a strategic collaboration to develop and commercialize hydrogen and carbon capture technologies. The partnership aims to reduce carbon emissions in the oil and gas industry by focusing on the production, transport, and utilization of hydrogen (Shell press release, 2024). This collaboration signifies a significant shift towards sustainable energy solutions in the upstream sector.
    • In January 2025, Equinor and ExxonMobil announced a merger of their upstream businesses in the US Gulf of Mexico. The combined entity, named Gulf of Mexico Upstream Partnership, will create the largest oil and gas producer in the region, with an estimated 1.6 million barrels of oil equivalent per day in production (ExxonMobil press release, 2025). This merger represents a major consolidation within the upstream market.
    • In May 2025, Saudi Aramco and Siemens Energy signed a memorandum of understanding to collaborate on the development and deployment of carbon capture, utilization, and storage (CCUS) technologies. The agreement is part of Saudi Aramco's efforts to reduce its carbon footprint and align with global climate goals (Saudi Aramco press release, 2025). This strategic partnership highlights the growing importance of CCUS technologies in the oil and gas industry.

    Research Analyst Overview

    • The market encompasses a range of technologies and solutions essential to the exploration and production of oil and natural gas. Key components include fracking fluids for enhanced extraction, underwater robotics for subsea inspections, and gas compression systems for processing and transportation. Formation evaluation tools facilitate reservoir characterization, while energy efficiency and energy storage solutions reduce carbon footprint and enhance operational sustainability. Flow metering and pipeline design optimize production and transportation, with offshore installation expertise critical for accessing deepwater reserves. Offshore wind and renewable energy sources increasingly intersect with the market, necessitating collaboration between traditional and green technology sectors.
    • Environmental impact assessments and completion fluids address regulatory requirements and operational challenges, while gas dehydration and wellbore stability technologies ensure efficient and safe production. Downhole tools and reservoir simulation software enable improved production forecasting, and hydrogen energy and battery technology offer promising alternatives for future energy needs. Solar energy and marine construction solutions contribute to the overall sustainability and expansion of the market. Production forecasting and subsea tree technologies facilitate optimized resource management and extended field life. The industry continues to evolve, with a focus on reducing environmental impact and enhancing energy efficiency.

    Dive into Technavio’s robust research methodology, blending expert interviews, extensive data synthesis, and validated models for unparalleled Oil And Gas Upstream Equipment Market insights. See full methodology.

    Market Scope

    Report Coverage

    Details

    Page number

    229

    Base year

    2024

    Historic period

    2019-2023

    Forecast period

    2025-2029

    Growth momentum & CAGR

    Accelerate at a CAGR of 3.3%

    Market growth 2025-2029

    USD 11.81 billion

    Market structure

    Fragmented

    YoY growth 2024-2025(%)

    3.2

    Key countries

    US, Germany, Canada, China, UK, Brazil, Japan, France, UAE, and India

    Competitive landscape

    Leading Companies, Market Positioning of Companies, Competitive Strategies, and Industry Risks

    Request Free Sample

    What are the Key Data Covered in this Oil And Gas Upstream Equipment Market Research and Growth Report?

    • CAGR of the Oil And Gas Upstream Equipment industry during the forecast period
    • Detailed information on factors that will drive the growth and forecasting between 2025 and 2029
    • Precise estimation of the size of the market and its contribution of the industry in focus to the parent market
    • Accurate predictions about upcoming growth and trends and changes in consumer behaviour
    • Growth of the market across North America, Europe, APAC, South America, and Middle East and Africa
    • Thorough analysis of the market’s competitive landscape and detailed information about companies
    • Comprehensive analysis of factors that will challenge the oil and gas upstream equipment market growth of industry companies

    We can help! Our analysts can customize this oil and gas upstream equipment market research report to meet your requirements.

    Get in touch


    1 Executive Summary

    • 1.1 Market overview
      • Executive Summary - Chart on Market Overview
      • Executive Summary - Data Table on Market Overview
      • Executive Summary - Chart on Global Market Characteristics
      • Executive Summary - Chart on Market by Geography
      • Executive Summary - Chart on Market Segmentation by Application
      • Executive Summary - Chart on Market Segmentation by Deployment
      • Executive Summary - Chart on Market Segmentation by Type
      • Executive Summary - Chart on Incremental Growth
      • Executive Summary - Data Table on Incremental Growth
      • Executive Summary - Chart on Company Market Positioning

    2 Technavio Analysis

    • 2.1 Analysis of price sensitivity, lifecycle, customer purchase basket, adoption rates, and purchase criteria
      • Analysis of price sensitivity, lifecycle, customer purchase basket, adoption rates, and purchase criteria
    • 2.2 Criticality of inputs and Factors of differentiation
      • Overview on criticality of inputs and factors of differentiation
    • 2.3 Factors of disruption
      • Overview on factors of disruption
    • 2.4 Impact of drivers and challenges
      • Impact of drivers and challenges in 2024 and 2029

    3 Market Landscape

    • 3.1 Market ecosystem
      • Parent Market
      • Data Table on - Parent Market
    • 3.2 Market characteristics
      • Market characteristics analysis
    • 3.3 Value chain analysis
      • Value chain analysis

    4 Market Sizing

    • 4.1 Market definition
      • Offerings of companies included in the market definition
    • 4.2 Market segment analysis
      • Market segments
    • 4.3 Market size 2024
      • 4.4 Market outlook: Forecast for 2024-2029
        • Chart on Global - Market size and forecast 2024-2029 ($ million)
        • Data Table on Global - Market size and forecast 2024-2029 ($ million)
        • Chart on Global Market: Year-over-year growth 2024-2029 (%)
        • Data Table on Global Market: Year-over-year growth 2024-2029 (%)

      5 Historic Market Size

      • 5.1 Global Oil And Gas Upstream Equipment Market 2019 - 2023
        • Historic Market Size - Data Table on Global Oil And Gas Upstream Equipment Market 2019 - 2023 ($ million)
      • 5.2 Application segment analysis 2019 - 2023
        • Historic Market Size - Application Segment 2019 - 2023 ($ million)
      • 5.3 Deployment segment analysis 2019 - 2023
        • Historic Market Size - Deployment Segment 2019 - 2023 ($ million)
      • 5.4 Type segment analysis 2019 - 2023
        • Historic Market Size - Type Segment 2019 - 2023 ($ million)
      • 5.5 Geography segment analysis 2019 - 2023
        • Historic Market Size - Geography Segment 2019 - 2023 ($ million)
      • 5.6 Country segment analysis 2019 - 2023
        • Historic Market Size - Country Segment 2019 - 2023 ($ million)

      6 Qualitative Analysis

      • 6.1 AI Impact on Global Oil and Gas Upstream Equipment Market

        7 Five Forces Analysis

        • 7.1 Five forces summary
          • Five forces analysis - Comparison between 2024 and 2029
        • 7.2 Bargaining power of buyers
          • Bargaining power of buyers - Impact of key factors 2024 and 2029
        • 7.3 Bargaining power of suppliers
          • Bargaining power of suppliers - Impact of key factors in 2024 and 2029
        • 7.4 Threat of new entrants
          • Threat of new entrants - Impact of key factors in 2024 and 2029
        • 7.5 Threat of substitutes
          • Threat of substitutes - Impact of key factors in 2024 and 2029
        • 7.6 Threat of rivalry
          • Threat of rivalry - Impact of key factors in 2024 and 2029
        • 7.7 Market condition
          • Chart on Market condition - Five forces 2024 and 2029

        8 Market Segmentation by Application

        • 8.1 Market segments
          • Chart on Application - Market share (2024-2029) (%)
          • Data Table on Application - Market share (2024-2029) (%)
        • 8.2 Comparison by Application
          • Chart on Comparison by Application
          • Data Table on Comparison by Application
        • 8.3 Exploration and drilling - Market size and forecast (2024-2029)
          • Chart on Exploration and drilling - Market size and forecast (2024-2029) ($ million)
          • Data Table on Exploration and drilling - Market size and forecast (2024-2029) ($ million)
          • Chart on Exploration and drilling - Year-over-year growth (2024-2029) (%)
          • Data Table on Exploration and drilling - Year-over-year growth (2024-2029) (%)
        • 8.4 Completion and procedure - Market size and forecast (2024-2029)
          • Chart on Completion and procedure - Market size and forecast (2024-2029) ($ million)
          • Data Table on Completion and procedure - Market size and forecast (2024-2029) ($ million)
          • Chart on Completion and procedure - Year-over-year growth (2024-2029) (%)
          • Data Table on Completion and procedure - Year-over-year growth (2024-2029) (%)
        • 8.5 Others - Market size and forecast (2024-2029)
          • Chart on Others - Market size and forecast (2024-2029) ($ million)
          • Data Table on Others - Market size and forecast (2024-2029) ($ million)
          • Chart on Others - Year-over-year growth (2024-2029) (%)
          • Data Table on Others - Year-over-year growth (2024-2029) (%)
        • 8.6 Market opportunity by Application
          • Market opportunity by Application ($ million)
          • Data Table on Market opportunity by Application ($ million)

        9 Market Segmentation by Deployment

        • 9.1 Market segments
          • Chart on Deployment - Market share (2024-2029) (%)
          • Data Table on Deployment - Market share (2024-2029) (%)
        • 9.2 Comparison by Deployment
          • Chart on Comparison by Deployment
          • Data Table on Comparison by Deployment
        • 9.3 Onshore - Market size and forecast (2024-2029)
          • Chart on Onshore - Market size and forecast (2024-2029) ($ million)
          • Data Table on Onshore - Market size and forecast (2024-2029) ($ million)
          • Chart on Onshore - Year-over-year growth (2024-2029) (%)
          • Data Table on Onshore - Year-over-year growth (2024-2029) (%)
        • 9.4 Offshore - Market size and forecast (2024-2029)
          • Chart on Offshore - Market size and forecast (2024-2029) ($ million)
          • Data Table on Offshore - Market size and forecast (2024-2029) ($ million)
          • Chart on Offshore - Year-over-year growth (2024-2029) (%)
          • Data Table on Offshore - Year-over-year growth (2024-2029) (%)
        • 9.5 Market opportunity by Deployment
          • Market opportunity by Deployment ($ million)
          • Data Table on Market opportunity by Deployment ($ million)

        10 Market Segmentation by Type

        • 10.1 Market segments
          • Chart on Type - Market share (2024-2029) (%)
          • Data Table on Type - Market share (2024-2029) (%)
        • 10.2 Comparison by Type
          • Chart on Comparison by Type
          • Data Table on Comparison by Type
        • 10.3 Drilling equipment - Market size and forecast (2024-2029)
          • Chart on Drilling equipment - Market size and forecast (2024-2029) ($ million)
          • Data Table on Drilling equipment - Market size and forecast (2024-2029) ($ million)
          • Chart on Drilling equipment - Year-over-year growth (2024-2029) (%)
          • Data Table on Drilling equipment - Year-over-year growth (2024-2029) (%)
        • 10.4 Production equipment - Market size and forecast (2024-2029)
          • Chart on Production equipment - Market size and forecast (2024-2029) ($ million)
          • Data Table on Production equipment - Market size and forecast (2024-2029) ($ million)
          • Chart on Production equipment - Year-over-year growth (2024-2029) (%)
          • Data Table on Production equipment - Year-over-year growth (2024-2029) (%)
        • 10.5 Well intervention equipment - Market size and forecast (2024-2029)
          • Chart on Well intervention equipment - Market size and forecast (2024-2029) ($ million)
          • Data Table on Well intervention equipment - Market size and forecast (2024-2029) ($ million)
          • Chart on Well intervention equipment - Year-over-year growth (2024-2029) (%)
          • Data Table on Well intervention equipment - Year-over-year growth (2024-2029) (%)
        • 10.6 Pressure control equipment - Market size and forecast (2024-2029)
          • Chart on Pressure control equipment - Market size and forecast (2024-2029) ($ million)
          • Data Table on Pressure control equipment - Market size and forecast (2024-2029) ($ million)
          • Chart on Pressure control equipment - Year-over-year growth (2024-2029) (%)
          • Data Table on Pressure control equipment - Year-over-year growth (2024-2029) (%)
        • 10.7 Others - Market size and forecast (2024-2029)
          • Chart on Others - Market size and forecast (2024-2029) ($ million)
          • Data Table on Others - Market size and forecast (2024-2029) ($ million)
          • Chart on Others - Year-over-year growth (2024-2029) (%)
          • Data Table on Others - Year-over-year growth (2024-2029) (%)
        • 10.8 Market opportunity by Type
          • Market opportunity by Type ($ million)
          • Data Table on Market opportunity by Type ($ million)

        11 Market Segmentation by Component

        • 11.1 Market segments
          • Chart on Component - Market share (2024-2029) (%)
          • Data Table on Component - Market share (2024-2029) (%)
        • 11.2 Comparison by Component
          • Chart on Comparison by Component
          • Data Table on Comparison by Component
        • 11.3 Surface Equipment - Market size and forecast (2024-2029)
          • Chart on Surface Equipment - Market size and forecast (2024-2029) ($ million)
          • Data Table on Surface Equipment - Market size and forecast (2024-2029) ($ million)
          • Chart on Surface Equipment - Year-over-year growth (2024-2029) (%)
          • Data Table on Surface Equipment - Year-over-year growth (2024-2029) (%)
        • 11.4 Subsurface Equipment - Market size and forecast (2024-2029)
          • Chart on Subsurface Equipment - Market size and forecast (2024-2029) ($ million)
          • Data Table on Subsurface Equipment - Market size and forecast (2024-2029) ($ million)
          • Chart on Subsurface Equipment - Year-over-year growth (2024-2029) (%)
          • Data Table on Subsurface Equipment - Year-over-year growth (2024-2029) (%)
        • 11.5 Drilling Tools - Market size and forecast (2024-2029)
          • Chart on Drilling Tools - Market size and forecast (2024-2029) ($ million)
          • Data Table on Drilling Tools - Market size and forecast (2024-2029) ($ million)
          • Chart on Drilling Tools - Year-over-year growth (2024-2029) (%)
          • Data Table on Drilling Tools - Year-over-year growth (2024-2029) (%)
        • 11.6 Pumps and Valves - Market size and forecast (2024-2029)
          • Chart on Pumps and Valves - Market size and forecast (2024-2029) ($ million)
          • Data Table on Pumps and Valves - Market size and forecast (2024-2029) ($ million)
          • Chart on Pumps and Valves - Year-over-year growth (2024-2029) (%)
          • Data Table on Pumps and Valves - Year-over-year growth (2024-2029) (%)
        • 11.7 Others - Market size and forecast (2024-2029)
          • Chart on Others - Market size and forecast (2024-2029) ($ million)
          • Data Table on Others - Market size and forecast (2024-2029) ($ million)
          • Chart on Others - Year-over-year growth (2024-2029) (%)
          • Data Table on Others - Year-over-year growth (2024-2029) (%)
        • 11.8 Market opportunity by Component
          • Market opportunity by Component ($ million)
          • Data Table on Market opportunity by Component ($ million)

        12 Customer Landscape

        • 12.1 Customer landscape overview
          • Analysis of price sensitivity, lifecycle, customer purchase basket, adoption rates, and purchase criteria

        13 Geographic Landscape

        • 13.1 Geographic segmentation
          • Chart on Market share by geography 2024-2029 (%)
          • Data Table on Market share by geography 2024-2029 (%)
        • 13.2 Geographic comparison
          • Chart on Geographic comparison
          • Data Table on Geographic comparison
        • 13.3 North America - Market size and forecast 2024-2029
          • Chart on North America - Market size and forecast 2024-2029 ($ million)
          • Data Table on North America - Market size and forecast 2024-2029 ($ million)
          • Chart on North America - Year-over-year growth 2024-2029 (%)
          • Data Table on North America - Year-over-year growth 2024-2029 (%)
        • 13.4 Europe - Market size and forecast 2024-2029
          • Chart on Europe - Market size and forecast 2024-2029 ($ million)
          • Data Table on Europe - Market size and forecast 2024-2029 ($ million)
          • Chart on Europe - Year-over-year growth 2024-2029 (%)
          • Data Table on Europe - Year-over-year growth 2024-2029 (%)
        • 13.5 APAC - Market size and forecast 2024-2029
          • Chart on APAC - Market size and forecast 2024-2029 ($ million)
          • Data Table on APAC - Market size and forecast 2024-2029 ($ million)
          • Chart on APAC - Year-over-year growth 2024-2029 (%)
          • Data Table on APAC - Year-over-year growth 2024-2029 (%)
        • 13.6 South America - Market size and forecast 2024-2029
          • Chart on South America - Market size and forecast 2024-2029 ($ million)
          • Data Table on South America - Market size and forecast 2024-2029 ($ million)
          • Chart on South America - Year-over-year growth 2024-2029 (%)
          • Data Table on South America - Year-over-year growth 2024-2029 (%)
        • 13.7 Middle East and Africa - Market size and forecast 2024-2029
          • Chart on Middle East and Africa - Market size and forecast 2024-2029 ($ million)
          • Data Table on Middle East and Africa - Market size and forecast 2024-2029 ($ million)
          • Chart on Middle East and Africa - Year-over-year growth 2024-2029 (%)
          • Data Table on Middle East and Africa - Year-over-year growth 2024-2029 (%)
        • 13.8 US - Market size and forecast 2024-2029
          • Chart on US - Market size and forecast 2024-2029 ($ million)
          • Data Table on US - Market size and forecast 2024-2029 ($ million)
          • Chart on US - Year-over-year growth 2024-2029 (%)
          • Data Table on US - Year-over-year growth 2024-2029 (%)
        • 13.9 Germany - Market size and forecast 2024-2029
          • Chart on Germany - Market size and forecast 2024-2029 ($ million)
          • Data Table on Germany - Market size and forecast 2024-2029 ($ million)
          • Chart on Germany - Year-over-year growth 2024-2029 (%)
          • Data Table on Germany - Year-over-year growth 2024-2029 (%)
        • 13.10 Canada - Market size and forecast 2024-2029
          • Chart on Canada - Market size and forecast 2024-2029 ($ million)
          • Data Table on Canada - Market size and forecast 2024-2029 ($ million)
          • Chart on Canada - Year-over-year growth 2024-2029 (%)
          • Data Table on Canada - Year-over-year growth 2024-2029 (%)
        • 13.11 China - Market size and forecast 2024-2029
          • Chart on China - Market size and forecast 2024-2029 ($ million)
          • Data Table on China - Market size and forecast 2024-2029 ($ million)
          • Chart on China - Year-over-year growth 2024-2029 (%)
          • Data Table on China - Year-over-year growth 2024-2029 (%)
        • 13.12 UK - Market size and forecast 2024-2029
          • Chart on UK - Market size and forecast 2024-2029 ($ million)
          • Data Table on UK - Market size and forecast 2024-2029 ($ million)
          • Chart on UK - Year-over-year growth 2024-2029 (%)
          • Data Table on UK - Year-over-year growth 2024-2029 (%)
        • 13.13 Brazil - Market size and forecast 2024-2029
          • Chart on Brazil - Market size and forecast 2024-2029 ($ million)
          • Data Table on Brazil - Market size and forecast 2024-2029 ($ million)
          • Chart on Brazil - Year-over-year growth 2024-2029 (%)
          • Data Table on Brazil - Year-over-year growth 2024-2029 (%)
        • 13.14 Japan - Market size and forecast 2024-2029
          • Chart on Japan - Market size and forecast 2024-2029 ($ million)
          • Data Table on Japan - Market size and forecast 2024-2029 ($ million)
          • Chart on Japan - Year-over-year growth 2024-2029 (%)
          • Data Table on Japan - Year-over-year growth 2024-2029 (%)
        • 13.15 France - Market size and forecast 2024-2029
          • Chart on France - Market size and forecast 2024-2029 ($ million)
          • Data Table on France - Market size and forecast 2024-2029 ($ million)
          • Chart on France - Year-over-year growth 2024-2029 (%)
          • Data Table on France - Year-over-year growth 2024-2029 (%)
        • 13.16 UAE - Market size and forecast 2024-2029
          • Chart on UAE - Market size and forecast 2024-2029 ($ million)
          • Data Table on UAE - Market size and forecast 2024-2029 ($ million)
          • Chart on UAE - Year-over-year growth 2024-2029 (%)
          • Data Table on UAE - Year-over-year growth 2024-2029 (%)
        • 13.17 India - Market size and forecast 2024-2029
          • Chart on India - Market size and forecast 2024-2029 ($ million)
          • Data Table on India - Market size and forecast 2024-2029 ($ million)
          • Chart on India - Year-over-year growth 2024-2029 (%)
          • Data Table on India - Year-over-year growth 2024-2029 (%)
        • 13.18 Market opportunity by geography
          • Market opportunity by geography ($ million)
          • Data Tables on Market opportunity by geography ($ million)
        • 13.19 Rest of World (ROW) - Market size and forecast (2024-2029)
          • Chart on Rest of World (ROW) - Market size and forecast (2024-2029) ($ million)
          • Data Table on Rest of World (ROW) - Market size and forecast (2024-2029) ($ million)
          • Chart on Rest of World (ROW) - Year-over-year growth (2024-2029) (%)
          • Data Table on Rest of World (ROW) - Year-over-year growth (2024-2029) (%)

        14 Drivers, Challenges, and Opportunity/Restraints

        • 14.1 Market drivers
          • 14.2 Market challenges
            • 14.3 Impact of drivers and challenges
              • Impact of drivers and challenges in 2024 and 2029
            • 14.4 Market opportunities/restraints

              15 Competitive Landscape

              • 15.1 Overview
                • 15.2 Competitive Landscape
                  • Overview on criticality of inputs and factors of differentiation
                • 15.3 Landscape disruption
                  • Overview on factors of disruption
                • 15.4 Industry risks
                  • Impact of key risks on business

                16 Competitive Analysis

                • 16.1 Companies profiled
                  • Companies covered
                • 16.2 Company ranking index
                  • Company ranking index
                • 16.3 Market positioning of companies
                  • Matrix on companies position and classification
                • 16.4 Aker Solutions ASA
                  • Aker Solutions ASA - Overview
                  • Aker Solutions ASA - Business segments
                  • Aker Solutions ASA - Key news
                  • Aker Solutions ASA - Key offerings
                  • Aker Solutions ASA - Segment focus
                  • SWOT
                • 16.5 Archer Ltd.
                  • Archer Ltd. - Overview
                  • Archer Ltd. - Business segments
                  • Archer Ltd. - Key offerings
                  • Archer Ltd. - Segment focus
                  • SWOT
                • 16.6 Atlas Copco AB
                  • Atlas Copco AB - Overview
                  • Atlas Copco AB - Business segments
                  • Atlas Copco AB - Key news
                  • Atlas Copco AB - Key offerings
                  • Atlas Copco AB - Segment focus
                  • SWOT
                • 16.7 AXON Pressure Products Inc.
                  • AXON Pressure Products Inc. - Overview
                  • AXON Pressure Products Inc. - Product / Service
                  • AXON Pressure Products Inc. - Key offerings
                  • SWOT
                • 16.8 Dril Quip Inc.
                  • Dril Quip Inc. - Overview
                  • Dril Quip Inc. - Business segments
                  • Dril Quip Inc. - Key news
                  • Dril Quip Inc. - Key offerings
                  • Dril Quip Inc. - Segment focus
                  • SWOT
                • 16.9 Evolution Oil Tools Inc.
                  • Evolution Oil Tools Inc. - Overview
                  • Evolution Oil Tools Inc. - Product / Service
                  • Evolution Oil Tools Inc. - Key offerings
                  • SWOT
                • 16.10 Flowserve Corp.
                  • Flowserve Corp. - Overview
                  • Flowserve Corp. - Business segments
                  • Flowserve Corp. - Key offerings
                  • Flowserve Corp. - Segment focus
                  • SWOT
                • 16.11 Forum Energy Technologies Inc.
                  • Forum Energy Technologies Inc. - Overview
                  • Forum Energy Technologies Inc. - Business segments
                  • Forum Energy Technologies Inc. - Key news
                  • Forum Energy Technologies Inc. - Key offerings
                  • Forum Energy Technologies Inc. - Segment focus
                  • SWOT
                • 16.12 General Electric Co.
                  • General Electric Co. - Overview
                  • General Electric Co. - Business segments
                  • General Electric Co. - Key news
                  • General Electric Co. - Key offerings
                  • General Electric Co. - Segment focus
                  • SWOT
                • 16.13 Halliburton Co.
                  • Halliburton Co. - Overview
                  • Halliburton Co. - Business segments
                  • Halliburton Co. - Key news
                  • Halliburton Co. - Key offerings
                  • Halliburton Co. - Segment focus
                  • SWOT
                • 16.14 NOV Inc.
                  • NOV Inc. - Overview
                  • NOV Inc. - Business segments
                  • NOV Inc. - Key news
                  • NOV Inc. - Key offerings
                  • NOV Inc. - Segment focus
                  • SWOT
                • 16.15 Schlumberger Ltd.
                  • Schlumberger Ltd. - Overview
                  • Schlumberger Ltd. - Business segments
                  • Schlumberger Ltd. - Key news
                  • Schlumberger Ltd. - Key offerings
                  • Schlumberger Ltd. - Segment focus
                  • SWOT
                • 16.16 Siemens AG
                  • Siemens AG - Overview
                  • Siemens AG - Business segments
                  • Siemens AG - Key news
                  • Siemens AG - Key offerings
                  • Siemens AG - Segment focus
                  • SWOT
                • 16.17 SPX FLOW Inc.
                  • SPX FLOW Inc. - Overview
                  • SPX FLOW Inc. - Product / Service
                  • SPX FLOW Inc. - Key news
                  • SPX FLOW Inc. - Key offerings
                  • SWOT
                • 16.18 Weatherford International Plc
                  • Weatherford International Plc - Overview
                  • Weatherford International Plc - Business segments
                  • Weatherford International Plc - Key news
                  • Weatherford International Plc - Key offerings
                  • Weatherford International Plc - Segment focus
                  • SWOT

                17 Appendix

                • 17.1 Scope of the report
                  • 17.2 Inclusions and exclusions checklist
                    • Inclusions checklist
                    • Exclusions checklist
                  • 17.3 Currency conversion rates for US$
                    • Currency conversion rates for US$
                  • 17.4 Research methodology
                    • Research methodology
                  • 17.5 Data procurement
                    • Information sources
                  • 17.6 Data validation
                    • Data validation
                  • 17.7 Validation techniques employed for market sizing
                    • Validation techniques employed for market sizing
                  • 17.8 Data synthesis
                    • Data synthesis
                  • 17.9 360 degree market analysis
                    • 360 degree market analysis
                  • 17.10 List of abbreviations
                    • List of abbreviations

                  Research Methodology

                  Technavio presents a detailed picture of the market by way of study, synthesis, and summation of data from multiple sources. The analysts have presented the various facets of the market with a particular focus on identifying the key industry influencers. The data thus presented is comprehensive, reliable, and the result of extensive research, both primary and secondary.

                  INFORMATION SOURCES

                  Primary sources

                  • Manufacturers and suppliers
                  • Channel partners
                  • Industry experts
                  • Strategic decision makers

                  Secondary sources

                  • Industry journals and periodicals
                  • Government data
                  • Financial reports of key industry players
                  • Historical data
                  • Press releases

                  DATA ANALYSIS

                  Data Synthesis

                  • Collation of data
                  • Estimation of key figures
                  • Analysis of derived insights

                  Data Validation

                  • Triangulation with data models
                  • Reference against proprietary databases
                  • Corroboration with industry experts

                  REPORT WRITING

                  Qualitative

                  • Market drivers
                  • Market challenges
                  • Market trends
                  • Five forces analysis

                  Quantitative

                  • Market size and forecast
                  • Market segmentation
                  • Geographical insights
                  • Competitive landscape

                  Interested in this report?

                  Get your sample now to see our research methodology and insights!

                  Download Now

                  Frequently Asked Questions

                  Oil And Gas Upstream Equipment market growth will increase by $ 11.81 bn during 2025-2029.

                  The Oil And Gas Upstream Equipment market is expected to grow at a CAGR of 3.3% during 2025-2029.

                  Oil And Gas Upstream Equipment market is segmented by Application( Exploration and drilling, Completion and procedure, Others, Beverages) Deployment( Onshore, Offshore, APAC, South America, Middle East and Africa) Type( Drilling equipment, Production equipment, Well intervention equipment, Pressure control equipment, Others)

                  Aker Solutions ASA, Archer Ltd., ATB Holding Spa, Atlas Copco AB, AXON Pressure Products Inc., Dril Quip Inc., Evolution Oil Tools Inc., Flowserve Corp., Forum Energy Technologies Inc., General Electric Co., Geometrics Inc., Halliburton Co., Helmerich and Payne Inc., NOV Inc., Schlumberger Ltd., Seadrill Ltd., Siemens AG, SPX FLOW Inc., Sumitomo Corp., Weatherford International Plc are a few of the key vendors in the Oil And Gas Upstream Equipment market.

                  North America will register the highest growth rate of 36% among the other regions. Therefore, the Oil And Gas Upstream Equipment market in North America is expected to garner significant business opportunities for the vendors during the forecast period.

                  US, Germany, Canada, China, UK, Brazil, Japan, France, UAE, India, Rest of World (ROW)

                  • Increasing preference for pipeline transportationThe transportation of oil and gas is usually referred to as midstream. Transport modes in the oil and gas upstream equipment market include transportation through pipelines is the driving factor this market.
                  • shipping is the driving factor this market.
                  • trucking is the driving factor this market.
                  • and railroading. Oil and gas are often produced at remote locations is the driving factor this market.
                  • from where they are transported to refineries is the driving factor this market.
                  • after which they are processed into refined products and transported to end-users. Oil and gas projects are long-term projects is the driving factor this market.
                  • having an average life cycle of 20-30 years. Pipelines are preferred for long-distance oil and gas transport over other modes due to the following features: Pipelines have a very low energy consumption and is the driving factor this market.
                  • therefore is the driving factor this market.
                  • lower carbon footprint. They are highly reliable and can operate round the clock because their dependence on external factors is limited. Pipelines can be laid through any terrain and underseas. Pipelines need very little maintenance. Hence is the driving factor this market.
                  • they are economical. Pipelines are safe and environmentally friendly. Pipelines are capable of continuous transportation of a large quantity of products. Oil and gas transportation via pipelines costs much less is the driving factor this market.
                  • an average of $3 per bbl is the driving factor this market.
                  • whereas rail transport typically costs $6-$15 per bbl. As oil resources are depleting is the driving factor this market.
                  • companies are venturing into new projects. These offshore projects generally take place inside deep seas. Transporting oil through ships is expensive and requires frequent trips. However is the driving factor this market.
                  • with pipelines is the driving factor this market.
                  • the transportation of oil and gas can run continuously and can be ramped up or shut down at any time. Pipelines have been the preferred mode of transporting oil and gas. Increasing global consumption of oil and gas will drive the global oil and gas upstream equipment market in the forecast period. is the driving factor this market.

                  The Oil And Gas Upstream Equipment market vendors should focus on grabbing business opportunities from the Exploration and drilling segment as it accounted for the largest market share in the base year.