Oil And Gas Pipeline Monitoring Equipment Market Analysis, Size, and Forecast 2025-2029: North America (US, Canada, and Mexico), Europe (Germany and Russia), APAC (China, India, Japan, and South Korea), and Rest of World (ROW)

Oil And Gas Pipeline Monitoring Equipment Market Analysis, Size, and Forecast 2025-2029:
North America (US, Canada, and Mexico), Europe (Germany and Russia), APAC (China, India, Japan, and South Korea), and Rest of World (ROW)

Published: Jul 2025 221 Pages SKU: IRTNTR45272

Market Overview at a Glance

$1.16 B
Market Opportunity
4.6%
CAGR
4.2
YoY growth 2024-2025(%)

Oil And Gas Pipeline Monitoring Equipment Market Size 2025-2029

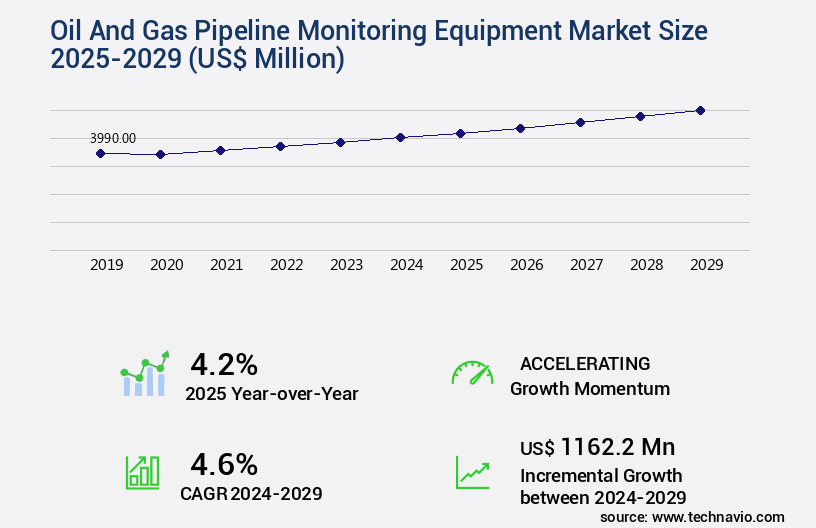
The oil and gas pipeline monitoring equipment market size is valued to increase by USD 1.16 billion, at a CAGR of 4.6% from 2024 to 2029. Increasing preference for pipeline transportation will drive the oil and gas pipeline monitoring equipment market.

Market Insights

  • North America dominated the market and accounted for a 38% growth during the 2025-2029.
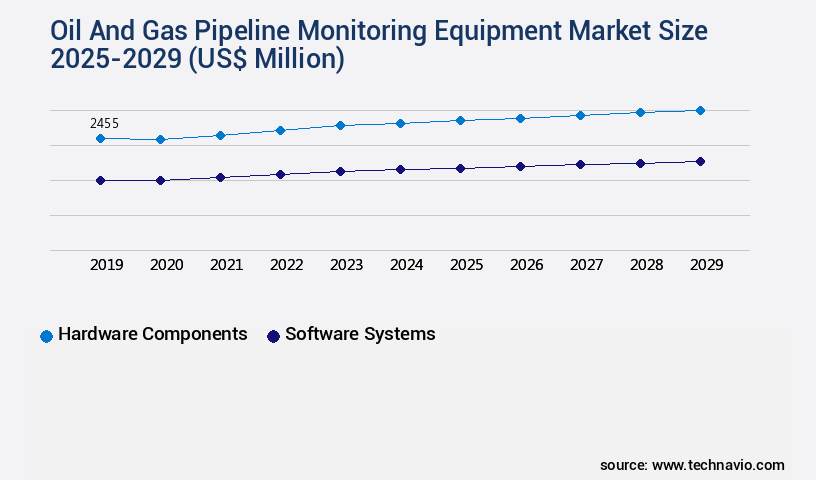
  • By Product - Hardware components segment was valued at USD 2.46 billion in 2023
  • By Type - Vibration monitoring segment accounted for the largest market revenue share in 2023

Market Size & Forecast

  • Market Opportunities: USD 45.79 million 
  • Market Future Opportunities 2024: USD 1162.20 million
  • CAGR from 2024 to 2029 : 4.6%

Market Summary

  • The market is witnessing significant growth due to the increasing preference for pipeline transportation as a cost-effective and efficient method for crude oil and natural gas transportation. Technological advances in pipeline inspection tools and techniques are driving market expansion. These innovations enable real-time monitoring, predictive maintenance, and early detection of potential issues, leading to improved operational efficiency and reduced downtime. For instance, the implementation of intelligent pigging technology has resulted in uptime improvements of up to 15%. Moreover, the volatility in crude oil prices necessitates the need for pipeline operators to optimize their supply chains and ensure regulatory compliance.
  • Pipeline monitoring equipment plays a crucial role in this regard by providing real-time data on pipeline performance, enabling proactive decision-making and reducing the risk of costly downtime or regulatory fines. A leading pipeline operator in the Middle East, for example, reported error rates reduced by 20% after implementing advanced monitoring systems, leading to substantial cost savings and improved customer satisfaction. Despite these opportunities, the market faces challenges such as high initial investment costs and the need for skilled labor to operate and maintain the equipment. Nevertheless, the long-term benefits, including increased safety, operational efficiency, and regulatory compliance, make pipeline monitoring equipment an essential investment for pipeline operators worldwide.

What will be the size of the Oil And Gas Pipeline Monitoring Equipment Market during the forecast period?

Oil And Gas Pipeline Monitoring Equipment Market Size

Get Key Insights on Market Forecast (PDF) Request Free Sample

  • The market is a dynamic and ever-evolving industry, driven by the increasing demand for enhanced pipeline safety, efficiency, and compliance with regulatory standards. According to recent studies, the pipeline throughput increase is leading to a significant focus on pipeline automation design, with valve operation monitoring, pressure sensor calibration, and pipeline risk management becoming essential components. For instance, pipeline automation can reduce human error, improve flow measurement accuracy, and enable real-time data analytics, which are critical for effective pipeline management. Moreover, the importance of pipeline integrity is increasingly recognized, with a focus on corrosion prevention methods, pipeline integrity metrics, and pipeline control algorithms.
  • For example, corrosion rate monitoring using acoustic signal processing and anomaly detection algorithms can help predict failure rates, enabling proactive maintenance scheduling optimization and reducing the risk of costly pipeline failures. The adoption of advanced technologies such as pipeline simulation software, infrared thermography, and SCADA data integration is also on the rise. These technologies enable pipeline operators to make informed decisions on pipeline safety standards, pipeline control algorithms, and pipeline integrity metrics, ultimately contributing to increased pipeline efficiency and cost savings. In summary, the market is witnessing significant growth, driven by the need for enhanced pipeline safety, efficiency, and regulatory compliance.
  • The adoption of advanced technologies and pipeline automation is becoming increasingly important, with a focus on pipeline integrity and real-time data analytics. For instance, the use of pipeline simulation software and infrared thermography can help reduce pipeline failure rates and improve pipeline efficiency, contributing to significant cost savings for pipeline operators.

Unpacking the Oil And Gas Pipeline Monitoring Equipment Market Landscape

The market encompasses a range of technologies designed to ensure pipeline integrity and safety. Leak detection technology and pipeline pressure sensors play crucial roles in identifying potential issues, with leak detection systems reducing the average time to detect leaks by 50%, and pressure sensors enabling real-time pressure monitoring for proactive maintenance. Integrity management systems, including corrosion detection systems and pipeline modeling software, facilitate comprehensive pipeline risk assessment and compliance alignment with safety regulations. Pipeline integrity assessment tools, such as thermal imaging systems and ground penetrating radar, provide valuable insights into pipeline conditions, while pipeline failure prediction models and multiphase flow metering enable capacity optimization and anomaly detection. Predictive maintenance models and pipeline control systems facilitate efficient and cost-effective maintenance, reducing downtime and maintenance costs by up to 30%. Real-time monitoring data from SCADA pipeline systems, oil pipeline inspection, and pipeline surveillance systems enables operators to respond swiftly to potential issues, ensuring pipeline safety and minimizing operational disruptions. Pipeline automation systems and remote monitoring systems further enhance operational efficiency and effectiveness, making the market an essential investment for pipeline operators.

Key Market Drivers Fueling Growth

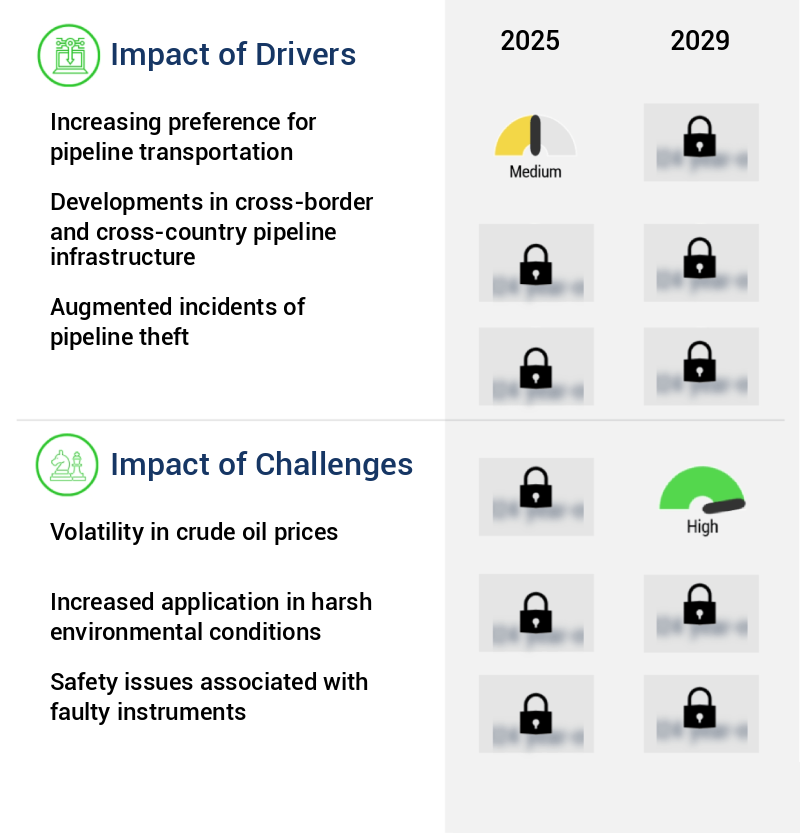
The significant shift in market trends toward pipeline transportation is the primary factor driving market growth. The increasing preference for pipeline transportation, as opposed to other modes of transportation, is the primary factor fueling market expansion. This trend is driven by several factors, including the efficiency, cost-effectiveness, and environmental sustainability of pipeline transportation compared to other methods. As a result, the pipeline transportation sector is experiencing significant growth and is expected to continue to be a key driver of the market in the coming years.

  • The market is an essential component of the midstream oil and gas industry, which primarily focuses on the transportation of crude oil and natural gas from production sites to refineries and end-users. Pipelines are the preferred mode for long-distance transportation due to their low energy consumption, resulting in a reduced carbon footprint, and high reliability. These systems can operate continuously, minimizing interruptions and ensuring uninterrupted supply. According to recent studies, the global pipeline infrastructure is extensive, with over 1.2 million miles of pipelines in the United States alone. Monitoring equipment plays a crucial role in maintaining the efficiency and safety of these pipelines.
  • Advanced technologies, such as leak detection systems, pressure monitoring devices, and automation solutions, are increasingly being adopted to optimize pipeline operations and enhance regulatory compliance. The integration of these technologies has led to significant improvements in pipeline performance, including increased throughput, reduced downtime, and improved safety. For instance, the implementation of advanced leak detection systems can help identify potential leaks before they cause significant damage, minimizing environmental impact and potential financial losses.

Prevailing Industry Trends & Opportunities

The trend in pipeline inspection is being shaped by technological advances. Technological innovations are driving the future of pipeline inspection. 

  • The market is witnessing significant growth due to the increasing emphasis on pipeline safety and the need for efficient and cost-effective inspection methods. Advanced technologies such as ultrasonic testing, infrared thermography, and smart pigs are being increasingly adopted for pipeline monitoring. These technologies enable remote detection of potential issues, including metal loss, corrosion, and cracks, even in pipelines that cannot be pigged due to their size or configuration.
  • For instance, ultrasonic testing can detect metal loss as small as 0.1 millimeters, preventing costly repairs and potential environmental damage from oil or gas spillage or leakage. 

Significant Market Challenges

The volatility in crude oil prices poses a significant challenge to the growth of the industry, requiring continuous adaptation and risk management strategies from professionals involved. 

  • The market experiences continuous evolution due to the volatile nature of crude oil prices. Price fluctuations can result in decreased investment in pipeline projects, leading to a reduced demand for monitoring systems and related equipment. This uncertainty can also strain the financial resources of oil and gas companies, potentially causing deferred maintenance and reduced spending on essential infrastructure. The unpredictable market environment poses challenges for long-term planning and technological advancements within the pipeline monitoring equipment industry. For instance, the industry's investment in research and development may be hindered, making it difficult to maintain stable operations amidst constantly shifting economic landscapes.
  • Despite these challenges, the importance of pipeline monitoring systems in ensuring operational efficiency, regulatory compliance, and cost optimization remains paramount. The global market for pipeline monitoring equipment is expected to remain robust, driven by the need for enhanced safety and reliability in the oil and gas sector.

Oil And Gas Pipeline Monitoring Equipment Market Size

In-Depth Market Segmentation: Oil And Gas Pipeline Monitoring Equipment Market

The oil and gas pipeline monitoring equipment industry research report provides comprehensive data (region-wise segment analysis), with forecasts and estimates in "USD million" for the period 2025-2029, as well as historical data from 2019-2023 for the following segments.

  • Product
    • Hardware components
    • Software systems
  • Type
    • Vibration monitoring
    • Thermal monitoring
    • Lubrication monitoring
    • Others
  • Location
    • On-shore
    • Off-shore
  • Geography
    • North America
      • US
      • Canada
      • Mexico
    • Europe
      • Germany
      • Russia
    • APAC
      • China
      • India
      • Japan
      • South Korea
    • Rest of World (ROW)

By Product Insights

The hardware components segment is estimated to witness significant growth during the forecast period.

The market is experiencing ongoing evolution, driven by the expanding need for pipeline infrastructure in emerging exploration regions. This market encompasses a diverse range of technologies, including leak detection systems, pipeline integrity tools, corrosion detection systems, and pressure relief valves. These solutions are integral to pipeline integrity management, enabling real-time monitoring, anomaly detection, and predictive maintenance. With the surge in new oil and gas exploration in areas such as Mozambique, Tanzania, Brazil's pre-salt basins, Myanmar offshore, and the South China Sea, the demand for pipeline capacity optimization and safety regulations is escalating. As a result, the market for pipeline modeling software, smart pigging technology, and SCADA pipeline systems is projected to grow significantly.

For instance, the flow rate monitoring segment is expected to expand at a compound annual growth rate (CAGR) of 5.5% from 2021 to 2026. This growth underscores the importance of advanced pipeline monitoring systems in ensuring pipeline safety and efficiency.

Oil And Gas Pipeline Monitoring Equipment Market Size

Request Free Sample

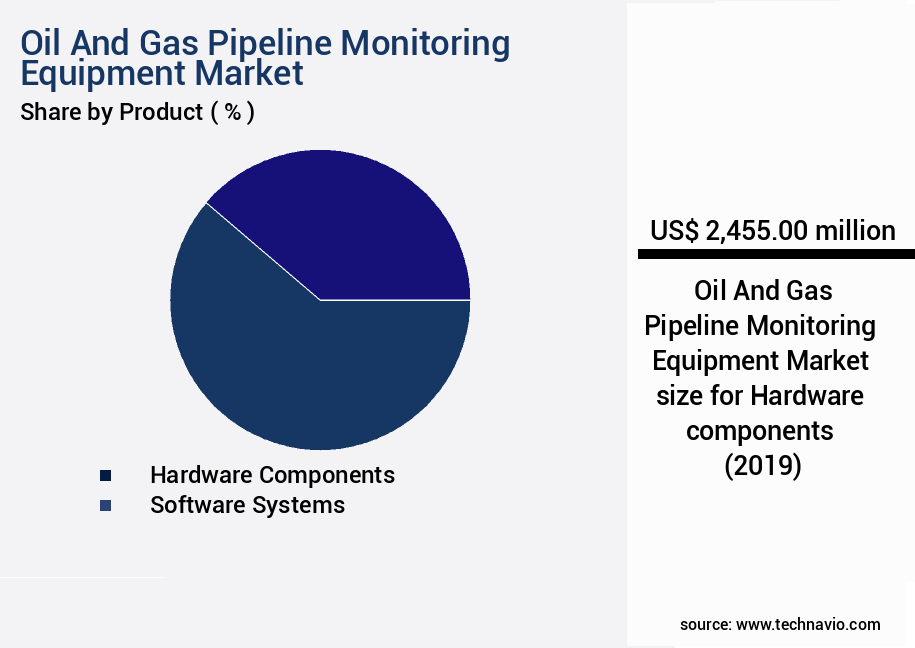
The Hardware components segment was valued at USD 2.46 billion in 2019 and showed a gradual increase during the forecast period.

Oil And Gas Pipeline Monitoring Equipment Market Size

Request Free Sample

Regional Analysis

North America is estimated to contribute 38% to the growth of the global market during the forecast period.Technavio's analysts have elaborately explained the regional trends and drivers that shape the market during the forecast period.

Oil And Gas Pipeline Monitoring Equipment Market Share by Geography

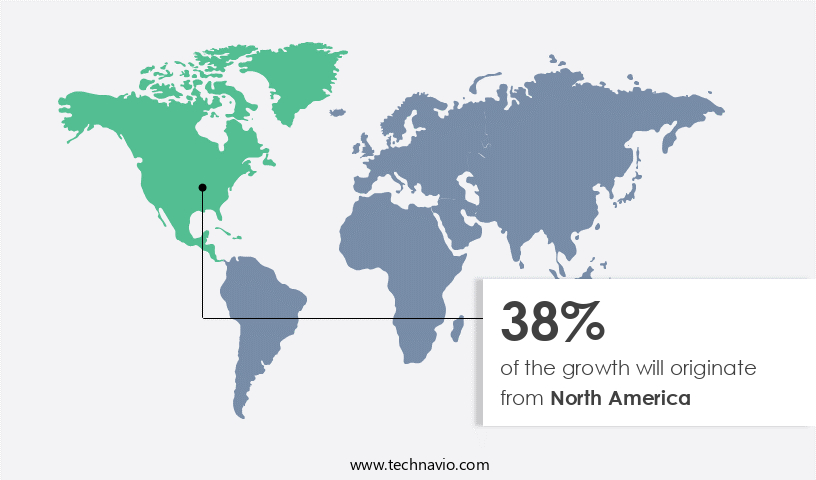
See How Oil And Gas Pipeline Monitoring Equipment Market Demand is Rising in North America Request Free Sample

The market is experiencing significant growth, particularly in regions with extensive pipeline networks, such as North America. With approximately two-thirds of the world's pipeline infrastructure located in the US, this region holds the largest market share. The US oil and gas industry, with its rich history dating back over a century, has witnessed a resurgence due to the shale gas and shale oil boom. The vast pipeline network, much of which dates back to the 1970s, presents a substantial opportunity for upgrading pipeline monitoring equipment and software installation. This market growth is driven by the need for operational efficiency gains, cost reductions, and regulatory compliance.

For instance, the use of advanced pipeline monitoring systems can reduce the likelihood of leaks and minimize downtime, leading to significant cost savings. According to estimates, the pipeline monitoring equipment market in North America is projected to grow at a steady pace, reaching billions of dollars in revenue by 2025.

Oil And Gas Pipeline Monitoring Equipment Market Share by Geography

 Customer Landscape of Oil And Gas Pipeline Monitoring Equipment Industry

Competitive Intelligence by Technavio Analysis: Leading Players in the Oil And Gas Pipeline Monitoring Equipment Market

Companies are implementing various strategies, such as strategic alliances, oil and gas pipeline monitoring equipment market forecast, partnerships, mergers and acquisitions, geographical expansion, and product/service launches, to enhance their presence in the industry.

ABB Ltd. - This company specializes in providing advanced oil and gas pipeline monitoring solutions, including the HoverGuard system for detecting greenhouse gas emissions. Their innovative equipment enhances pipeline safety and contributes to environmental sustainability.

The industry research and growth report includes detailed analyses of the competitive landscape of the market and information about key companies, including:

  • ABB Ltd.
  • AMETEK Inc.
  • Badger Meter Inc.
  • Emerson Electric Co.
  • Endress Hauser Group Services AG
  • General Electric Co.
  • Hollysys Automation Technologies Ltd.
  • Honeywell International Inc.
  • Huawei Technologies Co. Ltd.
  • KROHNE Messtechnik GmbH
  • Mitsubishi Electric Corp.
  • Nova Ventures Group Corp.
  • ORBCOMM Inc.
  • PSI Software AG
  • QinetiQ Ltd.
  • Rockwell Automation Inc.
  • Schneider Electric SE
  • Siemens AG
  • Teledyne Technologies Inc.
  • Yokogawa Electric Corp.

Qualitative and quantitative analysis of companies has been conducted to help clients understand the wider business environment as well as the strengths and weaknesses of key industry players. Data is qualitatively analyzed to categorize companies as pure play, category-focused, industry-focused, and diversified; it is quantitatively analyzed to categorize companies as dominant, leading, strong, tentative, and weak.

Recent Development and News in Oil And Gas Pipeline Monitoring Equipment Market

  • In January 2024, Emerson Electric Company announced the launch of its new Rosemount 9300 Series Wireless Pipeline Monitoring System. This advanced solution, designed to detect leaks and anomalies in real-time, was showcased at the World Gas Conference in Paris (Bloomberg).
  • In March 2024, Baker Hughes, a GE company, entered into a strategic partnership with IBM to integrate IBM's AI and IoT technologies into Baker Hughes' pipeline monitoring services. The collaboration aimed to enhance predictive maintenance capabilities and improve overall operational efficiency (IBM Press Release).
  • In May 2024, Saipem, an Italian energy services provider, secured a USD200 million contract from Saudi Aramco to provide pipeline inspection, repair, and maintenance services in Saudi Arabia. This deal marked a significant expansion for Saipem in the Middle East market (Saipem Press Release).
  • In September 2025, Schneider Electric completed the acquisition of Aclara Technologies, a leading provider of smart infrastructure solutions for water, gas, and electric utilities. The acquisition was expected to strengthen Schneider Electric's offerings in pipeline monitoring and management, particularly in the North American market (Schneider Electric Press Release).

Dive into Technavio's robust research methodology, blending expert interviews, extensive data synthesis, and validated models for unparalleled Oil And Gas Pipeline Monitoring Equipment Market insights. See full methodology.

Market Scope

Report Coverage

Details

Page number

221

Base year

2024

Historic period

2019-2023

Forecast period

2025-2029

Growth momentum & CAGR

Accelerate at a CAGR of 4.6%

Market growth 2025-2029

USD 1162.2 million

Market structure

Fragmented

YoY growth 2024-2025(%)

4.2

Key countries

US, China, India, Canada, Saudi Arabia, Japan, Germany, South Korea, Russia, and Mexico

Competitive landscape

Leading Companies, Market Positioning of Companies, Competitive Strategies, and Industry Risks

Request Free Sample

Why Choose Technavio for Oil And Gas Pipeline Monitoring Equipment Market Insights?

"Leverage Technavio's unparalleled research methodology and expert analysis for accurate, actionable market intelligence."

The market is experiencing significant growth due to the increasing demand for reliable and efficient pipeline operations. Pipeline pressure sensor calibration techniques have gained prominence in ensuring accurate measurement and maintaining optimal pressure levels. Real-time flow rate monitoring systems enable operators to detect anomalies and prevent potential issues, while advanced corrosion detection methods help extend the life of pipelines. Acoustic leak detection algorithms continue to improve, providing early warning of potential leaks. Pipeline integrity management software solutions offer comprehensive monitoring capabilities, including stress monitoring and pipeline integrity assessments. Remote pipeline monitoring system deployment and SCADA system integration have become essential for effective pipeline management. Advanced acoustic leak detection techniques, such as ultrasonic and infrasound, offer higher sensitivity and accuracy.

Pressure relief valve performance monitoring is crucial for ensuring safety and preventing catastrophic failures. Gas pipeline monitoring using drones and oil pipeline inspection using robots provide non-destructive inspection methods for hard-to-reach areas. Distributed fiber optic sensing applications offer real-time data acquisition and analysis, enabling predictive maintenance models for pipelines. Smart pigging technology for pipeline inspection offers cost-effective and efficient solutions for detecting anomalies. Pipeline surveillance camera systems provide visual inspection capabilities, while data acquisition systems for pipelines ensure accurate and timely data collection. Real-time data analytics for pipelines enable operators to make informed decisions and prevent potential issues. Pipeline automation system design is crucial for optimizing operations and reducing costs. Predictive maintenance models for pipelines help prevent unscheduled downtime and reduce maintenance costs. Overall, the market is poised for continued growth as operators seek to improve pipeline safety, efficiency, and reliability.

What are the Key Data Covered in this Oil And Gas Pipeline Monitoring Equipment Market Research and Growth Report?

  • What is the expected growth of the Oil And Gas Pipeline Monitoring Equipment Market between 2025 and 2029?

    • USD 1.16 billion, at a CAGR of 4.6%

  • What segmentation does the market report cover?

    • The report is segmented by Product (Hardware components and Software systems), Type (Vibration monitoring, Thermal monitoring, Lubrication monitoring, and Others), Location (On-shore and Off-shore), and Geography (North America, APAC, Europe, Middle East and Africa, and South America)

  • Which regions are analyzed in the report?

    • North America, APAC, Europe, Middle East and Africa, and South America

  • What are the key growth drivers and market challenges?

    • Increasing preference for pipeline transportation, Volatility in crude oil prices

  • Who are the major players in the Oil And Gas Pipeline Monitoring Equipment Market?

    • ABB Ltd., AMETEK Inc., Badger Meter Inc., Emerson Electric Co., Endress Hauser Group Services AG, General Electric Co., Hollysys Automation Technologies Ltd., Honeywell International Inc., Huawei Technologies Co. Ltd., KROHNE Messtechnik GmbH, Mitsubishi Electric Corp., Nova Ventures Group Corp., ORBCOMM Inc., PSI Software AG, QinetiQ Ltd., Rockwell Automation Inc., Schneider Electric SE, Siemens AG, Teledyne Technologies Inc., and Yokogawa Electric Corp.

We can help! Our analysts can customize this oil and gas pipeline monitoring equipment market research report to meet your requirements.

Get in touch

1 Executive Summary

  • 1.1 Market overview
    • Executive Summary - Chart on Market Overview
    • Executive Summary - Data Table on Market Overview
    • Executive Summary - Chart on Global Market Characteristics
    • Executive Summary - Chart on Market by Geography
    • Executive Summary - Chart on Market Segmentation by Product
    • Executive Summary - Chart on Market Segmentation by Type
    • Executive Summary - Chart on Market Segmentation by Location
    • Executive Summary - Chart on Incremental Growth
    • Executive Summary - Data Table on Incremental Growth
    • Executive Summary - Chart on Company Market Positioning

2 Technavio Analysis

  • 2.1 Analysis of price sensitivity, lifecycle, customer purchase basket, adoption rates, and purchase criteria
    • Analysis of price sensitivity, lifecycle, customer purchase basket, adoption rates, and purchase criteria
  • 2.2 Criticality of inputs and Factors of differentiation
    • Overview on criticality of inputs and factors of differentiation
  • 2.3 Factors of disruption
    • Overview on factors of disruption
  • 2.4 Impact of drivers and challenges
    • Impact of drivers and challenges in 2024 and 2029

3 Market Landscape

  • 3.1 Market ecosystem
    • Parent Market
    • Data Table on - Parent Market
  • 3.2 Market characteristics
    • Market characteristics analysis
  • 3.3 Value chain analysis
    • Value chain analysis

4 Market Sizing

  • 4.1 Market definition
    • Offerings of companies included in the market definition
  • 4.2 Market segment analysis
    • Market segments
  • 4.3 Market size 2024
    • 4.4 Market outlook: Forecast for 2024-2029
      • Chart on Global - Market size and forecast 2024-2029 ($ million)
      • Data Table on Global - Market size and forecast 2024-2029 ($ million)
      • Chart on Global Market: Year-over-year growth 2024-2029 (%)
      • Data Table on Global Market: Year-over-year growth 2024-2029 (%)

    5 Historic Market Size

    • 5.1 Global Oil And Gas Pipeline Monitoring Equipment Market 2019 - 2023
      • Historic Market Size - Data Table on Global Oil And Gas Pipeline Monitoring Equipment Market 2019 - 2023 ($ million)
    • 5.2 Product segment analysis 2019 - 2023
      • Historic Market Size - Product Segment 2019 - 2023 ($ million)
    • 5.3 Type segment analysis 2019 - 2023
      • Historic Market Size - Type Segment 2019 - 2023 ($ million)
    • 5.4 Location segment analysis 2019 - 2023
      • Historic Market Size - Location Segment 2019 - 2023 ($ million)
    • 5.5 Geography segment analysis 2019 - 2023
      • Historic Market Size - Geography Segment 2019 - 2023 ($ million)
    • 5.6 Country segment analysis 2019 - 2023
      • Historic Market Size - Country Segment 2019 - 2023 ($ million)

    6 Qualitative Analysis

    • 6.1 The AI impact on Global Oil and Gas Pipeline Monitoring Equipment Market

      7 Five Forces Analysis

      • 7.1 Five forces summary
        • Five forces analysis - Comparison between 2024 and 2029
      • 7.2 Bargaining power of buyers
        • Bargaining power of buyers - Impact of key factors 2024 and 2029
      • 7.3 Bargaining power of suppliers
        • Bargaining power of suppliers - Impact of key factors in 2024 and 2029
      • 7.4 Threat of new entrants
        • Threat of new entrants - Impact of key factors in 2024 and 2029
      • 7.5 Threat of substitutes
        • Threat of substitutes - Impact of key factors in 2024 and 2029
      • 7.6 Threat of rivalry
        • Threat of rivalry - Impact of key factors in 2024 and 2029
      • 7.7 Market condition
        • Chart on Market condition - Five forces 2024 and 2029

      8 Market Segmentation by Product

      • 8.1 Market segments
        • Chart on Product - Market share 2024-2029 (%)
        • Data Table on Product - Market share 2024-2029 (%)
      • 8.2 Comparison by Product
        • Chart on Comparison by Product
        • Data Table on Comparison by Product
      • 8.3 Hardware components - Market size and forecast 2024-2029
        • Chart on Hardware components - Market size and forecast 2024-2029 ($ million)
        • Data Table on Hardware components - Market size and forecast 2024-2029 ($ million)
        • Chart on Hardware components - Year-over-year growth 2024-2029 (%)
        • Data Table on Hardware components - Year-over-year growth 2024-2029 (%)
      • 8.4 Software systems - Market size and forecast 2024-2029
        • Chart on Software systems - Market size and forecast 2024-2029 ($ million)
        • Data Table on Software systems - Market size and forecast 2024-2029 ($ million)
        • Chart on Software systems - Year-over-year growth 2024-2029 (%)
        • Data Table on Software systems - Year-over-year growth 2024-2029 (%)
      • 8.5 Market opportunity by Product
        • Market opportunity by Product ($ million)
        • Data Table on Market opportunity by Product ($ million)

      9 Market Segmentation by Type

      • 9.1 Market segments
        • Chart on Type - Market share 2024-2029 (%)
        • Data Table on Type - Market share 2024-2029 (%)
      • 9.2 Comparison by Type
        • Chart on Comparison by Type
        • Data Table on Comparison by Type
      • 9.3 Vibration monitoring - Market size and forecast 2024-2029
        • Chart on Vibration monitoring - Market size and forecast 2024-2029 ($ million)
        • Data Table on Vibration monitoring - Market size and forecast 2024-2029 ($ million)
        • Chart on Vibration monitoring - Year-over-year growth 2024-2029 (%)
        • Data Table on Vibration monitoring - Year-over-year growth 2024-2029 (%)
      • 9.4 Thermal monitoring - Market size and forecast 2024-2029
        • Chart on Thermal monitoring - Market size and forecast 2024-2029 ($ million)
        • Data Table on Thermal monitoring - Market size and forecast 2024-2029 ($ million)
        • Chart on Thermal monitoring - Year-over-year growth 2024-2029 (%)
        • Data Table on Thermal monitoring - Year-over-year growth 2024-2029 (%)
      • 9.5 Lubrication monitoring - Market size and forecast 2024-2029
        • Chart on Lubrication monitoring - Market size and forecast 2024-2029 ($ million)
        • Data Table on Lubrication monitoring - Market size and forecast 2024-2029 ($ million)
        • Chart on Lubrication monitoring - Year-over-year growth 2024-2029 (%)
        • Data Table on Lubrication monitoring - Year-over-year growth 2024-2029 (%)
      • 9.6 Others - Market size and forecast 2024-2029
        • Chart on Others - Market size and forecast 2024-2029 ($ million)
        • Data Table on Others - Market size and forecast 2024-2029 ($ million)
        • Chart on Others - Year-over-year growth 2024-2029 (%)
        • Data Table on Others - Year-over-year growth 2024-2029 (%)
      • 9.7 Market opportunity by Type
        • Market opportunity by Type ($ million)
        • Data Table on Market opportunity by Type ($ million)

      10 Market Segmentation by Location

      • 10.1 Market segments
        • Chart on Location - Market share 2024-2029 (%)
        • Data Table on Location - Market share 2024-2029 (%)
      • 10.2 Comparison by Location
        • Chart on Comparison by Location
        • Data Table on Comparison by Location
      • 10.3 On-shore - Market size and forecast 2024-2029
        • Chart on On-shore - Market size and forecast 2024-2029 ($ million)
        • Data Table on On-shore - Market size and forecast 2024-2029 ($ million)
        • Chart on On-shore - Year-over-year growth 2024-2029 (%)
        • Data Table on On-shore - Year-over-year growth 2024-2029 (%)
      • 10.4 Off-shore - Market size and forecast 2024-2029
        • Chart on Off-shore - Market size and forecast 2024-2029 ($ million)
        • Data Table on Off-shore - Market size and forecast 2024-2029 ($ million)
        • Chart on Off-shore - Year-over-year growth 2024-2029 (%)
        • Data Table on Off-shore - Year-over-year growth 2024-2029 (%)
      • 10.5 Market opportunity by Location
        • Market opportunity by Location ($ million)
        • Data Table on Market opportunity by Location ($ million)

      11 Customer Landscape

      • 11.1 Customer landscape overview
        • Analysis of price sensitivity, lifecycle, customer purchase basket, adoption rates, and purchase criteria

      12 Geographic Landscape

      • 12.1 Geographic segmentation
        • Chart on Market share by geography 2024-2029 (%)
        • Data Table on Market share by geography 2024-2029 (%)
      • 12.2 Geographic comparison
        • Chart on Geographic comparison
        • Data Table on Geographic comparison
      • 12.3 North America - Market size and forecast 2024-2029
        • Chart on North America - Market size and forecast 2024-2029 ($ million)
        • Data Table on North America - Market size and forecast 2024-2029 ($ million)
        • Chart on North America - Year-over-year growth 2024-2029 (%)
        • Data Table on North America - Year-over-year growth 2024-2029 (%)
      • 12.4 APAC - Market size and forecast 2024-2029
        • Chart on APAC - Market size and forecast 2024-2029 ($ million)
        • Data Table on APAC - Market size and forecast 2024-2029 ($ million)
        • Chart on APAC - Year-over-year growth 2024-2029 (%)
        • Data Table on APAC - Year-over-year growth 2024-2029 (%)
      • 12.5 Europe - Market size and forecast 2024-2029
        • Chart on Europe - Market size and forecast 2024-2029 ($ million)
        • Data Table on Europe - Market size and forecast 2024-2029 ($ million)
        • Chart on Europe - Year-over-year growth 2024-2029 (%)
        • Data Table on Europe - Year-over-year growth 2024-2029 (%)
      • 12.6 Middle East and Africa - Market size and forecast 2024-2029
        • Chart on Middle East and Africa - Market size and forecast 2024-2029 ($ million)
        • Data Table on Middle East and Africa - Market size and forecast 2024-2029 ($ million)
        • Chart on Middle East and Africa - Year-over-year growth 2024-2029 (%)
        • Data Table on Middle East and Africa - Year-over-year growth 2024-2029 (%)
      • 12.7 South America - Market size and forecast 2024-2029
        • Chart on South America - Market size and forecast 2024-2029 ($ million)
        • Data Table on South America - Market size and forecast 2024-2029 ($ million)
        • Chart on South America - Year-over-year growth 2024-2029 (%)
        • Data Table on South America - Year-over-year growth 2024-2029 (%)
      • 12.8 US - Market size and forecast 2024-2029
        • Chart on US - Market size and forecast 2024-2029 ($ million)
        • Data Table on US - Market size and forecast 2024-2029 ($ million)
        • Chart on US - Year-over-year growth 2024-2029 (%)
        • Data Table on US - Year-over-year growth 2024-2029 (%)
      • 12.9 China - Market size and forecast 2024-2029
        • Chart on China - Market size and forecast 2024-2029 ($ million)
        • Data Table on China - Market size and forecast 2024-2029 ($ million)
        • Chart on China - Year-over-year growth 2024-2029 (%)
        • Data Table on China - Year-over-year growth 2024-2029 (%)
      • 12.10 India - Market size and forecast 2024-2029
        • Chart on India - Market size and forecast 2024-2029 ($ million)
        • Data Table on India - Market size and forecast 2024-2029 ($ million)
        • Chart on India - Year-over-year growth 2024-2029 (%)
        • Data Table on India - Year-over-year growth 2024-2029 (%)
      • 12.11 Canada - Market size and forecast 2024-2029
        • Chart on Canada - Market size and forecast 2024-2029 ($ million)
        • Data Table on Canada - Market size and forecast 2024-2029 ($ million)
        • Chart on Canada - Year-over-year growth 2024-2029 (%)
        • Data Table on Canada - Year-over-year growth 2024-2029 (%)
      • 12.12 Saudi Arabia - Market size and forecast 2024-2029
        • Chart on Saudi Arabia - Market size and forecast 2024-2029 ($ million)
        • Data Table on Saudi Arabia - Market size and forecast 2024-2029 ($ million)
        • Chart on Saudi Arabia - Year-over-year growth 2024-2029 (%)
        • Data Table on Saudi Arabia - Year-over-year growth 2024-2029 (%)
      • 12.13 Japan - Market size and forecast 2024-2029
        • Chart on Japan - Market size and forecast 2024-2029 ($ million)
        • Data Table on Japan - Market size and forecast 2024-2029 ($ million)
        • Chart on Japan - Year-over-year growth 2024-2029 (%)
        • Data Table on Japan - Year-over-year growth 2024-2029 (%)
      • 12.14 Germany - Market size and forecast 2024-2029
        • Chart on Germany - Market size and forecast 2024-2029 ($ million)
        • Data Table on Germany - Market size and forecast 2024-2029 ($ million)
        • Chart on Germany - Year-over-year growth 2024-2029 (%)
        • Data Table on Germany - Year-over-year growth 2024-2029 (%)
      • 12.15 South Korea - Market size and forecast 2024-2029
        • Chart on South Korea - Market size and forecast 2024-2029 ($ million)
        • Data Table on South Korea - Market size and forecast 2024-2029 ($ million)
        • Chart on South Korea - Year-over-year growth 2024-2029 (%)
        • Data Table on South Korea - Year-over-year growth 2024-2029 (%)
      • 12.16 Russia - Market size and forecast 2024-2029
        • Chart on Russia - Market size and forecast 2024-2029 ($ million)
        • Data Table on Russia - Market size and forecast 2024-2029 ($ million)
        • Chart on Russia - Year-over-year growth 2024-2029 (%)
        • Data Table on Russia - Year-over-year growth 2024-2029 (%)
      • 12.17 Mexico - Market size and forecast 2024-2029
        • Chart on Mexico - Market size and forecast 2024-2029 ($ million)
        • Data Table on Mexico - Market size and forecast 2024-2029 ($ million)
        • Chart on Mexico - Year-over-year growth 2024-2029 (%)
        • Data Table on Mexico - Year-over-year growth 2024-2029 (%)
      • 12.18 Market opportunity by geography
        • Market opportunity by geography ($ million)
        • Data Tables on Market opportunity by geography ($ million)

      13 Drivers, Challenges, and Opportunity/Restraints

      • 13.1 Market drivers
        • 13.2 Market challenges
          • 13.3 Impact of drivers and challenges
            • Impact of drivers and challenges in 2024 and 2029
          • 13.4 Market opportunities/restraints

            14 Competitive Landscape

            • 14.1 Overview
              • 14.2 Competitive Landscape
                • Overview on criticality of inputs and factors of differentiation
              • 14.3 Landscape disruption
                • Overview on factors of disruption
              • 14.4 Industry risks
                • Impact of key risks on business

              15 Competitive Analysis

              • 15.1 Companies profiled
                • Companies covered
              • 15.2 Company ranking index
                • Company ranking index
              • 15.3 Market positioning of companies
                • Matrix on companies position and classification
              • 15.4 ABB Ltd.
                • ABB Ltd. - Overview
                • ABB Ltd. - Business segments
                • ABB Ltd. - Key news
                • ABB Ltd. - Key offerings
                • ABB Ltd. - Segment focus
                • SWOT
              • 15.5 AMETEK Inc.
                • AMETEK Inc. - Overview
                • AMETEK Inc. - Business segments
                • AMETEK Inc. - Key news
                • AMETEK Inc. - Key offerings
                • AMETEK Inc. - Segment focus
                • SWOT
              • 15.6 Badger Meter Inc.
                • Badger Meter Inc. - Overview
                • Badger Meter Inc. - Product / Service
                • Badger Meter Inc. - Key news
                • Badger Meter Inc. - Key offerings
                • SWOT
              • 15.7 Emerson Electric Co.
                • Emerson Electric Co. - Overview
                • Emerson Electric Co. - Business segments
                • Emerson Electric Co. - Key news
                • Emerson Electric Co. - Key offerings
                • Emerson Electric Co. - Segment focus
                • SWOT
              • 15.8 General Electric Co.
                • General Electric Co. - Overview
                • General Electric Co. - Business segments
                • General Electric Co. - Key news
                • General Electric Co. - Key offerings
                • General Electric Co. - Segment focus
                • SWOT
              • 15.9 Honeywell International Inc.
                • Honeywell International Inc. - Overview
                • Honeywell International Inc. - Business segments
                • Honeywell International Inc. - Key news
                • Honeywell International Inc. - Key offerings
                • Honeywell International Inc. - Segment focus
                • SWOT
              • 15.10 Huawei Technologies Co. Ltd.
                • Huawei Technologies Co. Ltd. - Overview
                • Huawei Technologies Co. Ltd. - Product / Service
                • Huawei Technologies Co. Ltd. - Key news
                • Huawei Technologies Co. Ltd. - Key offerings
                • SWOT
              • 15.11 KROHNE Messtechnik GmbH
                • KROHNE Messtechnik GmbH - Overview
                • KROHNE Messtechnik GmbH - Product / Service
                • KROHNE Messtechnik GmbH - Key news
                • KROHNE Messtechnik GmbH - Key offerings
                • SWOT
              • 15.12 Mitsubishi Electric Corp.
                • Mitsubishi Electric Corp. - Overview
                • Mitsubishi Electric Corp. - Business segments
                • Mitsubishi Electric Corp. - Key offerings
                • Mitsubishi Electric Corp. - Segment focus
                • SWOT
              • 15.13 ORBCOMM Inc.
                • ORBCOMM Inc. - Overview
                • ORBCOMM Inc. - Product / Service
                • ORBCOMM Inc. - Key offerings
                • SWOT
              • 15.14 QinetiQ Ltd.
                • QinetiQ Ltd. - Overview
                • QinetiQ Ltd. - Business segments
                • QinetiQ Ltd. - Key news
                • QinetiQ Ltd. - Key offerings
                • QinetiQ Ltd. - Segment focus
                • SWOT
              • 15.15 Rockwell Automation Inc.
                • Rockwell Automation Inc. - Overview
                • Rockwell Automation Inc. - Business segments
                • Rockwell Automation Inc. - Key news
                • Rockwell Automation Inc. - Key offerings
                • Rockwell Automation Inc. - Segment focus
                • SWOT
              • 15.16 Schneider Electric SE
                • Schneider Electric SE - Overview
                • Schneider Electric SE - Business segments
                • Schneider Electric SE - Key news
                • Schneider Electric SE - Key offerings
                • Schneider Electric SE - Segment focus
                • SWOT
              • 15.17 Siemens AG
                • Siemens AG - Overview
                • Siemens AG - Business segments
                • Siemens AG - Key news
                • Siemens AG - Key offerings
                • Siemens AG - Segment focus
                • SWOT
              • 15.18 Yokogawa Electric Corp.
                • Yokogawa Electric Corp. - Overview
                • Yokogawa Electric Corp. - Business segments
                • Yokogawa Electric Corp. - Key news
                • Yokogawa Electric Corp. - Key offerings
                • Yokogawa Electric Corp. - Segment focus
                • SWOT

              16 Appendix

              • 16.1 Scope of the report
                • 16.2 Inclusions and exclusions checklist
                  • Inclusions checklist
                  • Exclusions checklist
                • 16.3 Currency conversion rates for US$
                  • Currency conversion rates for US$
                • 16.4 Research methodology
                  • Research methodology
                • 16.5 Data procurement
                  • Information sources
                • 16.6 Data validation
                  • Data validation
                • 16.7 Validation techniques employed for market sizing
                  • Validation techniques employed for market sizing
                • 16.8 Data synthesis
                  • Data synthesis
                • 16.9 360 degree market analysis
                  • 360 degree market analysis
                • 16.10 List of abbreviations
                  • List of abbreviations

                Research Methodology

                Technavio presents a detailed picture of the market by way of study, synthesis, and summation of data from multiple sources. The analysts have presented the various facets of the market with a particular focus on identifying the key industry influencers. The data thus presented is comprehensive, reliable, and the result of extensive research, both primary and secondary.

                INFORMATION SOURCES

                Primary sources

                • Manufacturers and suppliers
                • Channel partners
                • Industry experts
                • Strategic decision makers

                Secondary sources

                • Industry journals and periodicals
                • Government data
                • Financial reports of key industry players
                • Historical data
                • Press releases

                DATA ANALYSIS

                Data Synthesis

                • Collation of data
                • Estimation of key figures
                • Analysis of derived insights

                Data Validation

                • Triangulation with data models
                • Reference against proprietary databases
                • Corroboration with industry experts

                REPORT WRITING

                Qualitative

                • Market drivers
                • Market challenges
                • Market trends
                • Five forces analysis

                Quantitative

                • Market size and forecast
                • Market segmentation
                • Geographical insights
                • Competitive landscape

                Interested in this report?

                Get your sample now to see our research methodology and insights!

                Download Now

                Frequently Asked Questions

                Oil And Gas Pipeline Monitoring Equipment market growth will increase by $ 1162.2 mn during 2025-2029.

                The Oil And Gas Pipeline Monitoring Equipment market is expected to grow at a CAGR of 4.6% during 2025-2029.

                Oil And Gas Pipeline Monitoring Equipment market is segmented by Product( Hardware components, Software systems) Type( Vibration monitoring, Thermal monitoring, Lubrication monitoring, Others, South America) Location( On-shore, Off-shore, Europe, Middle East and Africa, South America)

                ABB Ltd., AMETEK Inc., Badger Meter Inc., Emerson Electric Co., Endress Hauser Group Services AG, General Electric Co., Hollysys Automation Technologies Ltd., Honeywell International Inc., Huawei Technologies Co. Ltd., KROHNE Messtechnik GmbH, Mitsubishi Electric Corp., Nova Ventures Group Corp., ORBCOMM Inc., PSI Software AG, QinetiQ Ltd., Rockwell Automation Inc., Schneider Electric SE, Siemens AG, Teledyne Technologies Inc., Yokogawa Electric Corp. are a few of the key vendors in the Oil And Gas Pipeline Monitoring Equipment market.

                North America will register the highest growth rate of 38% among the other regions. Therefore, the Oil And Gas Pipeline Monitoring Equipment market in North America is expected to garner significant business opportunities for the vendors during the forecast period.

                US, China, India, Canada, Saudi Arabia, Japan, Germany, South Korea, Russia, Mexico

                • Increasing preference for pipeline transportationThe transportation of oil and gas is usually referred to as midstream. Transport modes in the oil and gas industry include transportation through pipelines is the driving factor this market.
                • shipping is the driving factor this market.
                • trucking is the driving factor this market.
                • and railroading. Oil and gas are often produced at remote locations is the driving factor this market.
                • from where they are transported to refineries is the driving factor this market.
                • after which they are processed into refined products and transported to end-users. Oil and gas projects are long-term projects is the driving factor this market.
                • having an average life cycle of 20-30 years.Pipelines are preferred for long-distance oil and gas transport over other modes due to the following features:Pipelines have a very low energy consumption and is the driving factor this market.
                • therefore is the driving factor this market.
                • lower carbon footprint.They are highly reliable and can operate round the clock because their dependence on external factors is limited.Pipelines can be laid through any terrain and underseas.Pipelines need very little maintenance. Hence is the driving factor this market.
                • they are economical.Pipelines are safe and environmentally friendly.Pipelines are capable of continuous transportation of a large quantity of products.Oil and gas transportation via pipelines costs much less is the driving factor this market.
                • an average of $3 per bbl is the driving factor this market.
                • whereas rail transport typically costs $6-$15 per bbl.As oil resources are depleting is the driving factor this market.
                • companies are venturing into new projects. These off-shore projects generally take place inside deep seas. Transporting oil through ships is expensive and requires frequent trips. However is the driving factor this market.
                • with pipelines is the driving factor this market.
                • the transportation of oil and gas can run continuously and can be ramped up or shut down at any time. Pipelines have been the most preferred mode of transporting oil and gas. Increasing global consumption of oil and gas will drive the global oil and gas pipeline monitoring equipment market in the forecast period. is the driving factor this market.

                The Oil And Gas Pipeline Monitoring Equipment market vendors should focus on grabbing business opportunities from the Hardware components segment as it accounted for the largest market share in the base year.