Offshore Oil And Gas Pipeline Market Analysis, Size, and Forecast 2025-2029: North America , Europe (Italy, Norway, Russia, and Spain), Middle East and Africa (UAE and Turkey), APAC (China, Japan), South America (Brazil), and Rest of World (ROW)

Offshore Oil And Gas Pipeline Market Analysis, Size, and Forecast 2025-2029:
North America , Europe (Italy, Norway, Russia, and Spain), Middle East and Africa (UAE and Turkey), APAC (China, Japan), South America (Brazil), and Rest of World (ROW)

Published: Apr 2025 238 Pages SKU: IRTNTR44116

Market Overview at a Glance

$4.46 B
Market Opportunity
5.7%
CAGR
5.3
YoY growth 2024-2025(%)

Offshore Oil And Gas Pipeline Market Size 2025-2029

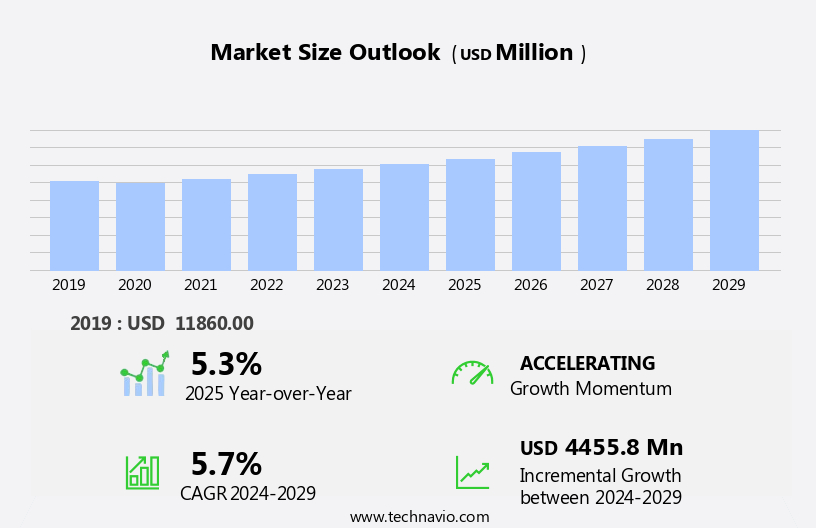
The offshore oil and gas pipeline market size is forecast to increase by USD 4.46 billion, at a CAGR of 5.7% between 2024 and 2029.

  • The market is driven by the economic benefits it offers over other transportation modes for oil and gas. The vast reserves of hydrocarbons located offshore necessitate long-distance transportation, making pipelines a cost-effective solution compared to other methods like tankers or LNG carriers. Furthermore, advancements in offshore pipeline inspection technologies have significantly improved safety and efficiency, enabling operators to extend the life of existing pipelines and reduce maintenance costs. However, the market faces challenges from the volatility in global crude oil and natural gas prices. Fluctuations in prices can impact the profitability of pipeline projects, making it essential for companies to maintain operational flexibility and adapt to market conditions.
  • Additionally, the increasing complexity of offshore pipeline infrastructure, coupled with the harsh marine environment, presents unique challenges in terms of construction, maintenance, and safety. Effective risk management strategies and continuous technological innovation are crucial for companies to capitalize on the market opportunities and navigate these challenges successfully.

What will be the Size of the Offshore Oil And Gas Pipeline Market during the forecast period?

Offshore Oil And Gas Pipeline Market Size

Explore in-depth regional segment analysis with market size data - historical 2019-2023 and forecasts 2025-2029 - in the full report.  
Request Free Sample

The market continues to evolve, shaped by dynamic market conditions and advancing technologies. Pipeline modeling plays a crucial role in optimizing pipeline design and routing, taking into account various factors such as flow measurement, safety, and environmental impact. Pipeline corrosion is a persistent challenge, necessitating continuous monitoring and maintenance, including pipeline repair and rehabilitation. Plastic pipe offers an alternative to steel, bringing cost savings and sustainability benefits. Pipeline SCADA systems enable real-time monitoring and automation, enhancing pipeline control and safety. Pipeline integrity is a top priority, with data analytics and certification playing essential roles in ensuring pipeline sustainability.

Leak detection technologies are continually advancing, reducing response times and minimizing environmental impact. Pipeline installation and burying require meticulous planning and execution, with engineering and asset management playing key roles. Pipeline economics are influenced by various factors, including funding, regulations, and investment. Pipeline abandonment and decommissioning present unique challenges, requiring careful planning and execution. Pipeline construction and development are ongoing processes, with ongoing research and innovation shaping pipeline materials, coatings, and installation techniques. Pipeline trenching and laying are critical steps in pipeline construction, with safety and environmental considerations at the forefront. Pipeline inspection and maintenance are ongoing requirements, with regulations and standards guiding best practices.

Subsea pipelines present unique challenges, requiring specialized expertise and technologies for installation, maintenance, and inspection. Pipeline risk assessment and optimization are essential components of pipeline asset management, ensuring the safe and efficient operation of pipelines. Concrete pipe offers an alternative to steel and plastic, bringing benefits such as durability and cost savings. Pipeline simulation and pipeline flow measurement are crucial tools for pipeline optimization and efficiency. Pipeline regulations and standards are continually evolving, reflecting the latest technological advancements and best practices. Pipeline pigging is a critical maintenance activity, ensuring pipeline cleanliness and efficiency. Pipeline rehabilitation and pipeline design are ongoing processes, with a focus on sustainability, safety, and cost savings.

Pipeline environmental impact is a growing concern, with ongoing research and innovation aimed at reducing environmental footprints. Pipeline life cycle management is a holistic approach to pipeline management, encompassing all stages from design to decommissioning. In the market, dynamism and innovation are the norm. From pipeline modeling and corrosion to pipeline automation and sustainability, ongoing research and technological advancements are shaping the market landscape. Pipeline fabrication, welding, routing, monitoring, safety, trenching, laying, flow measurement, development, abandonment, funding, maintenance, regulations, control systems, engineering, asset management, burying, materials, coating, optimization, surveys, modeling, certification, leak detection, automation, installation, economics, environmental impact, life cycle, construction, investment, inspection, standards, subsea pipelines, pigging, design, rehabilitation, concrete pipe, and risk assessment all play essential roles in this complex and evolving market.

How is this Offshore Oil And Gas Pipeline Industry segmented?

The offshore oil and gas pipeline industry research report provides comprehensive data (region-wise segment analysis), with forecasts and estimates in "USD million" for the period 2025-2029, as well as historical data from 2019-2023 for the following segments.

  • Sector
    • Up stream
    • Mid stream
    • Down stream
  • Product
    • Oil
    • Gas
    • Refined products
  • Type
    • Transport lines
    • Export lines
    • Others
  • Product Type
    • Below 24 inches
    • Greater than 24 inches
  • Geography
    • Europe
      • Italy
      • Norway
      • Russia
      • Spain
    • Middle East and Africa
      • UAE
      • Turkey
    • APAC
      • China
      • Japan
    • South America
      • Brazil
    • Rest of World (ROW)

    By Sector Insights

    The up stream segment is estimated to witness significant growth during the forecast period.

    The market encompasses various stages from pipeline development to abandonment. Pipeline fabrication is a crucial process involving the manufacturing of steel pipes for transportation infrastructure. Pipeline welding ensures the pipes' integrity through robust joining techniques. Pipeline routing requires careful planning, considering factors like depth, water currents, and proximity to other structures. Pipeline monitoring systems ensure safety and efficiency through real-time data analytics and pipeline integrity management. Regulations mandate stringent safety measures, including pipeline safety protocols and regular inspections. Pipeline trenching and laying involve careful placement to prevent damage and ensure optimal flow measurement. Pipeline optimization uses advanced modeling and simulation to maximize efficiency and minimize environmental impact.

    Pipeline materials, including steel and plastic, undergo rigorous testing and certification processes. Pipeline corrosion is mitigated through protective coatings and regular maintenance. Pipeline rehabilitation and pipeline design are essential for extending the life cycle of existing infrastructure. Pipeline burying and pipeline installation require specialized equipment and techniques. Pipeline economics and environmental impact assessments are critical considerations throughout the pipeline's life cycle. Subsea pipelines face unique challenges, including high pressure, deep water, and harsh environmental conditions. Pipeline pigging and pipeline rehabilitation techniques address these challenges, ensuring the continued safe and efficient transportation of resources. Pipeline risk assessment is an ongoing process to minimize potential hazards and ensure regulatory compliance.

    Offshore Oil And Gas Pipeline Market Size

    Request Free Sample

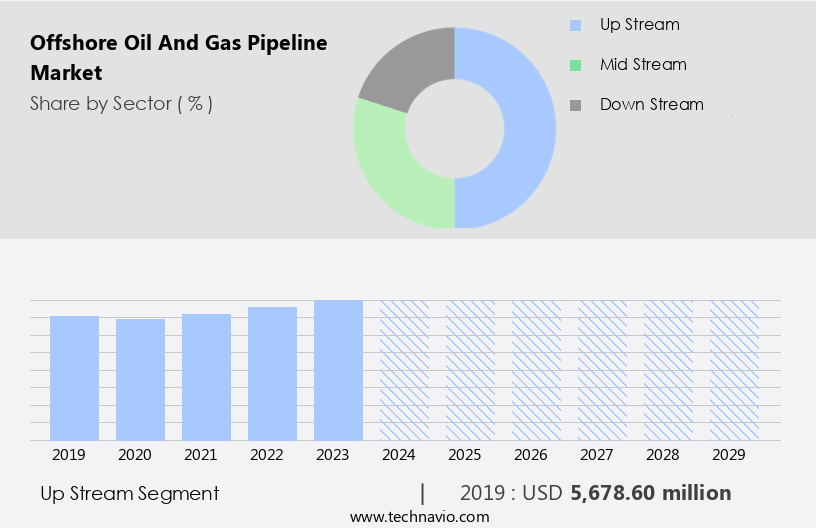
    The Up stream segment was valued at USD 5.68 billion in 2019 and showed a gradual increase during the forecast period.

    Regional Analysis

    Europe is estimated to contribute 50% to the growth of the global market during the forecast period.Technavio’s analysts have elaborately explained the regional trends and drivers that shape the market during the forecast period.

    Offshore Oil And Gas Pipeline Market Share by Geography

     Request Free Sample

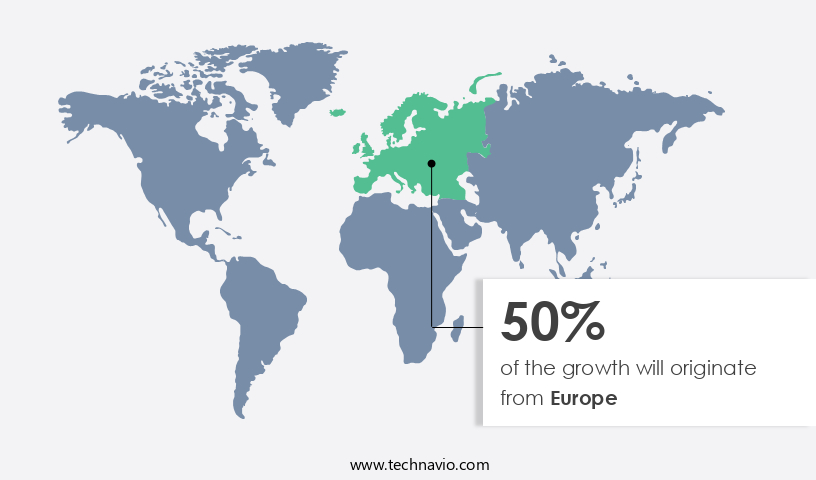
    The market in Europe is significantly shaped by Western Europe and Russia, with numerous projects in the North Sea driving its growth. For instance, BP PLC, a leading global oil and gas company, invested USD150 billion in May 2022 to develop the Murlach oil field in the North Sea, set for completion by the end of 2025. This investment, among others, presents continuous opportunities for upstream players, generating substantial revenue for market participants. Furthermore, several oil and gas E&P development projects are slated for completion in Russia by H2 2025, with capital investments surpassing USD150 billion. These projects will contribute to the market's expansion during the forecast period.

    Pipeline fabrication and welding are crucial processes in constructing these offshore pipelines. Pipeline routing and trenching are essential for ensuring the pipelines' safety and efficiency. Monitoring, maintenance, and repair are ongoing requirements to ensure pipeline integrity and sustainability. Regulations and control systems play a vital role in ensuring pipeline safety and compliance. Pipeline engineering, asset management, optimization, and modeling are essential aspects of pipeline development and rehabilitation. Materials, coatings, and corrosion management are critical factors in pipeline longevity. Pipeline surveys, leak detection, and automation are essential for pipeline inspection and maintenance. Pipeline economics, environmental impact, and certification are significant considerations in pipeline investment decisions.

    Subsea pipelines, pigging, and rehabilitation are integral parts of pipeline infrastructure. Concrete pipe and risk assessment are also essential components of the market.

    Market Dynamics

    Our researchers analyzed the data with 2024 as the base year, along with the key drivers, trends, and challenges. A holistic analysis of drivers will help companies refine their marketing strategies to gain a competitive advantage.

    What are the key market drivers leading to the rise in the adoption of Offshore Oil And Gas Pipeline Industry?

    • The primary factor driving the market is the significant economic advantages of offshore pipelines over other modes of oil and gas transportation

    • Offshore oil and gas pipelines serve a crucial role in transporting crude oil, natural gas, and petroleum products from offshore production sites to onshore consumption centers. Compared to marine vessels, offshore pipelines offer several advantages. They require less energy consumption and have a lower carbon footprint, making them a more sustainable choice for long-distance transportation. Additionally, offshore pipelines boast lower operational and maintenance costs, making them a more economical option than other transportation modes. Pipeline engineering, pipeline asset management, pipeline simulation, pipeline repair, pipeline control systems, pipeline optimization, pipeline surveys, pipeline burying, and pipeline materials, including pipeline coating, play essential roles in ensuring the efficient and safe operation of offshore pipelines.
    • Pipeline regulations also play a significant part in maintaining the integrity and safety of these vital infrastructure assets.

    What are the market trends shaping the Offshore Oil And Gas Pipeline Industry?

    • Offshore pipeline inspection is currently experiencing significant advancements, making it a noteworthy market trend for professionals in the industry. The adoption of innovative technologies, such as autonomous underwater vehicles and non-destructive testing methods, is driving this progression.

    • Offshore oil and gas pipelines play a crucial role in transporting hydrocarbons from remote locations to refineries and markets. However, ensuring their safety and integrity is a significant challenge due to the harsh marine environment and operational complexities. Advanced pipeline modeling and SCADA systems enable remote monitoring, enhancing pipeline integrity and sustainability. Pigging, a maintenance practice involving the use of scrapers or pigs, is essential for inspecting pipelines. However, smaller diameter or bent pipelines may not be piggable, leading to undetected corrosion, metal loss, or cracks.
    • Pipeline data analytics and automation are vital for proactive leak detection and certification. Plastic pipes offer potential solutions due to their resistance to corrosion. The pipeline industry continues to invest in research and development to improve pipeline economics and reduce environmental risks.

    What challenges does the Offshore Oil And Gas Pipeline Industry face during its growth?

    • The volatility in global crude oil and natural gas prices poses a significant challenge to the growth of the industry. 

    • The market is a critical infrastructure sector that faces significant challenges due to the volatility of global crude oil and gas prices. This market dynamics can significantly impact pipeline investment, construction, and maintenance. Pipeline environmental impact is a crucial consideration throughout the pipeline life cycle, from design and construction to inspection and rehabilitation. Pipeline standards and regulations play a vital role in ensuring safety and minimizing risks. Pipeline inspection is essential to identify potential issues and maintain optimal performance. Technologies such as pipeline pigging and subsea pipeline inspection are increasingly being used to enhance pipeline integrity. Pipeline design and rehabilitation may involve the use of advanced materials like concrete pipe to improve durability and reduce environmental impact.
    • Pipeline risk assessment is an ongoing process to identify and mitigate potential hazards, ensuring the safe and efficient operation of pipelines. Overall, the market requires a robust and harmonious approach to pipeline investment, construction, and maintenance to mitigate risks and optimize performance.

    Exclusive Customer Landscape

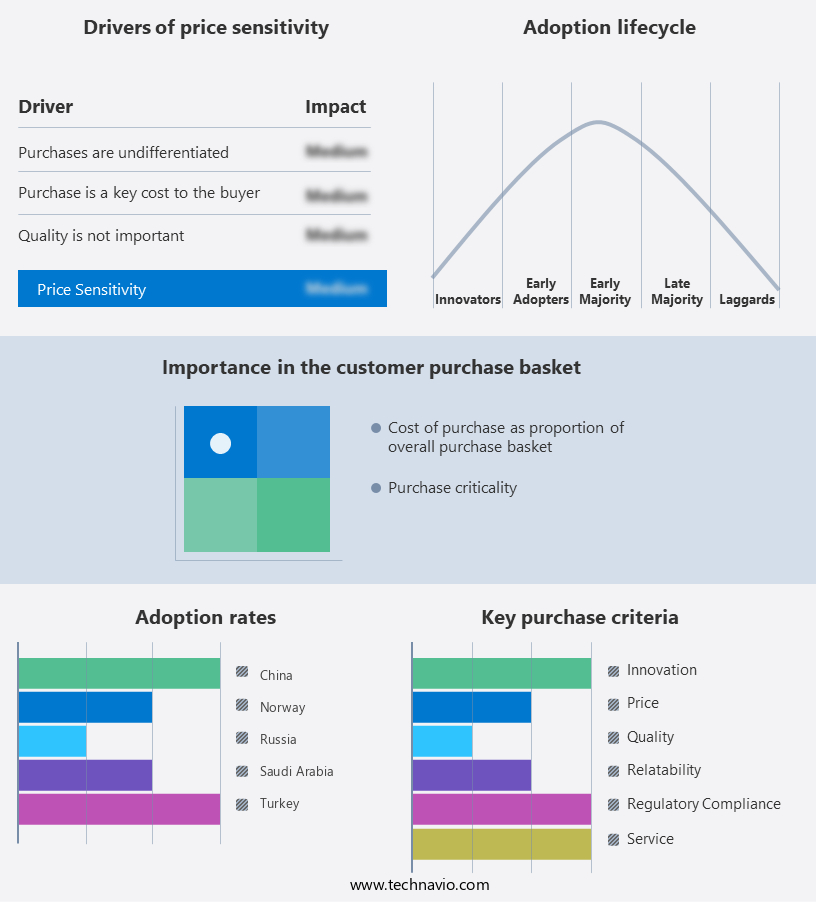
    The offshore oil and gas pipeline market forecasting report includes the adoption lifecycle of the market, covering from the innovator’s stage to the laggard’s stage. It focuses on adoption rates in different regions based on penetration. Furthermore, the offshore oil and gas pipeline market report also includes key purchase criteria and drivers of price sensitivity to help companies evaluate and develop their market growth analysis strategies.

    Offshore Oil And Gas Pipeline Market Share by Geography

     Customer Landscape

    Key Companies & Market Insights

    Companies are implementing various strategies, such as strategic alliances, offshore oil and gas pipeline market forecast, partnerships, mergers and acquisitions, geographical expansion, and product/service launches, to enhance their presence in the industry.

    Allseas Group SA - The company specializes in providing offshore oil and gas pipeline solutions, including Solitaire and Pioneering Spirit pipelay services for both deepwater and shallow-water pipeline installations. Our expertise lies in delivering advanced pipelay capabilities, ensuring project efficiency and safety. Solitaire, a state-of-the-art pipelay vessel, boasts a high-capacity pipelay system and versatile capabilities for various pipeline projects. Pioneering Spirit, a heavy-lift vessel, offers unparalleled installation capacity for large offshore structures, including pipelines and platforms. By combining technical innovation with operational excellence, we enable our clients to optimize their offshore energy infrastructure projects.

    The industry research and growth report includes detailed analyses of the competitive landscape of the market and information about key companies, including:

    • Allseas Group SA
    • ArcelorMittal SA
    • Atteris Pty. Ltd.
    • Fugro NV
    • JFE Holdings Inc.
    • John Wood Group PLC
    • Larsen and Toubro Ltd.
    • McDermott International Ltd.
    • National Petroleum Construction Co.
    • Nippon Steel Corp.
    • PAO Severstal
    • Saipem S.p.A.
    • Salzgitter AG
    • Sapura Energy Berhad
    • Shengli Oil and Gas Pipe Holdings Ltd.
    • Subsea 7 SA
    • TechnipFMC plc
    • Tenaris SA
    • TMK
    • United Metallurgical Co.

    Qualitative and quantitative analysis of companies has been conducted to help clients understand the wider business environment as well as the strengths and weaknesses of key industry players. Data is qualitatively analyzed to categorize companies as pure play, category-focused, industry-focused, and diversified; it is quantitatively analyzed to categorize companies as dominant, leading, strong, tentative, and weak.

    Recent Development and News in Offshore Oil And Gas Pipeline Market

    • In February 2023, Royal Dutch Shell and its partners announced the final investment decision for the Hollandse Kust (Noord) offshore wind farm project, which includes the construction of a 1,100-megawatt wind farm and a 150-kilometer-long high-voltage direct current (HVDC) subsea power cable system to connect the wind farm to the Dutch electricity grid (Shell, 2023). This development signifies a significant expansion in the offshore renewable energy sector's integration with offshore oil and gas pipelines.
    • In March 2024, Equinor and bp signed a strategic collaboration agreement to jointly develop and operate the Rosebank oil and gas field in the UK North Sea. The partnership aims to reduce carbon emissions by integrating carbon capture, utilization, and storage (CCUS) technologies into the project. This collaboration represents a major strategic move towards decarbonizing the offshore oil and gas industry (Equinor, 2024).
    • In May 2024, TotalEnergies and Adani Group announced the formation of a joint venture to develop the D6 Block offshore oil and gas field in the Bay of Bengal. The partnership involves a USD2.5 billion investment in the development of the field, which is expected to produce 1.2 billion cubic meters of natural gas per year. This geographic expansion underscores the growing demand for offshore oil and gas resources in emerging markets (TotalEnergies, 2024).
    • In October 2025, Saipem and Technip Energies announced the successful deployment of a new flexible pipelay system, the S-lay 10,000, capable of installing pipelines up to 10,000 tons in water depths of up to 3,000 meters. This technological advancement significantly increases the feasibility of developing offshore oil and gas fields in deeper waters, expanding the market's potential (Saipem, 2025).

    Research Analyst Overview

    • The market is witnessing significant advancements, driven by the integration of innovative technologies and the need for emissions reduction and operational efficiency. Pipeline carbon capture solutions are gaining traction, aiming to minimize greenhouse gas emissions from offshore operations. Anodic protection and predictive maintenance are crucial for pipeline longevity, reducing the need for costly repairs and downtime. Rov operations and subsea production systems enable efficient deepwater pipeline management, while pipeline artificial intelligence and machine learning optimize performance and predict potential failures. Pipeline blue economy initiatives promote sustainable practices, aligning with the offshore industry's shift towards renewable energy. Offshore platforms are adopting green technologies, such as cathodic protection systems, to minimize environmental impact.
    • Non-destructive testing, hydrostatic testing, and stress analysis ensure pipeline integrity, while pipeline renewable energy integration supports the transition to cleaner energy sources. Pipeline decommissioning and remediation are essential aspects of the market, addressing the challenges of aging infrastructure. Riser systems and ultra-deepwater pipelines require advanced technologies like fatigue analysis and digital twin simulations for safe and cost-effective maintenance. Cloud computing and pipeline remote monitoring enable real-time data analysis, enhancing operational efficiency and safety.

    Dive into Technavio’s robust research methodology, blending expert interviews, extensive data synthesis, and validated models for unparalleled Offshore Oil And Gas Pipeline Market insights. See full methodology.

    Market Scope

    Report Coverage

    Details

    Page number

    238

    Base year

    2024

    Historic period

    2019-2023

    Forecast period

    2025-2029

    Growth momentum & CAGR

    Accelerate at a CAGR of 5.7%

    Market growth 2025-2029

    USD 4455.8 million

    Market structure

    Fragmented

    YoY growth 2024-2025(%)

    5.3

    Key countries

    Russia, Norway, Turkey, Saudi Arabia, China, Italy, UAE, Spain, Brazil, and Japan

    Competitive landscape

    Leading Companies, Market Positioning of Companies, Competitive Strategies, and Industry Risks

    Request Free Sample

    What are the Key Data Covered in this Offshore Oil And Gas Pipeline Market Research and Growth Report?

    • CAGR of the Offshore Oil And Gas Pipeline industry during the forecast period
    • Detailed information on factors that will drive the growth and forecasting between 2025 and 2029
    • Precise estimation of the size of the market and its contribution of the industry in focus to the parent market
    • Accurate predictions about upcoming growth and trends and changes in consumer behaviour
    • Growth of the market across Europe, Middle East and Africa, APAC, South America, and North America
    • Thorough analysis of the market’s competitive landscape and detailed information about companies
    • Comprehensive analysis of factors that will challenge the offshore oil and gas pipeline market growth of industry companies

    We can help! Our analysts can customize this offshore oil and gas pipeline market research report to meet your requirements.

    Get in touch


    1 Executive Summary

    • 1.1 Market overview
      • Executive Summary - Chart on Market Overview
      • Executive Summary - Data Table on Market Overview
      • Executive Summary - Chart on Global Market Characteristics
      • Executive Summary - Chart on Market by Geography
      • Executive Summary - Chart on Market Segmentation by Sector
      • Executive Summary - Chart on Market Segmentation by Product
      • Executive Summary - Chart on Market Segmentation by Type
      • Executive Summary - Chart on Market Segmentation by Product Type
      • Executive Summary - Chart on Incremental Growth
      • Executive Summary - Data Table on Incremental Growth
      • Executive Summary - Chart on Company Market Positioning

    2 Technavio Analysis

    • 2.1 Analysis of price sensitivity, lifecycle, customer purchase basket, adoption rates, and purchase criteria
      • Analysis of price sensitivity, lifecycle, customer purchase basket, adoption rates, and purchase criteria
    • 2.2 Criticality of inputs and Factors of differentiation
      • Overview on criticality of inputs and factors of differentiation
    • 2.3 Factors of disruption
      • Overview on factors of disruption
    • 2.4 Impact of drivers and challenges
      • Impact of drivers and challenges in 2024 and 2029

    3 Market Landscape

    • 3.1 Market ecosystem
      • Parent Market
      • Data Table on - Parent Market
    • 3.2 Market characteristics
      • Market characteristics analysis
    • 3.3 Value chain analysis
      • Value chain analysis

    4 Market Sizing

    • 4.1 Market definition
      • Offerings of companies included in the market definition
    • 4.2 Market segment analysis
      • Market segments
    • 4.3 Market size 2024
      • 4.4 Market outlook: Forecast for 2024-2029
        • Chart on Global - Market size and forecast 2024-2029 ($ million)
        • Data Table on Global - Market size and forecast 2024-2029 ($ million)
        • Chart on Global Market: Year-over-year growth 2024-2029 (%)
        • Data Table on Global Market: Year-over-year growth 2024-2029 (%)

      5 Historic Market Size

      • 5.1 Global Offshore Oil And Gas Pipeline Market 2019 - 2023
        • Historic Market Size - Data Table on Global Offshore Oil And Gas Pipeline Market 2019 - 2023 ($ million)
      • 5.2 Sector segment analysis 2019 - 2023
        • Historic Market Size - Sector Segment 2019 - 2023 ($ million)
      • 5.3 Product segment analysis 2019 - 2023
        • Historic Market Size - Product Segment 2019 - 2023 ($ million)
      • 5.4 Type segment analysis 2019 - 2023
        • Historic Market Size - Type Segment 2019 - 2023 ($ million)
      • 5.5 Product Type segment analysis 2019 - 2023
        • Historic Market Size - Product Type Segment 2019 - 2023 ($ million)
      • 5.6 Geography segment analysis 2019 - 2023
        • Historic Market Size - Geography Segment 2019 - 2023 ($ million)
      • 5.7 Country segment analysis 2019 - 2023
        • Historic Market Size - Country Segment 2019 - 2023 ($ million)

      6 Qualitative Analysis

      • 6.1 Impact of AI on Global Offshore Oil and Gas Pipeline Market

        7 Five Forces Analysis

        • 7.1 Five forces summary
          • Five forces analysis - Comparison between 2024 and 2029
        • 7.2 Bargaining power of buyers
          • Bargaining power of buyers - Impact of key factors 2024 and 2029
        • 7.3 Bargaining power of suppliers
          • Bargaining power of suppliers - Impact of key factors in 2024 and 2029
        • 7.4 Threat of new entrants
          • Threat of new entrants - Impact of key factors in 2024 and 2029
        • 7.5 Threat of substitutes
          • Threat of substitutes - Impact of key factors in 2024 and 2029
        • 7.6 Threat of rivalry
          • Threat of rivalry - Impact of key factors in 2024 and 2029
        • 7.7 Market condition
          • Chart on Market condition - Five forces 2024 and 2029

        8 Market Segmentation by Sector

        • 8.1 Market segments
          • Chart on Sector - Market share 2024-2029 (%)
          • Data Table on Sector - Market share 2024-2029 (%)
        • 8.2 Comparison by Sector
          • Chart on Comparison by Sector
          • Data Table on Comparison by Sector
        • 8.3 Up stream - Market size and forecast 2024-2029
          • Chart on Up stream - Market size and forecast 2024-2029 ($ million)
          • Data Table on Up stream - Market size and forecast 2024-2029 ($ million)
          • Chart on Up stream - Year-over-year growth 2024-2029 (%)
          • Data Table on Up stream - Year-over-year growth 2024-2029 (%)
        • 8.4 Mid stream - Market size and forecast 2024-2029
          • Chart on Mid stream - Market size and forecast 2024-2029 ($ million)
          • Data Table on Mid stream - Market size and forecast 2024-2029 ($ million)
          • Chart on Mid stream - Year-over-year growth 2024-2029 (%)
          • Data Table on Mid stream - Year-over-year growth 2024-2029 (%)
        • 8.5 Down stream - Market size and forecast 2024-2029
          • Chart on Down stream - Market size and forecast 2024-2029 ($ million)
          • Data Table on Down stream - Market size and forecast 2024-2029 ($ million)
          • Chart on Down stream - Year-over-year growth 2024-2029 (%)
          • Data Table on Down stream - Year-over-year growth 2024-2029 (%)
        • 8.6 Market opportunity by Sector
          • Market opportunity by Sector ($ million)
          • Data Table on Market opportunity by Sector ($ million)

        9 Market Segmentation by Product

        • 9.1 Market segments
          • Chart on Product - Market share 2024-2029 (%)
          • Data Table on Product - Market share 2024-2029 (%)
        • 9.2 Comparison by Product
          • Chart on Comparison by Product
          • Data Table on Comparison by Product
        • 9.3 Oil - Market size and forecast 2024-2029
          • Chart on Oil - Market size and forecast 2024-2029 ($ million)
          • Data Table on Oil - Market size and forecast 2024-2029 ($ million)
          • Chart on Oil - Year-over-year growth 2024-2029 (%)
          • Data Table on Oil - Year-over-year growth 2024-2029 (%)
        • 9.4 Gas - Market size and forecast 2024-2029
          • Chart on Gas - Market size and forecast 2024-2029 ($ million)
          • Data Table on Gas - Market size and forecast 2024-2029 ($ million)
          • Chart on Gas - Year-over-year growth 2024-2029 (%)
          • Data Table on Gas - Year-over-year growth 2024-2029 (%)
        • 9.5 Refined products - Market size and forecast 2024-2029
          • Chart on Refined products - Market size and forecast 2024-2029 ($ million)
          • Data Table on Refined products - Market size and forecast 2024-2029 ($ million)
          • Chart on Refined products - Year-over-year growth 2024-2029 (%)
          • Data Table on Refined products - Year-over-year growth 2024-2029 (%)
        • 9.6 Market opportunity by Product
          • Market opportunity by Product ($ million)
          • Data Table on Market opportunity by Product ($ million)

        10 Market Segmentation by Type

        • 10.1 Market segments
          • Chart on Type - Market share 2024-2029 (%)
          • Data Table on Type - Market share 2024-2029 (%)
        • 10.2 Comparison by Type
          • Chart on Comparison by Type
          • Data Table on Comparison by Type
        • 10.3 Transport lines - Market size and forecast 2024-2029
          • Chart on Transport lines - Market size and forecast 2024-2029 ($ million)
          • Data Table on Transport lines - Market size and forecast 2024-2029 ($ million)
          • Chart on Transport lines - Year-over-year growth 2024-2029 (%)
          • Data Table on Transport lines - Year-over-year growth 2024-2029 (%)
        • 10.4 Export lines - Market size and forecast 2024-2029
          • Chart on Export lines - Market size and forecast 2024-2029 ($ million)
          • Data Table on Export lines - Market size and forecast 2024-2029 ($ million)
          • Chart on Export lines - Year-over-year growth 2024-2029 (%)
          • Data Table on Export lines - Year-over-year growth 2024-2029 (%)
        • 10.5 Others - Market size and forecast 2024-2029
          • Chart on Others - Market size and forecast 2024-2029 ($ million)
          • Data Table on Others - Market size and forecast 2024-2029 ($ million)
          • Chart on Others - Year-over-year growth 2024-2029 (%)
          • Data Table on Others - Year-over-year growth 2024-2029 (%)
        • 10.6 Market opportunity by Type
          • Market opportunity by Type ($ million)
          • Data Table on Market opportunity by Type ($ million)

        11 Market Segmentation by Product Type

        • 11.1 Market segments
          • Chart on Product Type - Market share 2024-2029 (%)
          • Data Table on Product Type - Market share 2024-2029 (%)
        • 11.2 Comparison by Product Type
          • Chart on Comparison by Product Type
          • Data Table on Comparison by Product Type
        • 11.3 Greater than 24 inches - Market size and forecast 2024-2029
          • Chart on Greater than 24 inches - Market size and forecast 2024-2029 ($ million)
          • Data Table on Greater than 24 inches - Market size and forecast 2024-2029 ($ million)
          • Chart on Greater than 24 inches - Year-over-year growth 2024-2029 (%)
          • Data Table on Greater than 24 inches - Year-over-year growth 2024-2029 (%)
        • 11.4 Below 24 inches - Market size and forecast 2024-2029
          • Chart on Below 24 inches - Market size and forecast 2024-2029 ($ million)
          • Data Table on Below 24 inches - Market size and forecast 2024-2029 ($ million)
          • Chart on Below 24 inches - Year-over-year growth 2024-2029 (%)
          • Data Table on Below 24 inches - Year-over-year growth 2024-2029 (%)
        • 11.5 Market opportunity by Product Type
          • Market opportunity by Product Type ($ million)
          • Data Table on Market opportunity by Product Type ($ million)

        12 Customer Landscape

        • 12.1 Customer landscape overview
          • Analysis of price sensitivity, lifecycle, customer purchase basket, adoption rates, and purchase criteria

        13 Geographic Landscape

        • 13.1 Geographic segmentation
          • Chart on Market share by geography 2024-2029 (%)
          • Data Table on Market share by geography 2024-2029 (%)
        • 13.2 Geographic comparison
          • Chart on Geographic comparison
          • Data Table on Geographic comparison
        • 13.3 Europe - Market size and forecast 2024-2029
          • Chart on Europe - Market size and forecast 2024-2029 ($ million)
          • Data Table on Europe - Market size and forecast 2024-2029 ($ million)
          • Chart on Europe - Year-over-year growth 2024-2029 (%)
          • Data Table on Europe - Year-over-year growth 2024-2029 (%)
        • 13.4 Middle East and Africa - Market size and forecast 2024-2029
          • Chart on Middle East and Africa - Market size and forecast 2024-2029 ($ million)
          • Data Table on Middle East and Africa - Market size and forecast 2024-2029 ($ million)
          • Chart on Middle East and Africa - Year-over-year growth 2024-2029 (%)
          • Data Table on Middle East and Africa - Year-over-year growth 2024-2029 (%)
        • 13.5 APAC - Market size and forecast 2024-2029
          • Chart on APAC - Market size and forecast 2024-2029 ($ million)
          • Data Table on APAC - Market size and forecast 2024-2029 ($ million)
          • Chart on APAC - Year-over-year growth 2024-2029 (%)
          • Data Table on APAC - Year-over-year growth 2024-2029 (%)
        • 13.6 South America - Market size and forecast 2024-2029
          • Chart on South America - Market size and forecast 2024-2029 ($ million)
          • Data Table on South America - Market size and forecast 2024-2029 ($ million)
          • Chart on South America - Year-over-year growth 2024-2029 (%)
          • Data Table on South America - Year-over-year growth 2024-2029 (%)
        • 13.7 North America - Market size and forecast 2024-2029
          • Chart on North America - Market size and forecast 2024-2029 ($ million)
          • Data Table on North America - Market size and forecast 2024-2029 ($ million)
          • Chart on North America - Year-over-year growth 2024-2029 (%)
          • Data Table on North America - Year-over-year growth 2024-2029 (%)
        • 13.8 Russia - Market size and forecast 2024-2029
          • Chart on Russia - Market size and forecast 2024-2029 ($ million)
          • Data Table on Russia - Market size and forecast 2024-2029 ($ million)
          • Chart on Russia - Year-over-year growth 2024-2029 (%)
          • Data Table on Russia - Year-over-year growth 2024-2029 (%)
        • 13.9 Turkey - Market size and forecast 2024-2029
          • Chart on Turkey - Market size and forecast 2024-2029 ($ million)
          • Data Table on Turkey - Market size and forecast 2024-2029 ($ million)
          • Chart on Turkey - Year-over-year growth 2024-2029 (%)
          • Data Table on Turkey - Year-over-year growth 2024-2029 (%)
        • 13.10 Norway - Market size and forecast 2024-2029
          • Chart on Norway - Market size and forecast 2024-2029 ($ million)
          • Data Table on Norway - Market size and forecast 2024-2029 ($ million)
          • Chart on Norway - Year-over-year growth 2024-2029 (%)
          • Data Table on Norway - Year-over-year growth 2024-2029 (%)
        • 13.11 Saudi Arabia - Market size and forecast 2024-2029
          • Chart on Saudi Arabia - Market size and forecast 2024-2029 ($ million)
          • Data Table on Saudi Arabia - Market size and forecast 2024-2029 ($ million)
          • Chart on Saudi Arabia - Year-over-year growth 2024-2029 (%)
          • Data Table on Saudi Arabia - Year-over-year growth 2024-2029 (%)
        • 13.12 China - Market size and forecast 2024-2029
          • Chart on China - Market size and forecast 2024-2029 ($ million)
          • Data Table on China - Market size and forecast 2024-2029 ($ million)
          • Chart on China - Year-over-year growth 2024-2029 (%)
          • Data Table on China - Year-over-year growth 2024-2029 (%)
        • 13.13 Italy - Market size and forecast 2024-2029
          • Chart on Italy - Market size and forecast 2024-2029 ($ million)
          • Data Table on Italy - Market size and forecast 2024-2029 ($ million)
          • Chart on Italy - Year-over-year growth 2024-2029 (%)
          • Data Table on Italy - Year-over-year growth 2024-2029 (%)
        • 13.14 UAE - Market size and forecast 2024-2029
          • Chart on UAE - Market size and forecast 2024-2029 ($ million)
          • Data Table on UAE - Market size and forecast 2024-2029 ($ million)
          • Chart on UAE - Year-over-year growth 2024-2029 (%)
          • Data Table on UAE - Year-over-year growth 2024-2029 (%)
        • 13.15 Spain - Market size and forecast 2024-2029
          • Chart on Spain - Market size and forecast 2024-2029 ($ million)
          • Data Table on Spain - Market size and forecast 2024-2029 ($ million)
          • Chart on Spain - Year-over-year growth 2024-2029 (%)
          • Data Table on Spain - Year-over-year growth 2024-2029 (%)
        • 13.16 Japan - Market size and forecast 2024-2029
          • Chart on Japan - Market size and forecast 2024-2029 ($ million)
          • Data Table on Japan - Market size and forecast 2024-2029 ($ million)
          • Chart on Japan - Year-over-year growth 2024-2029 (%)
          • Data Table on Japan - Year-over-year growth 2024-2029 (%)
        • 13.17 Brazil - Market size and forecast 2024-2029
          • Chart on Brazil - Market size and forecast 2024-2029 ($ million)
          • Data Table on Brazil - Market size and forecast 2024-2029 ($ million)
          • Chart on Brazil - Year-over-year growth 2024-2029 (%)
          • Data Table on Brazil - Year-over-year growth 2024-2029 (%)
        • 13.18 Market opportunity by geography
          • Market opportunity by geography ($ million)
          • Data Tables on Market opportunity by geography ($ million)

        14 Drivers, Challenges, and Opportunity/Restraints

        • 14.1 Market drivers
          • 14.2 Market challenges
            • 14.3 Impact of drivers and challenges
              • Impact of drivers and challenges in 2024 and 2029
            • 14.4 Market opportunities/restraints

              15 Competitive Landscape

              • 15.1 Overview
                • 15.2 Competitive Landscape
                  • Overview on criticality of inputs and factors of differentiation
                • 15.3 Landscape disruption
                  • Overview on factors of disruption
                • 15.4 Industry risks
                  • Impact of key risks on business

                16 Competitive Analysis

                • 16.1 Companies profiled
                  • Companies covered
                • 16.2 Company ranking index
                  • Company ranking index
                • 16.3 Market positioning of companies
                  • Matrix on companies position and classification
                • 16.4 Allseas Group SA
                  • Allseas Group SA - Overview
                  • Allseas Group SA - Product / Service
                  • Allseas Group SA - Key offerings
                  • SWOT
                • 16.5 ArcelorMittal SA
                  • ArcelorMittal SA - Overview
                  • ArcelorMittal SA - Business segments
                  • ArcelorMittal SA - Key news
                  • ArcelorMittal SA - Key offerings
                  • ArcelorMittal SA - Segment focus
                  • SWOT
                • 16.6 Atteris Pty. Ltd.
                  • Atteris Pty. Ltd. - Overview
                  • Atteris Pty. Ltd. - Product / Service
                  • Atteris Pty. Ltd. - Key offerings
                  • SWOT
                • 16.7 Fugro NV
                  • Fugro NV - Overview
                  • Fugro NV - Business segments
                  • Fugro NV - Key offerings
                  • Fugro NV - Segment focus
                  • SWOT
                • 16.8 JFE Holdings Inc.
                  • JFE Holdings Inc. - Overview
                  • JFE Holdings Inc. - Business segments
                  • JFE Holdings Inc. - Key news
                  • JFE Holdings Inc. - Key offerings
                  • JFE Holdings Inc. - Segment focus
                  • SWOT
                • 16.9 John Wood Group PLC
                  • John Wood Group PLC - Overview
                  • John Wood Group PLC - Business segments
                  • John Wood Group PLC - Key offerings
                  • John Wood Group PLC - Segment focus
                  • SWOT
                • 16.10 Larsen and Toubro Ltd.
                  • Larsen and Toubro Ltd. - Overview
                  • Larsen and Toubro Ltd. - Business segments
                  • Larsen and Toubro Ltd. - Key news
                  • Larsen and Toubro Ltd. - Key offerings
                  • Larsen and Toubro Ltd. - Segment focus
                  • SWOT
                • 16.11 McDermott International Ltd.
                  • McDermott International Ltd. - Overview
                  • McDermott International Ltd. - Product / Service
                  • McDermott International Ltd. - Key offerings
                  • SWOT
                • 16.12 National Petroleum Construction Co.
                  • National Petroleum Construction Co. - Overview
                  • National Petroleum Construction Co. - Product / Service
                  • National Petroleum Construction Co. - Key offerings
                  • SWOT
                • 16.13 Nippon Steel Corp.
                  • Nippon Steel Corp. - Overview
                  • Nippon Steel Corp. - Business segments
                  • Nippon Steel Corp. - Key news
                  • Nippon Steel Corp. - Key offerings
                  • Nippon Steel Corp. - Segment focus
                  • SWOT
                • 16.14 PAO Severstal
                  • PAO Severstal - Overview
                  • PAO Severstal - Business segments
                  • PAO Severstal - Key offerings
                  • PAO Severstal - Segment focus
                  • SWOT
                • 16.15 Saipem S.p.A.
                  • Saipem S.p.A. - Overview
                  • Saipem S.p.A. - Business segments
                  • Saipem S.p.A. - Key offerings
                  • Saipem S.p.A. - Segment focus
                  • SWOT
                • 16.16 Salzgitter AG
                  • Salzgitter AG - Overview
                  • Salzgitter AG - Business segments
                  • Salzgitter AG - Key offerings
                  • Salzgitter AG - Segment focus
                  • SWOT
                • 16.17 Tenaris SA
                  • Tenaris SA - Overview
                  • Tenaris SA - Product / Service
                  • Tenaris SA - Key news
                  • Tenaris SA - Key offerings
                  • SWOT
                • 16.18 TMK
                  • TMK - Overview
                  • TMK - Product / Service
                  • TMK - Key offerings
                  • SWOT

                17 Appendix

                • 17.1 Scope of the report
                  • 17.2 Inclusions and exclusions checklist
                    • Inclusions checklist
                    • Exclusions checklist
                  • 17.3 Currency conversion rates for US$
                    • Currency conversion rates for US$
                  • 17.4 Research methodology
                    • Research methodology
                  • 17.5 Data procurement
                    • Information sources
                  • 17.6 Data validation
                    • Data validation
                  • 17.7 Validation techniques employed for market sizing
                    • Validation techniques employed for market sizing
                  • 17.8 Data synthesis
                    • Data synthesis
                  • 17.9 360 degree market analysis
                    • 360 degree market analysis
                  • 17.10 List of abbreviations
                    • List of abbreviations

                  Research Methodology

                  Technavio presents a detailed picture of the market by way of study, synthesis, and summation of data from multiple sources. The analysts have presented the various facets of the market with a particular focus on identifying the key industry influencers. The data thus presented is comprehensive, reliable, and the result of extensive research, both primary and secondary.

                  INFORMATION SOURCES

                  Primary sources

                  • Manufacturers and suppliers
                  • Channel partners
                  • Industry experts
                  • Strategic decision makers

                  Secondary sources

                  • Industry journals and periodicals
                  • Government data
                  • Financial reports of key industry players
                  • Historical data
                  • Press releases

                  DATA ANALYSIS

                  Data Synthesis

                  • Collation of data
                  • Estimation of key figures
                  • Analysis of derived insights

                  Data Validation

                  • Triangulation with data models
                  • Reference against proprietary databases
                  • Corroboration with industry experts

                  REPORT WRITING

                  Qualitative

                  • Market drivers
                  • Market challenges
                  • Market trends
                  • Five forces analysis

                  Quantitative

                  • Market size and forecast
                  • Market segmentation
                  • Geographical insights
                  • Competitive landscape

                  Interested in this report?

                  Get your sample now to see our research methodology and insights!

                  Download Now

                  Frequently Asked Questions

                  Offshore Oil And Gas Pipeline market growth will increase by $ 4455.8 mn during 2025-2029.

                  The Offshore Oil And Gas Pipeline market is expected to grow at a CAGR of 5.7% during 2025-2029.

                  Offshore Oil And Gas Pipeline market is segmented by Sector( Up stream, Mid stream, Down stream) Product( Oil, Gas, Refined products, South America, North America) Type( Transport lines, Export lines, Others, South America, North America)

                  Allseas Group SA, ArcelorMittal SA, Atteris Pty. Ltd., Fugro NV, JFE Holdings Inc., John Wood Group PLC, Larsen and Toubro Ltd., McDermott International Ltd., National Petroleum Construction Co., Nippon Steel Corp., PAO Severstal, Saipem S.p.A., Salzgitter AG, Sapura Energy Berhad, Shengli Oil and Gas Pipe Holdings Ltd., Subsea 7 SA, TechnipFMC plc, Tenaris SA, TMK, United Metallurgical Co. are a few of the key vendors in the Offshore Oil And Gas Pipeline market.

                  Europe will register the highest growth rate of 50% among the other regions. Therefore, the Offshore Oil And Gas Pipeline market in Europe is expected to garner significant business opportunities for the vendors during the forecast period.

                  Russia, Norway, Turkey, Saudi Arabia, China, Italy, UAE, Spain, Brazil, Japan

                  • Economic benefits of offshore pipelines than other oil and gas transportation modesThe objective of offshore oil and gas pipelines is the transportation of crude oil is the driving factor this market.
                  • natural gas is the driving factor this market.
                  • and petroleum products to the desired destination. The destinations are mostly located close to consumption centers. Other modes of oil and gas transportation include marine vessels such as crude oil tankers and gas carriers. Offshore pipelines is the driving factor this market.
                  • however is the driving factor this market.
                  • are preferred to other modes for long-distance offshore transportation of oil and gas. Some of the reasons for the preference for offshore pipelines over other modes of transportation are as follows:Offshore pipelines require significantly less energy and have a low carbon footprint.Since the operation and maintenance cost of offshore pipelines is low is the driving factor this market.
                  • pipelines are more economical than other transportation modes.Offshore pipelines are highly reliable and can operate day and night as there is limited dependence on external factors. This ensures an uninterrupted supply of large volumes of oil and gas is the driving factor this market.
                  • which is crucial for some industries is the driving factor this market.
                  • such as gas-fired power generation. Continuous supply will require fewer oil and gas storage facilities at consumption centers.Offshore pipelines can be laid in most types of offshore terrains. They are useful when oil and gas production and consumption centers are separated by a water body. Offshore pipelines in such places are economical for regular supply. Other transportation modes include marine tankers. If these tankers are used for large-volume is the driving factor this market.
                  • regular supply is the driving factor this market.
                  • the cost will be high due to the frequent voyage of tankers between production and consumption centers.Companies are venturing into new projects because of the increasing oil and gas E and P activities. The transportation of oil and gas through ships is cost-intensive and requires frequent trips. Thus is the driving factor this market.
                  • considering investments involved in oil and gas E and P projects is the driving factor this market.
                  • oil and gas companies prefer cost-effective modes of transportation. Oil and gas can be transported continuously via pipelines or can be shut down at any time in case of an emergency or issue.The economic benefits of offshore pipelines over other modes will drive the growth of the global offshore oil and gas pipeline market during the forecast period. is the driving factor this market.

                  The Offshore Oil And Gas Pipeline market vendors should focus on grabbing business opportunities from the Up stream segment as it accounted for the largest market share in the base year.