Offshore Oil And Gas Communications Market Analysis, Size, and Forecast 2026-2030: North America (US, Canada, and Mexico), Middle East and Africa (Saudi Arabia, UAE, and South Africa), APAC (China, Australia, and Japan), South America (Brazil and Argentina), Europe (UK, France, and The Netherlands), and Rest of World (ROW)

Offshore Oil And Gas Communications Market Analysis, Size, and Forecast 2026-2030:
North America (US, Canada, and Mexico), Middle East and Africa (Saudi Arabia, UAE, and South Africa), APAC (China, Australia, and Japan), South America (Brazil and Argentina), Europe (UK, France, and The Netherlands), and Rest of World (ROW)

Published: Jan 2026 309 Pages SKU: IRTNTR72669

Market Overview at a Glance

$2.17 B
Market Opportunity
8.8%
CAGR 2025 - 2030
47.3%
North America Growth
$2.51 B
Upstream segment 2024

Offshore Oil And Gas Communications Market Size 2026-2030

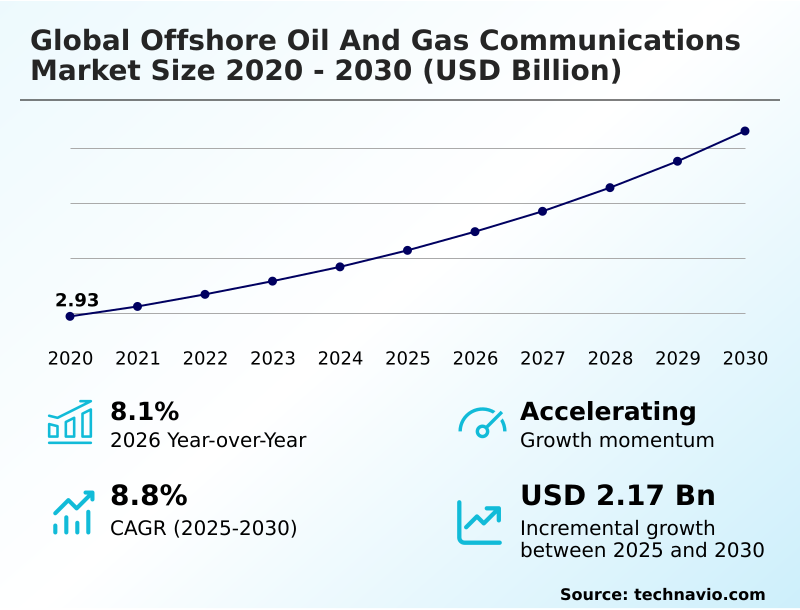
The offshore oil and gas communications market size is valued to increase by USD 2.17 billion, at a CAGR of 8.8% from 2025 to 2030. Increasing investments in enhancing network infrastructure will drive the offshore oil and gas communications market.

Major Market Trends & Insights

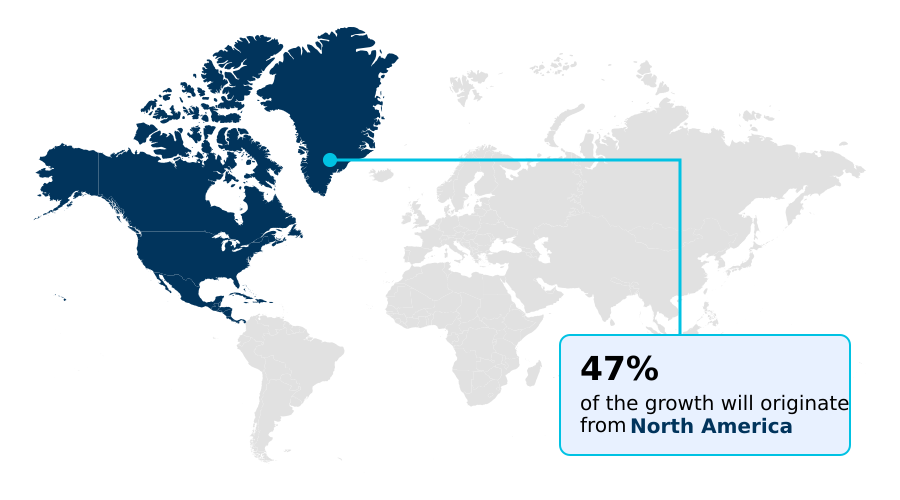
  • North America dominated the market and accounted for a 47.3% growth during the forecast period.
  • By Application - Upstream segment was valued at USD 2.51 billion in 2024
  • By Technology - VSAT communication network segment accounted for the largest market revenue share in 2024

Market Size & Forecast

  • Market Opportunities: USD 3.38 billion
  • Market Future Opportunities: USD 2.17 billion
  • CAGR from 2025 to 2030 : 8.8%

Market Summary

  • The Offshore Oil And Gas Communications Market centers on providing advanced, reliable connectivity solutions engineered for harsh and remote operational environments. The industry is evolving beyond basic voice services to support high-bandwidth, real-time data transmission essential for remote asset monitoring and predictive maintenance analytics.
  • A primary driver is the pursuit of operational efficiency and heightened safety standards, which accelerates the adoption of the Industrial Internet of Things (IIoT) and digital twin integration.
  • Consequently, a key trend is the deployment of hybrid network solutions that combine low earth orbit constellations with traditional geostationary earth orbit satellites and private LTE networks to create a resilient network architecture. However, this increased connectivity introduces significant challenges related to operational technology (OT) security.
  • For instance, a unified offshore platform connectivity solution enables an operator to analyze data from subsea equipment in real-time, preventing costly failures and scheduling maintenance proactively, but it also requires robust cybersecurity protocols to protect critical control systems from external threats.

What will be the Size of the Offshore Oil And Gas Communications Market during the forecast period?

Get Key Insights on Market Forecast (PDF) Request Free Sample

How is the Offshore Oil And Gas Communications Market Segmented?

The offshore oil and gas communications industry research report provides comprehensive data (region-wise segment analysis), with forecasts and estimates in "USD million" for the period 2026-2030, as well as historical data from 2020-2024 for the following segments.
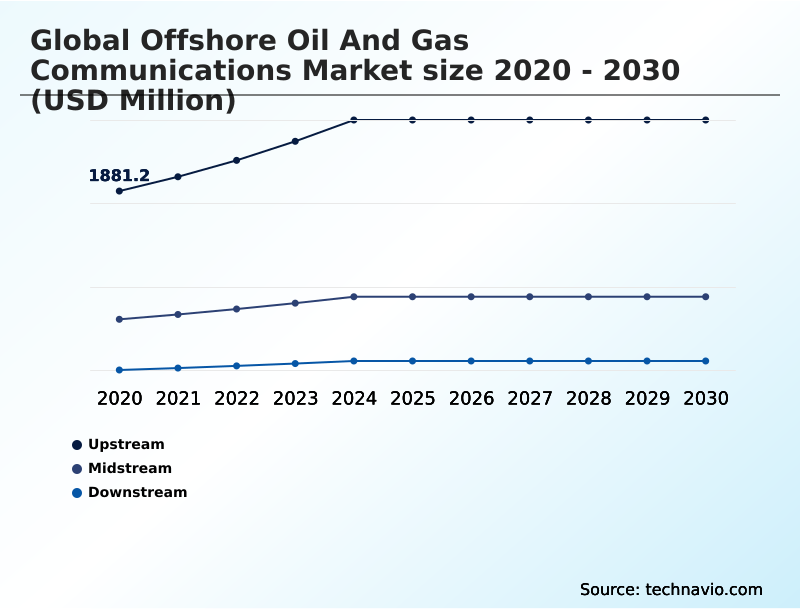
  • Application
    • Upstream
    • Midstream
    • Downstream
  • Technology
    • VSAT communication network
    • Fiber optic-based communication network
    • Cellular communication network
    • Microwave communication network
  • Type
    • Antennas
    • Transmitters
    • Receivers
    • Modems
    • Routers
  • Geography
    • North America
      • US
      • Canada
      • Mexico
    • Middle East and Africa
      • Saudi Arabia
      • UAE
      • South Africa
    • APAC
      • China
      • Australia
      • Japan
    • South America
      • Brazil
      • Argentina
    • Europe
      • UK
      • France
      • The Netherlands
    • Rest of World (ROW)

By Application Insights

The upstream segment is estimated to witness significant growth during the forecast period.

The upstream segment, encompassing exploration and production, is fundamentally reliant on high-performance communications. Activities in this segment depend on robust subsea communication systems for real-time data transmission and telemetry and control systems to manage complex drilling rig data links.

The integration of the industrial internet of things and smart field technologies facilitates data-driven decision making, especially with the high-bandwidth data transfer required for seismic data transmission.

Effective operational continuity planning is essential, with modern networks enabling a reduction in non-productive time by over 15% through enhanced monitoring and analytics.

This capability underscores the shift toward highly digitized upstream operations where connectivity directly influences efficiency and safety outcomes in harsh offshore environments.

Request Free Sample

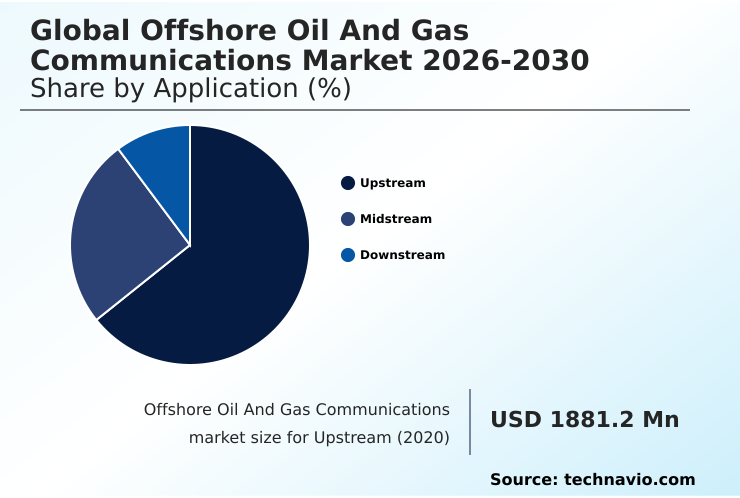
The Upstream segment was valued at USD 2.51 billion in 2024 and showed a gradual increase during the forecast period.

Request Free Sample

Regional Analysis

North America is estimated to contribute 47.3% to the growth of the global market during the forecast period.Technavio’s analysts have elaborately explained the regional trends and drivers that shape the market during the forecast period.

See How Offshore Oil And Gas Communications Market Demand is Rising in North America Request Free Sample

The market's geographic landscape is led by North America, which is poised to contribute nearly half of the global incremental growth, driven by mature offshore energy communications in the Gulf of Mexico.

The region's rapid adoption of private 5G networks for offshore platform connectivity has reduced latency for remote diagnostics and support by up to 70% compared to legacy systems.

High-throughput satellite services are expanding, although access varies globally, with low earth orbit constellations beginning to augment traditional geostationary earth orbit satellites.

The Middle East and Africa represent a significant growth area, while the deployment of maritime broadband solutions and cellular communication networks in APAC supports new asset development.

Remote operations centers increasingly rely on these advanced networks for functions like video surveillance over satellite, centralizing control and improving response times.

Market Dynamics

Our researchers analyzed the data with 2025 as the base year, along with the key drivers, trends, and challenges. A holistic analysis of drivers will help companies refine their marketing strategies to gain a competitive advantage.

  • Strategic decisions in the offshore sector are increasingly influenced by the total cost of satellite bandwidth for offshore rigs, spurring interest in private 5G network deployment for oil platforms. This technological shift elevates the importance of cybersecurity for offshore operational technology.
  • A key strategy involves integrating LEO and GEO satellite services to balance cost and performance, supporting the demand for real-time drilling data communication solutions and comprehensive IIoT connectivity for remote offshore assets. These networks are also vital for improving crew welfare with high-speed internet.
  • The technical debate over VSAT vs fiber for offshore platform backhaul continues, particularly as the need for low latency communication for autonomous drilling grows. Ensuring secure communication protocols for subsea equipment and efficiently managing data from multiple offshore sensors are critical operational tasks.
  • A well-defined remote operation center communication architecture is proven to resolve critical issues twice as fast as siloed systems. These architectures must incorporate robust emergency communication systems for offshore facilities and accommodate future digital twin communication requirements for rigs, with an expanding scope that now includes offshore wind farm communication infrastructure.

What are the key market drivers leading to the rise in the adoption of Offshore Oil And Gas Communications Industry?

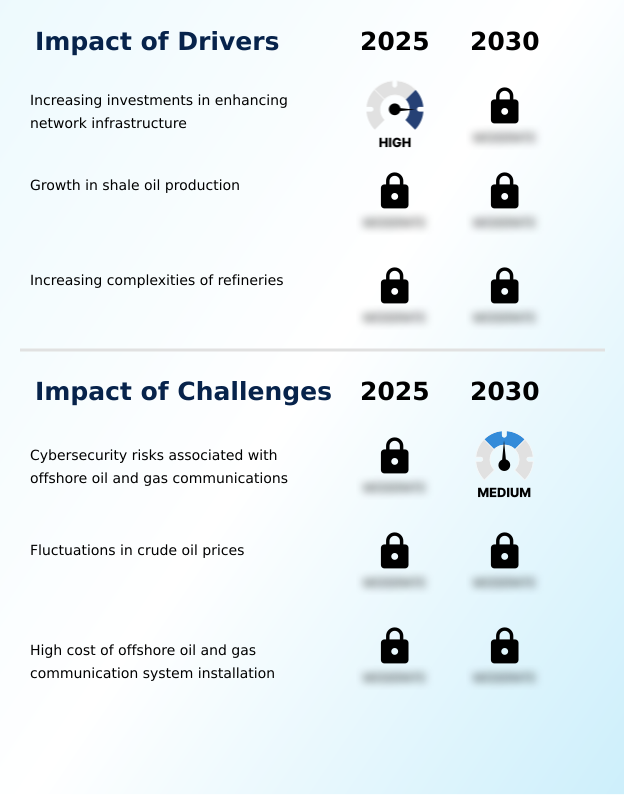
  • Sustained increases in investments aimed at enhancing network infrastructure to support faster, more reliable, and secure connectivity across offshore assets is a key driver for market growth.

  • Market growth is driven by investments in building a resilient network architecture capable of supporting data-intensive applications.
  • The expansion of IoT sensor networks and the deployment of fiber optic-based communication network and microwave communication network infrastructure are crucial for enabling automated operational reporting and environmental monitoring data collection.
  • Modernizing to include network redundancy protocols and software-defined networking can increase data capacity by over 300%. These upgrades also enhance mission-critical voice services and public safety communications, while network function virtualization helps streamline asset tracking and management.
  • Adopting such infrastructure has been shown to automate up to 40% of manual compliance reporting tasks.

What are the market trends shaping the Offshore Oil And Gas Communications Industry?

  • The digitalization of oilfield communications is a prominent trend reshaping the market, driven by the need for real-time data exchange and improved operational safety in remote environments.

  • Key market trends are centered on the digital oilfield framework, where digital twin integration and IIoT connectivity are paramount. This shift enables advanced predictive maintenance analytics and supports autonomous vessel communication by leveraging low-latency connectivity and edge computing solutions for real-time operational data analytics. The adoption of ultra-reliable low-latency communication has reduced remote intervention times by over 50%.
  • Furthermore, hybrid network solutions are improving the performance of FPSO communication systems, with some deployments increasing data throughput for connected worker solutions by over 200%. This move toward massive machine-type communications creates intelligent ecosystems that enhance safety and efficiency across offshore operations.

What challenges does the Offshore Oil And Gas Communications Industry face during its growth?

  • Cybersecurity risks associated with the rapid digitalization of offshore operational systems present a critical challenge to the industry's growth and operational integrity.

  • The primary challenge is ensuring operational technology security in an increasingly connected environment, where cyber-physical systems security is critical. The integration of previously isolated systems, such as SCADA system integration with corporate networks, expands the attack surface for the entire VSAT communication network. Establishing secure remote access and protecting secure industrial control systems from threats are major concerns.
  • A breach can disrupt not only remote asset monitoring but also vital emergency response systems and secure voice communication. Advanced maritime VSAT antennas and unified communications platforms must incorporate robust security, as a single cyber incident can halt operations, with downtime costs exceeding several million dollars per day.

Exclusive Technavio Analysis on Customer Landscape

The offshore oil and gas communications market forecasting report includes the adoption lifecycle of the market, covering from the innovator’s stage to the laggard’s stage. It focuses on adoption rates in different regions based on penetration. Furthermore, the offshore oil and gas communications market report also includes key purchase criteria and drivers of price sensitivity to help companies evaluate and develop their market growth analysis strategies.

Customer Landscape of Offshore Oil And Gas Communications Industry

Competitive Landscape

Companies are implementing various strategies, such as strategic alliances, offshore oil and gas communications market forecast, partnerships, mergers and acquisitions, geographical expansion, and product/service launches, to enhance their presence in the industry.

ABB Ltd. - Key offerings focus on integrated communication systems that enhance operational safety and data throughput for remote, high-stakes offshore energy exploration and production activities.

The industry research and growth report includes detailed analyses of the competitive landscape of the market and information about key companies, including:

  • ABB Ltd.
  • AT and T Inc.
  • Aviat Networks Inc.
  • Baker Hughes Co.
  • Ceragon Networks Ltd.
  • CommScope Inc.
  • EchoStar Corp.
  • GE Vernova Inc.
  • Hitachi Ltd.
  • Honeywell International Inc.
  • Huawei Technologies Co. Ltd.
  • Iridium Communications Inc.
  • PTC Inc.
  • Siemens AG
  • Speedcast
  • Viasat Inc.

Qualitative and quantitative analysis of companies has been conducted to help clients understand the wider business environment as well as the strengths and weaknesses of key industry players. Data is qualitatively analyzed to categorize companies as pure play, category-focused, industry-focused, and diversified; it is quantitatively analyzed to categorize companies as dominant, leading, strong, tentative, and weak.

Recent Development and News in Offshore oil and gas communications market

  • In March, 2025, SES company announced a partnership with Lynk Global to advance direct-to-device satellite connectivity, integrating Low Earth Orbit satellite services to support devices in remote regions without traditional terrestrial coverage.
  • In March, 2025, Taara company, which spun out from Alphabet X labs, began to commercialize free-space optical communication systems capable of delivering multi-gigabit per second throughput for line-of-sight applications.
  • In April, 2025, SK Telecom, a major South Korean telecommunications provider, experienced a cyberattack and data breach that compromised sensitive USIM data, highlighting the vulnerability of network providers supplying critical connectivity to industrial operations.
  • In July, 2025, SES company completed its acquisition of Intelsat, consolidating satellite capacity to create a broader multi-orbit communications platform for next-generation IoT and broadband requirements in the energy and maritime sectors.

Dive into Technavio’s robust research methodology, blending expert interviews, extensive data synthesis, and validated models for unparalleled Offshore Oil And Gas Communications Market insights. See full methodology.

Market Scope
Page number 309
Base year 2025
Historic period 2020-2024
Forecast period 2026-2030
Growth momentum & CAGR Accelerate at a CAGR of 8.8%
Market growth 2026-2030 USD 2169.4 million
Market structure Fragmented
YoY growth 2025-2026(%) 8.1%
Key countries US, Canada, Mexico, Saudi Arabia, UAE, South Africa, Turkey, Israel, China, Australia, Japan, India, South Korea, Indonesia, Brazil, Argentina, Chile, UK, France, The Netherlands, Germany, Italy and Spain
Competitive landscape Leading Companies, Market Positioning of Companies, Competitive Strategies, and Industry Risks

Request Free Sample

Research Analyst Overview

  • The offshore oil and gas communications market is defined by its role in delivering mission-critical connectivity through a mix of VSAT communication network, fiber optic-based communication network, and emerging private 5G networks.
  • The convergence of IT with operational technology, driven by digital twin integration and the industrial internet of things (IIoT), is forcing boardroom-level reassessments of cybersecurity investments to protect vital operational technology security. Firms implementing software-defined networking for their resilient network architecture have achieved network provisioning times over 50% faster than with legacy hardware.
  • This evolution supports sophisticated applications ranging from real-time data transmission for predictive maintenance analytics to secure voice communication for crew welfare broadband. Systems are becoming more complex, integrating everything from drilling rig data links and FPSO communication systems to subsea communication systems, all managed through unified platforms to ensure seamless offshore platform connectivity and operational integrity.

What are the Key Data Covered in this Offshore Oil And Gas Communications Market Research and Growth Report?

  • What is the expected growth of the Offshore Oil And Gas Communications Market between 2026 and 2030?

    • USD 2.17 billion, at a CAGR of 8.8%

  • What segmentation does the market report cover?

    • The report is segmented by Application (Upstream, Midstream, and Downstream), Technology (VSAT communication network, Fiber optic-based communication network, Cellular communication network, and Microwave communication network), Type (Antennas, Transmitters, Receivers, Modems, and Routers) and Geography (North America, Middle East and Africa, APAC, South America, Europe)

  • Which regions are analyzed in the report?

    • North America, Middle East and Africa, APAC, South America and Europe

  • What are the key growth drivers and market challenges?

    • Increasing investments in enhancing network infrastructure, Cybersecurity risks associated with offshore oil and gas communications

  • Who are the major players in the Offshore Oil And Gas Communications Market?

    • ABB Ltd., AT and T Inc., Aviat Networks Inc., Baker Hughes Co., Ceragon Networks Ltd., CommScope Inc., EchoStar Corp., GE Vernova Inc., Hitachi Ltd., Honeywell International Inc., Huawei Technologies Co. Ltd., Iridium Communications Inc., PTC Inc., Siemens AG, Speedcast and Viasat Inc.

Market Research Insights

  • Market dynamics are shaped by the strategic imperative for high-bandwidth data transfer to power operational data analytics and enable data-driven decision making. Unified communications platforms are becoming standard for integrated marine communication, enhancing collaboration and enabling services like telemedicine for offshore crew, which has been shown to reduce unnecessary medical evacuations by over 20%.
  • The implementation of industrial wireless networking for asset tracking and management can improve equipment utilization by up to 15%. This pivot towards sophisticated connectivity supports advanced remote diagnostics and support, reinforcing the link between modern communication infrastructure and measurable improvements in operational efficiency and safety across maritime and energy assets.

We can help! Our analysts can customize this offshore oil and gas communications market research report to meet your requirements.

Get in touch

1. Executive Summary

1.1 Market overview

Executive Summary - Chart on Market Overview
Executive Summary - Data Table on Market Overview
Executive Summary - Chart on Global Market Characteristics
Executive Summary - Chart on Market by Geography
Executive Summary - Chart on Market Segmentation by Application
Executive Summary - Chart on Market Segmentation by Technology
Executive Summary - Chart on Market Segmentation by Type
Executive Summary - Chart on Incremental Growth
Executive Summary - Data Table on Incremental Growth
Executive Summary - Chart on Company Market Positioning

2. Technavio Analysis

2.1 Analysis of price sensitivity, lifecycle, customer purchase basket, adoption rates, and purchase criteria

2.2 Criticality of inputs and Factors of differentiation

Chart on Overview on criticality of inputs and factors of differentiation

2.3 Factors of disruption

Chart on Overview on factors of disruption

2.4 Impact of drivers and challenges

Chart on Impact of drivers and challenges in 2025 and 2030

3. Market Landscape

3.1 Market ecosystem

Chart on Parent Market
Data Table on - Parent Market

3.2 Market characteristics

Chart on Market characteristics analysis

3.3 Value chain analysis

Chart on Value chain analysis

4. Market Sizing

4.1 Market definition

Data Table on Offerings of companies included in the market definition

4.2 Market segment analysis

Market segments

4.3 Market size 2025

4.4 Market outlook: Forecast for 2025-2030

Chart on Global - Market size and forecast 2025-2030 ($ million)
Data Table on Global - Market size and forecast 2025-2030 ($ million)
Chart on Global Market: Year-over-year growth 2025-2030 (%)
Data Table on Global Market: Year-over-year growth 2025-2030 (%)

5. Historic Market Size

5.1 Global Offshore Oil And Gas Communications Market 2020 - 2024

Historic Market Size - Data Table on Global Offshore Oil And Gas Communications Market 2020 - 2024 ($ million)

5.2 Application segment analysis 2020 - 2024

Historic Market Size - Application Segment 2020 - 2024 ($ million)

5.3 Technology segment analysis 2020 - 2024

Historic Market Size - Technology Segment 2020 - 2024 ($ million)

5.4 Type segment analysis 2020 - 2024

Historic Market Size - Type Segment 2020 - 2024 ($ million)

5.5 Geography segment analysis 2020 - 2024

Historic Market Size - Geography Segment 2020 - 2024 ($ million)

5.6 Country segment analysis 2020 - 2024

Historic Market Size - Country Segment 2020 - 2024 ($ million)

6. Qualitative Analysis

6.1 Impact of AI on Global Offshore Oil and Gas Communications Market

7. Five Forces Analysis

7.1 Five forces summary

Five forces analysis - Comparison between 2025 and 2030

7.2 Bargaining power of buyers

Bargaining power of buyers - Impact of key factors 2025 and 2030

7.3 Bargaining power of suppliers

Bargaining power of suppliers - Impact of key factors in 2025 and 2030

7.4 Threat of new entrants

Threat of new entrants - Impact of key factors in 2025 and 2030

7.5 Threat of substitutes

Threat of substitutes - Impact of key factors in 2025 and 2030

7.6 Threat of rivalry

Threat of rivalry - Impact of key factors in 2025 and 2030

7.7 Market condition

Chart on Market condition - Five forces 2025 and 2030

8. Market Segmentation by Application

8.1 Market segments

Chart on Application - Market share 2025-2030 (%)
Data Table on Application - Market share 2025-2030 (%)

8.2 Comparison by Application

Chart on Comparison by Application
Data Table on Comparison by Application

8.3 Upstream - Market size and forecast 2025-2030

Chart on Upstream - Market size and forecast 2025-2030 ($ million)
Data Table on Upstream - Market size and forecast 2025-2030 ($ million)
Chart on Upstream - Year-over-year growth 2025-2030 (%)
Data Table on Upstream - Year-over-year growth 2025-2030 (%)

8.4 Midstream - Market size and forecast 2025-2030

Chart on Midstream - Market size and forecast 2025-2030 ($ million)
Data Table on Midstream - Market size and forecast 2025-2030 ($ million)
Chart on Midstream - Year-over-year growth 2025-2030 (%)
Data Table on Midstream - Year-over-year growth 2025-2030 (%)

8.5 Downstream - Market size and forecast 2025-2030

Chart on Downstream - Market size and forecast 2025-2030 ($ million)
Data Table on Downstream - Market size and forecast 2025-2030 ($ million)
Chart on Downstream - Year-over-year growth 2025-2030 (%)
Data Table on Downstream - Year-over-year growth 2025-2030 (%)

8.6 Market opportunity by Application

Market opportunity by Application ($ million)
Data Table on Market opportunity by Application ($ million)

9. Market Segmentation by Technology

9.1 Market segments

Chart on Technology - Market share 2025-2030 (%)
Data Table on Technology - Market share 2025-2030 (%)

9.2 Comparison by Technology

Chart on Comparison by Technology
Data Table on Comparison by Technology

9.3 VSAT communication network - Market size and forecast 2025-2030

Chart on VSAT communication network - Market size and forecast 2025-2030 ($ million)
Data Table on VSAT communication network - Market size and forecast 2025-2030 ($ million)
Chart on VSAT communication network - Year-over-year growth 2025-2030 (%)
Data Table on VSAT communication network - Year-over-year growth 2025-2030 (%)

9.4 Fiber optic-based communication network - Market size and forecast 2025-2030

Chart on Fiber optic-based communication network - Market size and forecast 2025-2030 ($ million)
Data Table on Fiber optic-based communication network - Market size and forecast 2025-2030 ($ million)
Chart on Fiber optic-based communication network - Year-over-year growth 2025-2030 (%)
Data Table on Fiber optic-based communication network - Year-over-year growth 2025-2030 (%)

9.5 Cellular communication network - Market size and forecast 2025-2030

Chart on Cellular communication network - Market size and forecast 2025-2030 ($ million)
Data Table on Cellular communication network - Market size and forecast 2025-2030 ($ million)
Chart on Cellular communication network - Year-over-year growth 2025-2030 (%)
Data Table on Cellular communication network - Year-over-year growth 2025-2030 (%)

9.6 Microwave communication network - Market size and forecast 2025-2030

Chart on Microwave communication network - Market size and forecast 2025-2030 ($ million)
Data Table on Microwave communication network - Market size and forecast 2025-2030 ($ million)
Chart on Microwave communication network - Year-over-year growth 2025-2030 (%)
Data Table on Microwave communication network - Year-over-year growth 2025-2030 (%)

9.7 Market opportunity by Technology

Market opportunity by Technology ($ million)
Data Table on Market opportunity by Technology ($ million)

10. Market Segmentation by Type

10.1 Market segments

Chart on Type - Market share 2025-2030 (%)
Data Table on Type - Market share 2025-2030 (%)

10.2 Comparison by Type

Chart on Comparison by Type
Data Table on Comparison by Type

10.3 Antennas - Market size and forecast 2025-2030

Chart on Antennas - Market size and forecast 2025-2030 ($ million)
Data Table on Antennas - Market size and forecast 2025-2030 ($ million)
Chart on Antennas - Year-over-year growth 2025-2030 (%)
Data Table on Antennas - Year-over-year growth 2025-2030 (%)

10.4 Transmitters - Market size and forecast 2025-2030

Chart on Transmitters - Market size and forecast 2025-2030 ($ million)
Data Table on Transmitters - Market size and forecast 2025-2030 ($ million)
Chart on Transmitters - Year-over-year growth 2025-2030 (%)
Data Table on Transmitters - Year-over-year growth 2025-2030 (%)

10.5 Receivers - Market size and forecast 2025-2030

Chart on Receivers - Market size and forecast 2025-2030 ($ million)
Data Table on Receivers - Market size and forecast 2025-2030 ($ million)
Chart on Receivers - Year-over-year growth 2025-2030 (%)
Data Table on Receivers - Year-over-year growth 2025-2030 (%)

10.6 Modems - Market size and forecast 2025-2030

Chart on Modems - Market size and forecast 2025-2030 ($ million)
Data Table on Modems - Market size and forecast 2025-2030 ($ million)
Chart on Modems - Year-over-year growth 2025-2030 (%)
Data Table on Modems - Year-over-year growth 2025-2030 (%)

10.7 Routers - Market size and forecast 2025-2030

Chart on Routers - Market size and forecast 2025-2030 ($ million)
Data Table on Routers - Market size and forecast 2025-2030 ($ million)
Chart on Routers - Year-over-year growth 2025-2030 (%)
Data Table on Routers - Year-over-year growth 2025-2030 (%)

10.8 Market opportunity by Type

Market opportunity by Type ($ million)
Data Table on Market opportunity by Type ($ million)

11. Customer Landscape

11.1 Customer landscape overview

Analysis of price sensitivity, lifecycle, customer purchase basket, adoption rates, and purchase criteria

12. Geographic Landscape

12.1 Geographic segmentation

Chart on Market share by geography 2025-2030 (%)
Data Table on Market share by geography 2025-2030 (%)

12.2 Geographic comparison

Chart on Geographic comparison
Data Table on Geographic comparison

12.3 North America - Market size and forecast 2025-2030

Chart on North America - Market size and forecast 2025-2030 ($ million)
Data Table on North America - Market size and forecast 2025-2030 ($ million)
Chart on North America - Year-over-year growth 2025-2030 (%)
Data Table on North America - Year-over-year growth 2025-2030 (%)
Chart on Regional Comparison - North America
Data Table on Regional Comparison - North America

12.3.1 US - Market size and forecast 2025-2030

Chart on US - Market size and forecast 2025-2030 ($ million)
Data Table on US - Market size and forecast 2025-2030 ($ million)
Chart on US - Year-over-year growth 2025-2030 (%)
Data Table on US - Year-over-year growth 2025-2030 (%)

12.3.2 Canada - Market size and forecast 2025-2030

Chart on Canada - Market size and forecast 2025-2030 ($ million)
Data Table on Canada - Market size and forecast 2025-2030 ($ million)
Chart on Canada - Year-over-year growth 2025-2030 (%)
Data Table on Canada - Year-over-year growth 2025-2030 (%)

12.3.3 Mexico - Market size and forecast 2025-2030

Chart on Mexico - Market size and forecast 2025-2030 ($ million)
Data Table on Mexico - Market size and forecast 2025-2030 ($ million)
Chart on Mexico - Year-over-year growth 2025-2030 (%)
Data Table on Mexico - Year-over-year growth 2025-2030 (%)

12.4 Middle East and Africa - Market size and forecast 2025-2030

Chart on Middle East and Africa - Market size and forecast 2025-2030 ($ million)
Data Table on Middle East and Africa - Market size and forecast 2025-2030 ($ million)
Chart on Middle East and Africa - Year-over-year growth 2025-2030 (%)
Data Table on Middle East and Africa - Year-over-year growth 2025-2030 (%)
Chart on Regional Comparison - Middle East and Africa
Data Table on Regional Comparison - Middle East and Africa

12.4.1 Saudi Arabia - Market size and forecast 2025-2030

Chart on Saudi Arabia - Market size and forecast 2025-2030 ($ million)
Data Table on Saudi Arabia - Market size and forecast 2025-2030 ($ million)
Chart on Saudi Arabia - Year-over-year growth 2025-2030 (%)
Data Table on Saudi Arabia - Year-over-year growth 2025-2030 (%)

12.4.2 UAE - Market size and forecast 2025-2030

Chart on UAE - Market size and forecast 2025-2030 ($ million)
Data Table on UAE - Market size and forecast 2025-2030 ($ million)
Chart on UAE - Year-over-year growth 2025-2030 (%)
Data Table on UAE - Year-over-year growth 2025-2030 (%)

12.4.3 South Africa - Market size and forecast 2025-2030

Chart on South Africa - Market size and forecast 2025-2030 ($ million)
Data Table on South Africa - Market size and forecast 2025-2030 ($ million)
Chart on South Africa - Year-over-year growth 2025-2030 (%)
Data Table on South Africa - Year-over-year growth 2025-2030 (%)

12.4.4 Turkey - Market size and forecast 2025-2030

Chart on Turkey - Market size and forecast 2025-2030 ($ million)
Data Table on Turkey - Market size and forecast 2025-2030 ($ million)
Chart on Turkey - Year-over-year growth 2025-2030 (%)
Data Table on Turkey - Year-over-year growth 2025-2030 (%)

12.4.5 Israel - Market size and forecast 2025-2030

Chart on Israel - Market size and forecast 2025-2030 ($ million)
Data Table on Israel - Market size and forecast 2025-2030 ($ million)
Chart on Israel - Year-over-year growth 2025-2030 (%)
Data Table on Israel - Year-over-year growth 2025-2030 (%)

12.5 APAC - Market size and forecast 2025-2030

Chart on APAC - Market size and forecast 2025-2030 ($ million)
Data Table on APAC - Market size and forecast 2025-2030 ($ million)
Chart on APAC - Year-over-year growth 2025-2030 (%)
Data Table on APAC - Year-over-year growth 2025-2030 (%)
Chart on Regional Comparison - APAC
Data Table on Regional Comparison - APAC

12.5.1 China - Market size and forecast 2025-2030

Chart on China - Market size and forecast 2025-2030 ($ million)
Data Table on China - Market size and forecast 2025-2030 ($ million)
Chart on China - Year-over-year growth 2025-2030 (%)
Data Table on China - Year-over-year growth 2025-2030 (%)

12.5.2 Australia - Market size and forecast 2025-2030

Chart on Australia - Market size and forecast 2025-2030 ($ million)
Data Table on Australia - Market size and forecast 2025-2030 ($ million)
Chart on Australia - Year-over-year growth 2025-2030 (%)
Data Table on Australia - Year-over-year growth 2025-2030 (%)

12.5.3 Japan - Market size and forecast 2025-2030

Chart on Japan - Market size and forecast 2025-2030 ($ million)
Data Table on Japan - Market size and forecast 2025-2030 ($ million)
Chart on Japan - Year-over-year growth 2025-2030 (%)
Data Table on Japan - Year-over-year growth 2025-2030 (%)

12.5.4 India - Market size and forecast 2025-2030

Chart on India - Market size and forecast 2025-2030 ($ million)
Data Table on India - Market size and forecast 2025-2030 ($ million)
Chart on India - Year-over-year growth 2025-2030 (%)
Data Table on India - Year-over-year growth 2025-2030 (%)

12.5.5 South Korea - Market size and forecast 2025-2030

Chart on South Korea - Market size and forecast 2025-2030 ($ million)
Data Table on South Korea - Market size and forecast 2025-2030 ($ million)
Chart on South Korea - Year-over-year growth 2025-2030 (%)
Data Table on South Korea - Year-over-year growth 2025-2030 (%)

12.5.6 Indonesia - Market size and forecast 2025-2030

Chart on Indonesia - Market size and forecast 2025-2030 ($ million)
Data Table on Indonesia - Market size and forecast 2025-2030 ($ million)
Chart on Indonesia - Year-over-year growth 2025-2030 (%)
Data Table on Indonesia - Year-over-year growth 2025-2030 (%)

12.6 South America - Market size and forecast 2025-2030

Chart on South America - Market size and forecast 2025-2030 ($ million)
Data Table on South America - Market size and forecast 2025-2030 ($ million)
Chart on South America - Year-over-year growth 2025-2030 (%)
Data Table on South America - Year-over-year growth 2025-2030 (%)
Chart on Regional Comparison - South America
Data Table on Regional Comparison - South America

12.6.1 Brazil - Market size and forecast 2025-2030

Chart on Brazil - Market size and forecast 2025-2030 ($ million)
Data Table on Brazil - Market size and forecast 2025-2030 ($ million)
Chart on Brazil - Year-over-year growth 2025-2030 (%)
Data Table on Brazil - Year-over-year growth 2025-2030 (%)

12.6.2 Argentina - Market size and forecast 2025-2030

Chart on Argentina - Market size and forecast 2025-2030 ($ million)
Data Table on Argentina - Market size and forecast 2025-2030 ($ million)
Chart on Argentina - Year-over-year growth 2025-2030 (%)
Data Table on Argentina - Year-over-year growth 2025-2030 (%)

12.6.3 Chile - Market size and forecast 2025-2030

Chart on Chile - Market size and forecast 2025-2030 ($ million)
Data Table on Chile - Market size and forecast 2025-2030 ($ million)
Chart on Chile - Year-over-year growth 2025-2030 (%)
Data Table on Chile - Year-over-year growth 2025-2030 (%)

12.7 Europe - Market size and forecast 2025-2030

Chart on Europe - Market size and forecast 2025-2030 ($ million)
Data Table on Europe - Market size and forecast 2025-2030 ($ million)
Chart on Europe - Year-over-year growth 2025-2030 (%)
Data Table on Europe - Year-over-year growth 2025-2030 (%)
Chart on Regional Comparison - Europe
Data Table on Regional Comparison - Europe

12.7.1 UK - Market size and forecast 2025-2030

Chart on UK - Market size and forecast 2025-2030 ($ million)
Data Table on UK - Market size and forecast 2025-2030 ($ million)
Chart on UK - Year-over-year growth 2025-2030 (%)
Data Table on UK - Year-over-year growth 2025-2030 (%)

12.7.2 France - Market size and forecast 2025-2030

Chart on France - Market size and forecast 2025-2030 ($ million)
Data Table on France - Market size and forecast 2025-2030 ($ million)
Chart on France - Year-over-year growth 2025-2030 (%)
Data Table on France - Year-over-year growth 2025-2030 (%)

12.7.3 The Netherlands - Market size and forecast 2025-2030

Chart on The Netherlands - Market size and forecast 2025-2030 ($ million)
Data Table on The Netherlands - Market size and forecast 2025-2030 ($ million)
Chart on The Netherlands - Year-over-year growth 2025-2030 (%)
Data Table on The Netherlands - Year-over-year growth 2025-2030 (%)

12.7.4 Germany - Market size and forecast 2025-2030

Chart on Germany - Market size and forecast 2025-2030 ($ million)
Data Table on Germany - Market size and forecast 2025-2030 ($ million)
Chart on Germany - Year-over-year growth 2025-2030 (%)
Data Table on Germany - Year-over-year growth 2025-2030 (%)

12.7.5 Italy - Market size and forecast 2025-2030

Chart on Italy - Market size and forecast 2025-2030 ($ million)
Data Table on Italy - Market size and forecast 2025-2030 ($ million)
Chart on Italy - Year-over-year growth 2025-2030 (%)
Data Table on Italy - Year-over-year growth 2025-2030 (%)

12.7.6 Spain - Market size and forecast 2025-2030

Chart on Spain - Market size and forecast 2025-2030 ($ million)
Data Table on Spain - Market size and forecast 2025-2030 ($ million)
Chart on Spain - Year-over-year growth 2025-2030 (%)
Data Table on Spain - Year-over-year growth 2025-2030 (%)

12.8 Market opportunity by geography

Market opportunity by geography ($ million)
Data Tables on Market opportunity by geography ($ million)

13. Drivers, Challenges, and Opportunity

13.1 Market drivers

Increasing investments in enhancing network infrastructure
Growth in shale oil production
Increasing complexities of refineries

13.2 Market challenges

Cybersecurity risks associated with offshore oil and gas communications
Fluctuations in crude oil prices
High cost of offshore oil and gas communication system installation

13.3 Impact of drivers and challenges

Impact of drivers and challenges in 2025 and 2030

13.4 Market opportunities

Oilfield communications digitalization
Telecom-based technological advancements
Increasing demand for satellite communications

14. Competitive Landscape

14.1 Overview

14.2

Overview on criticality of inputs and factors of differentiation

14.3 Landscape disruption

Overview on factors of disruption

14.4 Industry risks

Impact of key risks on business

15. Competitive Analysis

15.1 Companies profiled

Companies covered

15.2 Company ranking index

15.3 Market positioning of companies

Matrix on companies position and classification

15.4 ABB Ltd.

ABB Ltd. - Overview
ABB Ltd. - Business segments
ABB Ltd. - Key news
ABB Ltd. - Key offerings
ABB Ltd. - Segment focus
SWOT

15.5 AT and T Inc.

AT and T Inc. - Overview
AT and T Inc. - Business segments
AT and T Inc. - Key news
AT and T Inc. - Key offerings
AT and T Inc. - Segment focus
SWOT

15.6 Aviat Networks Inc.

Aviat Networks Inc. - Overview
Aviat Networks Inc. - Product / Service
Aviat Networks Inc. - Key offerings
SWOT

15.7 Ceragon Networks Ltd.

Ceragon Networks Ltd. - Overview
Ceragon Networks Ltd. - Product / Service
Ceragon Networks Ltd. - Key offerings
SWOT

15.8 CommScope Inc.

CommScope Inc. - Overview
CommScope Inc. - Business segments
CommScope Inc. - Key news
CommScope Inc. - Key offerings
CommScope Inc. - Segment focus
SWOT

15.9 EchoStar Corp.

EchoStar Corp. - Overview
EchoStar Corp. - Business segments
EchoStar Corp. - Key offerings
EchoStar Corp. - Segment focus
SWOT

15.10 GE Vernova Inc.

GE Vernova Inc. - Overview
GE Vernova Inc. - Business segments
GE Vernova Inc. - Key offerings
GE Vernova Inc. - Segment focus
SWOT

15.11 Hitachi Ltd.

Hitachi Ltd. - Overview
Hitachi Ltd. - Business segments
Hitachi Ltd. - Key news
Hitachi Ltd. - Key offerings
Hitachi Ltd. - Segment focus
SWOT

15.12 Honeywell International Inc.

Honeywell International Inc. - Overview
Honeywell International Inc. - Business segments
Honeywell International Inc. - Key news
Honeywell International Inc. - Key offerings
Honeywell International Inc. - Segment focus
SWOT

15.13 Huawei Technologies Co. Ltd.

Huawei Technologies Co. Ltd. - Overview
Huawei Technologies Co. Ltd. - Product / Service
Huawei Technologies Co. Ltd. - Key news
Huawei Technologies Co. Ltd. - Key offerings
SWOT

15.14 Iridium Communications Inc.

Iridium Communications Inc. - Overview
Iridium Communications Inc. - Product / Service
Iridium Communications Inc. - Key news
Iridium Communications Inc. - Key offerings
SWOT

15.15 PTC Inc.

PTC Inc. - Overview
PTC Inc. - Business segments
PTC Inc. - Key offerings
PTC Inc. - Segment focus
SWOT

15.16 Siemens AG

Siemens AG - Overview
Siemens AG - Business segments
Siemens AG - Key news
Siemens AG - Key offerings
Siemens AG - Segment focus
SWOT

15.17 Speedcast

Speedcast - Overview
Speedcast - Product / Service
Speedcast - Key offerings
SWOT

15.18 Viasat Inc.

Viasat Inc. - Overview
Viasat Inc. - Business segments
Viasat Inc. - Key news
Viasat Inc. - Key offerings
Viasat Inc. - Segment focus
SWOT

16. Appendix

16.1 Scope of the report

Market definition
Objectives
Notes and caveats

16.2 Inclusions and exclusions checklist

Inclusions checklist
Exclusions checklist

16.3 Currency conversion rates for US$

16.4 Research methodology

16.5 Data procurement

Information sources

16.6 Data validation

16.7 Validation techniques employed for market sizing

16.8 Data synthesis

16.9 360 degree market analysis

16.10 List of abbreviations

Research Methodology

Technavio presents a detailed picture of the market by way of study, synthesis, and summation of data from multiple sources. The analysts have presented the various facets of the market with a particular focus on identifying the key industry influencers. The data thus presented is comprehensive, reliable, and the result of extensive research, both primary and secondary.

INFORMATION SOURCES

Primary sources

  • Manufacturers and suppliers
  • Channel partners
  • Industry experts
  • Strategic decision makers

Secondary sources

  • Industry journals and periodicals
  • Government data
  • Financial reports of key industry players
  • Historical data
  • Press releases

DATA ANALYSIS

Data Synthesis

  • Collation of data
  • Estimation of key figures
  • Analysis of derived insights

Data Validation

  • Triangulation with data models
  • Reference against proprietary databases
  • Corroboration with industry experts

REPORT WRITING

Qualitative

  • Market drivers
  • Market challenges
  • Market trends
  • Five forces analysis

Quantitative

  • Market size and forecast
  • Market segmentation
  • Geographical insights
  • Competitive landscape

Interested in this report?

Get your sample now to see our research methodology and insights!

Download Now

Frequently Asked Questions

Offshore Oil And Gas Communications market growth will increase by USD 2169.4 million during 2026-2030.

The Offshore Oil And Gas Communications market is expected to grow at a CAGR of 8.8% during 2026-2030.

Offshore Oil And Gas Communications market is segmented by Application (Upstream, Midstream, Downstream) Technology (VSAT communication network, Fiber optic-based communication network, Cellular communication network, Microwave communication network) Type (Antennas, Transmitters, Receivers, Modems, Routers)

ABB Ltd., AT and T Inc., Aviat Networks Inc., Baker Hughes Co., Ceragon Networks Ltd., CommScope Inc., EchoStar Corp., GE Vernova Inc., Hitachi Ltd., Honeywell International Inc., Huawei Technologies Co. Ltd., Iridium Communications Inc., PTC Inc., Siemens AG, Speedcast, Viasat Inc. are a few of the key vendors in the Offshore Oil And Gas Communications market.

North America will register the highest growth rate of 47.3% among the other regions. Therefore, the Offshore Oil And Gas Communications market in North America is expected to garner significant business opportunities for the vendors during the forecast period.

US, Canada, Mexico, Saudi Arabia, UAE, South Africa, Turkey, Israel, China, Australia, Japan, India, South Korea, Indonesia, Brazil, Argentina, Chile, UK, France, The Netherlands, Germany, Italy, Spain

  • Increasing investments in enhancing network infrastructure is the driving factor this market.

The Offshore Oil And Gas Communications market vendors should focus on grabbing business opportunities from the Application segment as it accounted for the largest market share in the base year.