Office Coffee Service Market Analysis, Size, and Forecast 2025-2029: North America (US, Canada, and Mexico), Europe (Germany, UK, and France), APAC (China, India, and Japan), South America (Brazil, Argentina, and Colombia), Middle East and Africa (Saudi Arabia, UAE, and South Africa), and Rest of World (ROW)

Office Coffee Service Market Analysis, Size, and Forecast 2025-2029:
North America (US, Canada, and Mexico), Europe (Germany, UK, and France), APAC (China, India, and Japan), South America (Brazil, Argentina, and Colombia), Middle East and Africa (Saudi Arabia, UAE, and South Africa), and Rest of World (ROW)

Published: Dec 2025 292 Pages SKU: IRTNTR81048

Market Overview at a Glance

$3.79 B
Market Opportunity
10.7%
CAGR 2024 - 2029
41.5%
North America Growth
$3.57 B
Coffee segment 2023

Office Coffee Service Market Size 2025-2029

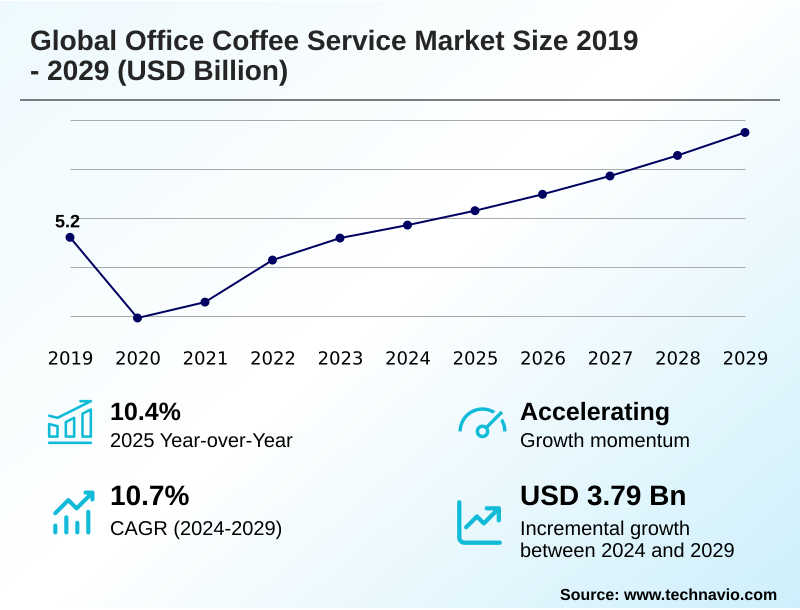
The office coffee service market size is valued to increase by USD 3.79 billion, at a CAGR of 10.7% from 2024 to 2029. Increasing emphasis on employee experience and talent retention will drive the office coffee service market.

Major Market Trends & Insights

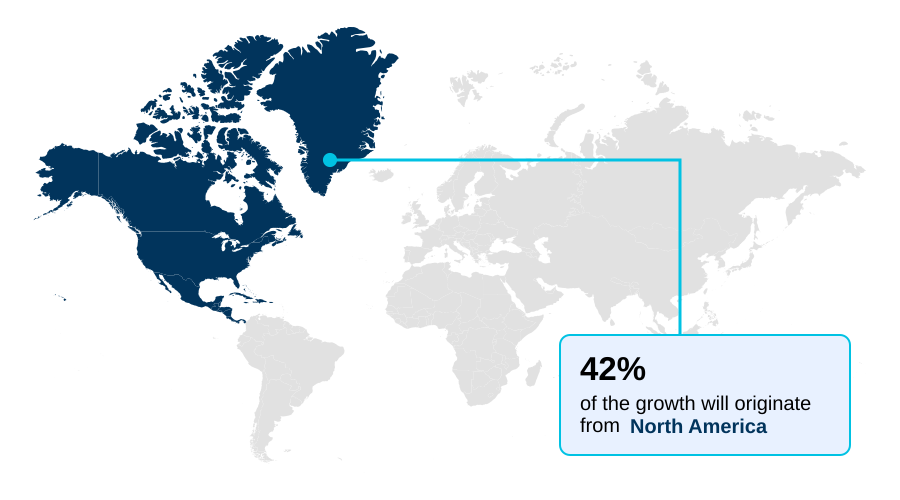
  • North America dominated the market and accounted for a 41.5% growth during the forecast period.
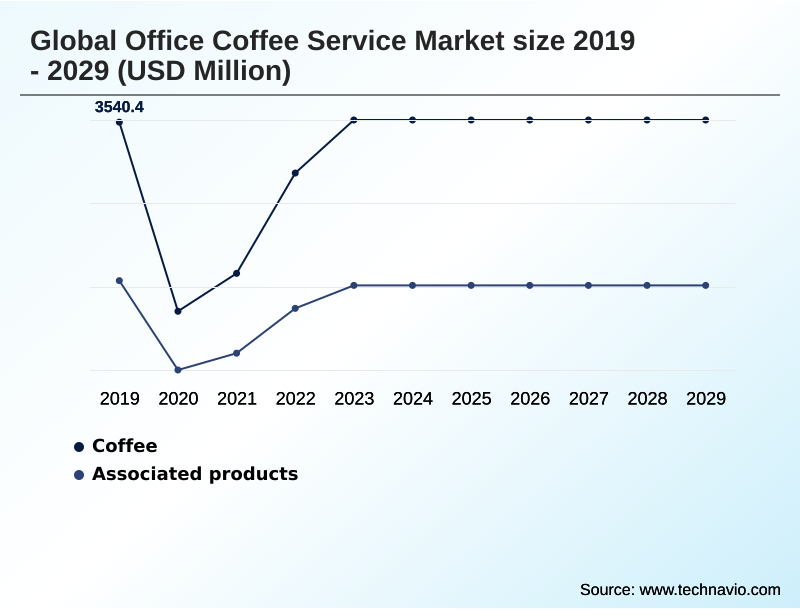
  • By Type - Coffee segment was valued at USD 3.57 billion in 2023
  • By End-user - Large enterprises segment accounted for the largest market revenue share in 2023

Market Size & Forecast

  • Market Opportunities: USD 4.29 billion
  • Market Future Opportunities: USD 3.79 billion
  • CAGR from 2024 to 2029 : 10.7%

Market Summary

  • The office coffee service market is undergoing a significant transformation, evolving from a basic provision to a strategic element of corporate culture and talent management. Driven by the need to make physical offices more appealing in a hybrid work era, companies are investing in premium beverage solutions that rival the quality of high-street cafes.
  • This trend towards premiumization involves deploying sophisticated bean-to-cup machines, offering single-origin coffees, and providing a wide array of customizable options. Simultaneously, the integration of IoT technology is optimizing operations through predictive maintenance and data-driven inventory management, enhancing service reliability.
  • For instance, a facilities manager can now use consumption data to tailor breakroom offerings to specific employee preferences, reducing waste and improving satisfaction. Sustainability has also become a critical purchasing criterion, with strong demand for ethically sourced products and eco-friendly disposables.
  • However, the market grapples with the challenge of fluctuating office occupancy, which necessitates flexible service models that can adapt to unpredictable consumption patterns. Success hinges on a provider's ability to deliver a high-value, experiential service that supports a dynamic and engaging workplace.

What will be the Size of the Office Coffee Service Market during the forecast period?

Get Key Insights on Market Forecast (PDF) Request Free Sample

How is the Office Coffee Service Market Segmented?

The office coffee service industry research report provides comprehensive data (region-wise segment analysis), with forecasts and estimates in "USD million" for the period 2025-2029, as well as historical data from 2019-2023 for the following segments.

  • Type
    • Coffee
    • Associated products
  • End-user
    • Large enterprises
    • SMEs
  • Service type
    • Subscription based
    • One time purchase
    • Managed services
    • Others
  • Geography
    • North America
      • US
      • Canada
      • Mexico
    • Europe
      • Germany
      • UK
      • France
    • APAC
      • China
      • India
      • Japan
    • South America
      • Brazil
      • Argentina
      • Colombia
    • Middle East and Africa
      • Saudi Arabia
      • UAE
      • South Africa
    • Rest of World (ROW)

By Type Insights

The coffee segment is estimated to witness significant growth during the forecast period.

The coffee segment, the foundational component of the office coffee service market, is evolving. No longer a simple provision, it is central to a comprehensive workplace amenity strategy.

Demand is shifting from basic offerings to premium and specialty coffee options, mirroring consumer retail trends. This transition is driven by the deployment of advanced bean-to-cup machines and superautomatic espresso machines that deliver a superior, customizable experience.

Companies are leveraging these enhanced corporate coffee programs as a key part of their employee engagement initiatives.

This focus on quality has resulted in the coffee segment commanding over 69% of the market, reinforcing its importance in creating experiential breakrooms and supporting talent retention perks.

Key to this is a robust pantry service model and ethical trade certification.

Request Free Sample

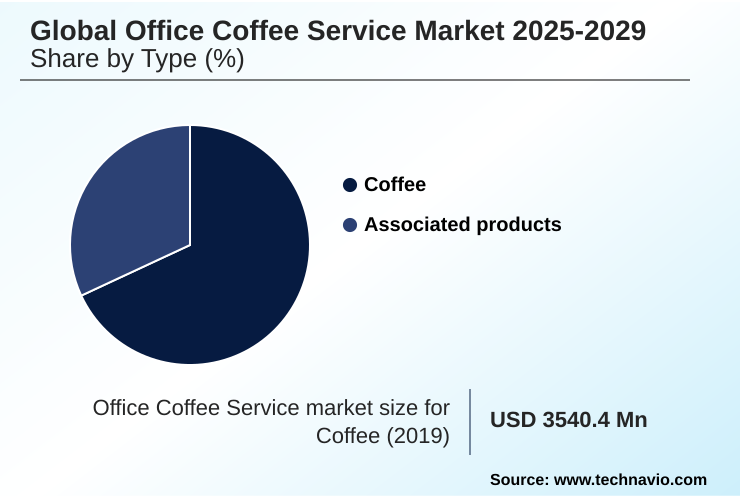
The Coffee segment was valued at USD 3.57 billion in 2023 and showed a gradual increase during the forecast period.

Request Free Sample

Regional Analysis

North America is estimated to contribute 41.5% to the growth of the global market during the forecast period.Technavio’s analysts have elaborately explained the regional trends and drivers that shape the market during the forecast period.

See How Office Coffee Service Market Demand is Rising in North America Request Free Sample

North America remains the largest region, contributing over 41% of the market's incremental growth, driven by mature workplace beverage solutions and a focus on premium office amenities.

This region sees heavy adoption of managed beverage programs and data-driven vending to optimize services. In contrast, APAC is the fastest-growing market, with a growth rate nearly 2% higher than Europe's.

This expansion is fueled by economic development and the adoption of modern corporate wellness programs in emerging economies.

OCS providers are implementing frictionless retail and turnkey breakroom solutions to capture this growth, adapting their offerings from the established practices in more mature markets to meet localized demand and operational dynamics. These facility management services are crucial for expansion.

Market Dynamics

Our researchers analyzed the data with 2024 as the base year, along with the key drivers, trends, and challenges. A holistic analysis of drivers will help companies refine their marketing strategies to gain a competitive advantage.

  • Strategic decision-making in the global office coffee service market 2025-2029 now requires a holistic approach that balances cost with value. A detailed cost analysis of managed coffee services is essential, as the premiumization trend in corporate coffee continues to elevate expectations.
  • The impact of hybrid work on office coffee consumption patterns necessitates flexible contracts and the use of IoT enabled coffee machine maintenance for efficiency. Forward-thinking firms explore the benefits of pantry services for SMEs, which can be a significant differentiator in competitive talent markets.
  • When evaluating providers, a thorough comparison of bean-to-cup and pod systems is crucial, considering both quality and sustainability. This feeds into broader corporate coffee and beverage trends and influences corporate coffee contract negotiation. The role of OCS in corporate wellness is undeniable, with plant-based options in office coffee and cold brew solutions for the office becoming standard.
  • Effective breakroom design and coffee service are now linked directly to employee satisfaction with office coffee. As such, OCS provider selection criteria must include capabilities in OCS technology and data analytics and a commitment to ethical sourcing in office coffee supply, as well as robust water quality solutions for office coffee to ensure a premium experience.
  • Smart coffee machines for employee engagement are no longer a luxury but a strategic tool, with sustainable office coffee service solutions offering a dual benefit of environmental responsibility and enhanced corporate image.

What are the key market drivers leading to the rise in the adoption of Office Coffee Service Industry?

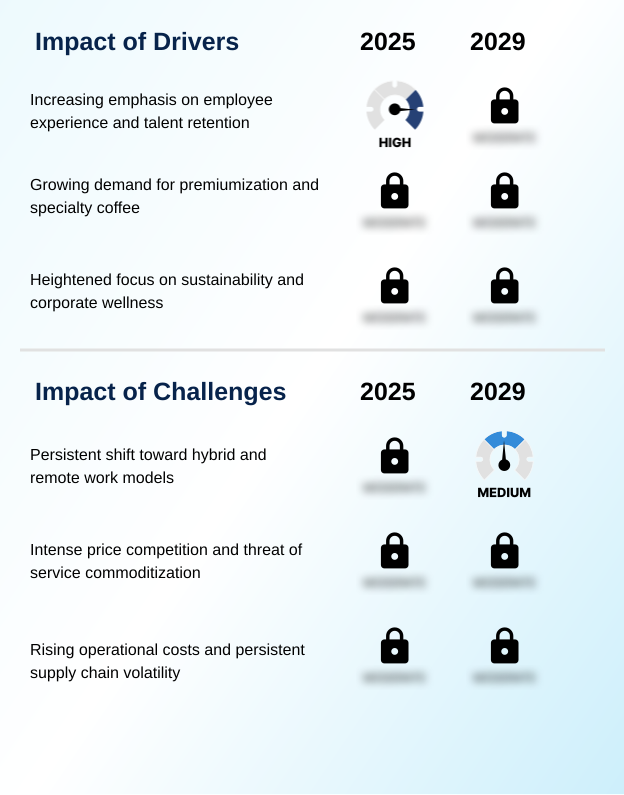
  • The increasing emphasis on enhancing the employee experience and retaining talent stands as a primary driver, positioning office coffee service as a strategic corporate amenity.

  • A primary market driver is the strategic use of high-quality office hospitality services to enhance employee experience and support talent retention.
  • Companies are investing in premium solutions, including single-origin varieties and artisanal roasts, to make the physical office a more attractive destination.
  • This trend towards premiumization is evident in the demand for on-demand beverage service and sophisticated equipment that delivers a cafe-quality experience, such as cold brew on tap.
  • The availability of diverse options, including various compostable cups and water filtration systems, supports corporate wellness initiatives.
  • By providing these employee refreshment solutions, organizations can boost morale and foster collaboration, with some firms seeing a 15% improvement in employee satisfaction survey scores related to workplace amenities. This is a core part of effective on-demand beverage service.

What are the market trends shaping the Office Coffee Service Industry?

  • The integration of smart technology and data analytics is a defining trend, transforming service delivery from a reactive, schedule-based function to a proactive, data-driven operation.

  • The integration of smart technology is reshaping service delivery. Modern coffee makers now feature telemetry and IoT sensors, enabling predictive maintenance and dynamic restocking, which can improve operational uptime by over 20%. This technology transforms reactive services into proactive, data-driven operations. Providers are leveraging this data for consumption-based billing and to offer customizable beverage menus.
  • The trend extends to creating integrated, technology-driven ecosystems with contactless payment systems and mobile app integration. This focus on automated coffee service is a core component of a seamless, data-rich employee experience design, enabling smart kitchen technology and better office pantry management.

What challenges does the Office Coffee Service Industry face during its growth?

  • The persistent structural shift toward hybrid and remote work models presents a paramount challenge, disrupting traditional business models based on predictable daily office occupancy.

  • The enduring shift to hybrid work models presents a significant challenge, disrupting traditional consumption patterns and making forecasting difficult. Reduced office foot traffic challenges fixed-fee contracts, increasing demand for flexible service models that reflect actual usage. OCS providers face intense price competition, amplified by rising operational costs for inputs like whole-bean coffee and fuel for service fleets.
  • This environment compels providers to differentiate through sustainable sourcing and superior equipment, such as offering a wide variety of plant-based milk alternatives. Balancing ESG compliant procurement with cost pressures is a critical strategic hurdle, impacting supply chain transparency and the ability to invest in new return-to-office incentives.

Exclusive Technavio Analysis on Customer Landscape

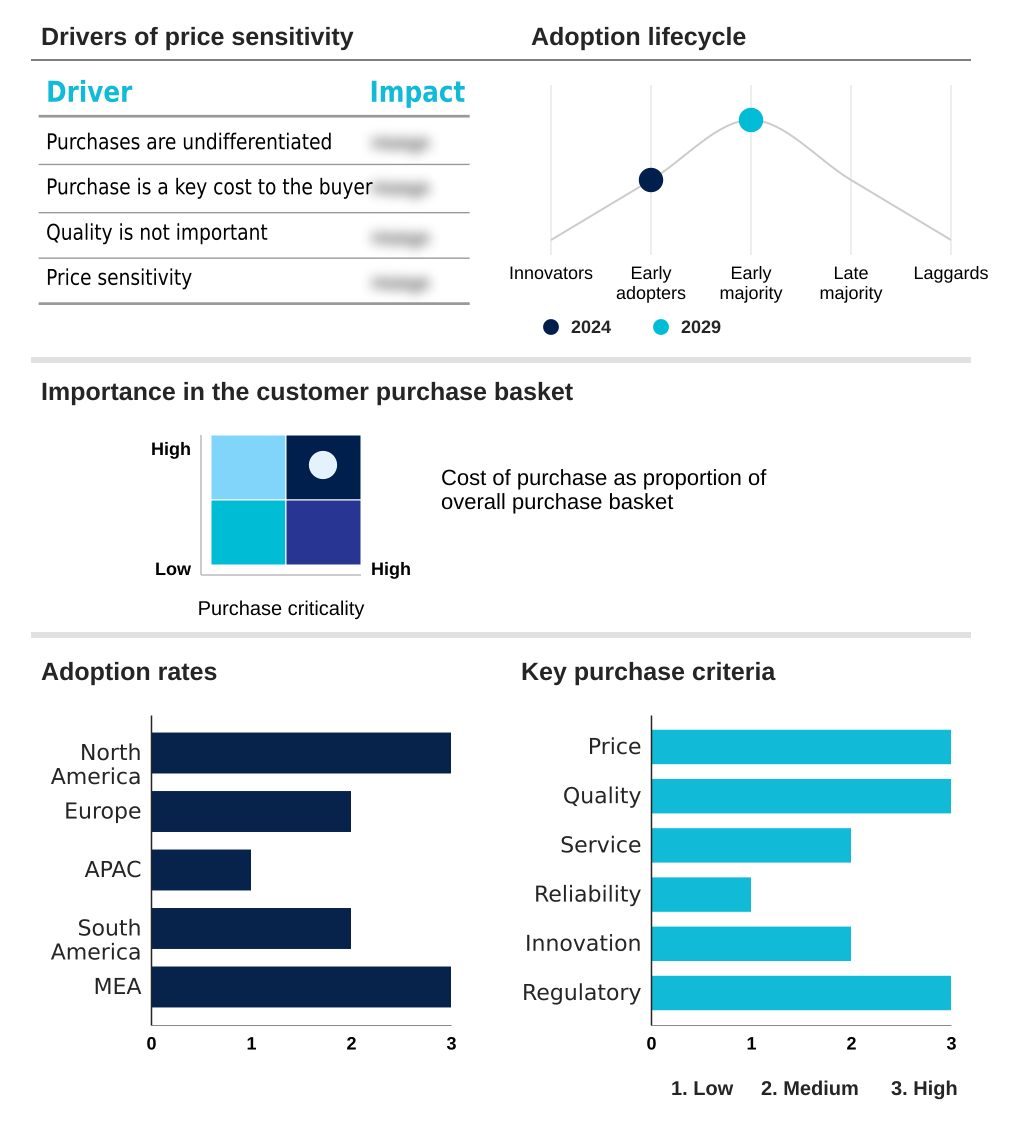
The office coffee service market forecasting report includes the adoption lifecycle of the market, covering from the innovator’s stage to the laggard’s stage. It focuses on adoption rates in different regions based on penetration. Furthermore, the office coffee service market report also includes key purchase criteria and drivers of price sensitivity to help companies evaluate and develop their market growth analysis strategies.

Customer Landscape of Office Coffee Service Industry

Competitive Landscape

Companies are implementing various strategies, such as strategic alliances, office coffee service market forecast, partnerships, mergers and acquisitions, geographical expansion, and product/service launches, to enhance their presence in the industry.

American Dining Creations - Offering comprehensive breakroom, vending, and micro market solutions for modern workplaces through its food, hospitality, and facilities services segments.

The industry research and growth report includes detailed analyses of the competitive landscape of the market and information about key companies, including:

  • American Dining Creations
  • Aramark
  • AVS Companies
  • Bodecker
  • Bunn O Matic Corp.
  • Compass Group
  • Evoca Group
  • Farmer Bros Co.
  • Hamilton Beach Brands Inc.
  • JACOBS DOUWE EGBERTS PRO
  • Keurig Green Mountain Inc.
  • Luigi Lavazza SPA.
  • Nestle SA
  • Royal Cup Inc.
  • Selecta Group BV
  • Sodexo SA
  • Starbucks Corp.
  • Strauss Coffee BV
  • Westrock Coffee Co.

Qualitative and quantitative analysis of companies has been conducted to help clients understand the wider business environment as well as the strengths and weaknesses of key industry players. Data is qualitatively analyzed to categorize companies as pure play, category-focused, industry-focused, and diversified; it is quantitatively analyzed to categorize companies as dominant, leading, strong, tentative, and weak.

Recent Development and News in Office coffee service market

  • In August 2024, Huhtamaki, in partnership with a major coffee retailer, launched a fully renewable and compostable molded fiber lid for hot cups, addressing growing demand for sustainable packaging in foodservice.
  • In May 2025, 365 Retail Markets acquired Impulsify, a self-service retail technology provider, signaling a strategic move toward creating integrated, data-driven breakroom ecosystems with smart coffee solutions.
  • In March 2025, Canteen unveiled its Connect and Pay AI-powered retail experience, allowing employees to select items from smart coolers with automatic charging, enhancing the experiential breakroom concept.
  • In April 2025, premium coffee technology company xBloom launched its xBloom for Business subscription program, providing offices with advanced automated pour-over machines and curated specialty coffee beans.

Dive into Technavio’s robust research methodology, blending expert interviews, extensive data synthesis, and validated models for unparalleled Office Coffee Service Market insights. See full methodology.

Market Scope
Page number 292
Base year 2024
Historic period 2019-2023
Forecast period 2025-2029
Growth momentum & CAGR Accelerate at a CAGR of 10.7%
Market growth 2025-2029 USD 3792.7 million
Market structure Fragmented
YoY growth 2024-2025(%) 10.4%
Key countries US, Canada, Mexico, Germany, UK, France, Italy, The Netherlands, Spain, China, India, Japan, Australia, South Korea, Indonesia, Brazil, Argentina, Colombia, Saudi Arabia, UAE, South Africa, Israel and Turkey
Competitive landscape Leading Companies, Market Positioning of Companies, Competitive Strategies, and Industry Risks

Request Free Sample

Research Analyst Overview

  • The office coffee service market's evolution is defined by a strategic convergence of technology and service premiumization, fundamentally altering its role as a workplace amenity. The deployment of bean-to-cup machines and superautomatic espresso machines is now standard, driven by demand for specialty coffee options and single-origin varieties.
  • A key boardroom consideration is the integration of telemetry and IoT sensors, which enable predictive maintenance and dynamic restocking, directly impacting operational budgets. For example, firms leveraging these systems have reported a reduction in equipment downtime by up to 30%. This data-driven approach facilitates consumption-based billing and supports a holistic pantry service model.
  • The shift extends to consumables, with strong demand for whole-bean coffee, plant-based milk alternatives, and artisanal roasts. Providers are compelled to offer managed beverage programs that feature sustainable sourcing, ethical trade certification, and compostable cups, aligning with corporate ESG mandates.
  • This move towards experiential breakrooms, complete with cold brew on tap and advanced water filtration systems, positions OCS as a critical component of any modern workplace amenity strategy, supported by intuitive touchscreen interfaces and mobile app integration.

What are the Key Data Covered in this Office Coffee Service Market Research and Growth Report?

  • What is the expected growth of the Office Coffee Service Market between 2025 and 2029?

    • USD 3.79 billion, at a CAGR of 10.7%

  • What segmentation does the market report cover?

    • The report is segmented by Type (Coffee, Associated products), End-user (Large enterprises, SMEs), Service Type (Subscription based, One time purchase, Managed services, Others ) and Geography (North America, Europe, APAC, South America, Middle East and Africa)

  • Which regions are analyzed in the report?

    • North America, Europe, APAC, South America and Middle East and Africa

  • What are the key growth drivers and market challenges?

    • Increasing emphasis on employee experience and talent retention , Persistent shift toward hybrid and remote work models

  • Who are the major players in the Office Coffee Service Market?

    • American Dining Creations, Aramark, AVS Companies, Bodecker, Bunn O Matic Corp., Compass Group, Evoca Group, Farmer Bros Co., Hamilton Beach Brands Inc., JACOBS DOUWE EGBERTS PRO, Keurig Green Mountain Inc., Luigi Lavazza SPA., Nestle SA, Royal Cup Inc., Selecta Group BV, Sodexo SA, Starbucks Corp., Strauss Coffee BV and Westrock Coffee Co.

Market Research Insights

  • The market is shaped by a strategic pivot toward comprehensive employee refreshment solutions, where providers act as partners in talent retention. The adoption of data-driven vending and breakroom management has led to a 15% reduction in stock-outs and waste for early adopters.
  • Corporate coffee programs are increasingly integrated into broader employee engagement initiatives and corporate wellness programs, with a strong focus on ESG compliant procurement. Companies offering premium office amenities and flexible workplace beverage solutions report a 10% higher score on employee satisfaction surveys compared to those with basic services.
  • This shift requires expertise in office pantry management and the deployment of turnkey breakroom solutions to create an appealing environment that serves as a tangible return-to-office incentive.

We can help! Our analysts can customize this office coffee service market research report to meet your requirements.

Get in touch

1. Executive Summary

1.1 Market overview

Executive Summary - Chart on Market Overview
Executive Summary - Data Table on Market Overview
Executive Summary - Chart on Global Market Characteristics
Executive Summary - Chart on Market by Geography
Executive Summary - Chart on Market Segmentation by Type
Executive Summary - Chart on Market Segmentation by End-user
Executive Summary - Chart on Market Segmentation by Service Type
Executive Summary - Chart on Incremental Growth
Executive Summary - Data Table on Incremental Growth
Executive Summary - Chart on Company Market Positioning

2. Technavio Analysis

2.1 Analysis of price sensitivity, lifecycle, customer purchase basket, adoption rates, and purchase criteria

2.2 Criticality of inputs and Factors of differentiation

Chart on Overview on criticality of inputs and factors of differentiation

2.3 Factors of disruption

Chart on Overview on factors of disruption

2.4 Impact of drivers and challenges

Chart on Impact of drivers and challenges in 2024 and 2029

3. Market Landscape

3.1 Market ecosystem

Chart on Parent Market
Data Table on - Parent Market

3.2 Market characteristics

Chart on Market characteristics analysis

3.3 Value chain analysis

Chart on Value chain analysis

4. Market Sizing

4.1 Market definition

Data Table on Offerings of companies included in the market definition

4.2 Market segment analysis

Market segments

4.3 Market size 2024

4.4 Market outlook: Forecast for 2024-2029

Chart on Global - Market size and forecast 2024-2029 ($ million)
Data Table on Global - Market size and forecast 2024-2029 ($ million)
Chart on Global Market: Year-over-year growth 2024-2029 (%)
Data Table on Global Market: Year-over-year growth 2024-2029 (%)

5. Historic Market Size

5.1 Global Office Coffee Service Market 2019 - 2023

Historic Market Size - Data Table on Global Office Coffee Service Market 2019 - 2023 ($ million)

5.2 Type segment analysis 2019 - 2023

Historic Market Size - Type Segment 2019 - 2023 ($ million)

5.3 End-user segment analysis 2019 - 2023

Historic Market Size - End-user Segment 2019 - 2023 ($ million)

5.4 Service Type segment analysis 2019 - 2023

Historic Market Size - Service Type Segment 2019 - 2023 ($ million)

5.5 Geography segment analysis 2019 - 2023

Historic Market Size - Geography Segment 2019 - 2023 ($ million)

5.6 Country segment analysis 2019 - 2023

Historic Market Size - Country Segment 2019 - 2023 ($ million)

6. Qualitative Analysis

6.1 The impact of AI on the global office coffee service (OCS) market

7. Five Forces Analysis

7.1 Five forces summary

Five forces analysis - Comparison between 2024 and 2029

7.2 Bargaining power of buyers

Bargaining power of buyers - Impact of key factors 2024 and 2029

7.3 Bargaining power of suppliers

Bargaining power of suppliers - Impact of key factors in 2024 and 2029

7.4 Threat of new entrants

Threat of new entrants - Impact of key factors in 2024 and 2029

7.5 Threat of substitutes

Threat of substitutes - Impact of key factors in 2024 and 2029

7.6 Threat of rivalry

Threat of rivalry - Impact of key factors in 2024 and 2029

7.7 Market condition

Chart on Market condition - Five forces 2024 and 2029

8. Market Segmentation by Type

8.1 Market segments

Chart on Type - Market share 2024-2029 (%)
Data Table on Type - Market share 2024-2029 (%)

8.2 Comparison by Type

Chart on Comparison by Type
Data Table on Comparison by Type

8.3 Coffee - Market size and forecast 2024-2029

Chart on Coffee - Market size and forecast 2024-2029 ($ million)
Data Table on Coffee - Market size and forecast 2024-2029 ($ million)
Chart on Coffee - Year-over-year growth 2024-2029 (%)
Data Table on Coffee - Year-over-year growth 2024-2029 (%)

8.4 Associated products - Market size and forecast 2024-2029

Chart on Associated products - Market size and forecast 2024-2029 ($ million)
Data Table on Associated products - Market size and forecast 2024-2029 ($ million)
Chart on Associated products - Year-over-year growth 2024-2029 (%)
Data Table on Associated products - Year-over-year growth 2024-2029 (%)

8.5 Market opportunity by Type

Market opportunity by Type ($ million)
Data Table on Market opportunity by Type ($ million)

9. Market Segmentation by End-user

9.1 Market segments

Chart on End-user - Market share 2024-2029 (%)
Data Table on End-user - Market share 2024-2029 (%)

9.2 Comparison by End-user

Chart on Comparison by End-user
Data Table on Comparison by End-user

9.3 Large enterprises - Market size and forecast 2024-2029

Chart on Large enterprises - Market size and forecast 2024-2029 ($ million)
Data Table on Large enterprises - Market size and forecast 2024-2029 ($ million)
Chart on Large enterprises - Year-over-year growth 2024-2029 (%)
Data Table on Large enterprises - Year-over-year growth 2024-2029 (%)

9.4 SMEs - Market size and forecast 2024-2029

Chart on SMEs - Market size and forecast 2024-2029 ($ million)
Data Table on SMEs - Market size and forecast 2024-2029 ($ million)
Chart on SMEs - Year-over-year growth 2024-2029 (%)
Data Table on SMEs - Year-over-year growth 2024-2029 (%)

9.5 Market opportunity by End-user

Market opportunity by End-user ($ million)
Data Table on Market opportunity by End-user ($ million)

10. Market Segmentation by Service Type

10.1 Market segments

Chart on Service Type - Market share 2024-2029 (%)
Data Table on Service Type - Market share 2024-2029 (%)

10.2 Comparison by Service Type

Chart on Comparison by Service Type
Data Table on Comparison by Service Type

10.3 Subscription based - Market size and forecast 2024-2029

Chart on Subscription based - Market size and forecast 2024-2029 ($ million)
Data Table on Subscription based - Market size and forecast 2024-2029 ($ million)
Chart on Subscription based - Year-over-year growth 2024-2029 (%)
Data Table on Subscription based - Year-over-year growth 2024-2029 (%)

10.4 One time purchase - Market size and forecast 2024-2029

Chart on One time purchase - Market size and forecast 2024-2029 ($ million)
Data Table on One time purchase - Market size and forecast 2024-2029 ($ million)
Chart on One time purchase - Year-over-year growth 2024-2029 (%)
Data Table on One time purchase - Year-over-year growth 2024-2029 (%)

10.5 Managed services - Market size and forecast 2024-2029

Chart on Managed services - Market size and forecast 2024-2029 ($ million)
Data Table on Managed services - Market size and forecast 2024-2029 ($ million)
Chart on Managed services - Year-over-year growth 2024-2029 (%)
Data Table on Managed services - Year-over-year growth 2024-2029 (%)

10.6 Others - Market size and forecast 2024-2029

Chart on Others - Market size and forecast 2024-2029 ($ million)
Data Table on Others - Market size and forecast 2024-2029 ($ million)
Chart on Others - Year-over-year growth 2024-2029 (%)
Data Table on Others - Year-over-year growth 2024-2029 (%)

10.7 Market opportunity by Service Type

Market opportunity by Service Type ($ million)
Data Table on Market opportunity by Service Type ($ million)

11. Customer Landscape

11.1 Customer landscape overview

Analysis of price sensitivity, lifecycle, customer purchase basket, adoption rates, and purchase criteria

12. Geographic Landscape

12.1 Geographic segmentation

Chart on Market share by geography 2024-2029 (%)
Data Table on Market share by geography 2024-2029 (%)

12.2 Geographic comparison

Chart on Geographic comparison
Data Table on Geographic comparison

12.3 North America - Market size and forecast 2024-2029

Chart on North America - Market size and forecast 2024-2029 ($ million)
Data Table on North America - Market size and forecast 2024-2029 ($ million)
Chart on North America - Year-over-year growth 2024-2029 (%)
Data Table on North America - Year-over-year growth 2024-2029 (%)
Chart on Regional Comparison - North America
Data Table on Regional Comparison - North America

12.3.1 US - Market size and forecast 2024-2029

Chart on US - Market size and forecast 2024-2029 ($ million)
Data Table on US - Market size and forecast 2024-2029 ($ million)
Chart on US - Year-over-year growth 2024-2029 (%)
Data Table on US - Year-over-year growth 2024-2029 (%)

12.3.2 Canada - Market size and forecast 2024-2029

Chart on Canada - Market size and forecast 2024-2029 ($ million)
Data Table on Canada - Market size and forecast 2024-2029 ($ million)
Chart on Canada - Year-over-year growth 2024-2029 (%)
Data Table on Canada - Year-over-year growth 2024-2029 (%)

12.3.3 Mexico - Market size and forecast 2024-2029

Chart on Mexico - Market size and forecast 2024-2029 ($ million)
Data Table on Mexico - Market size and forecast 2024-2029 ($ million)
Chart on Mexico - Year-over-year growth 2024-2029 (%)
Data Table on Mexico - Year-over-year growth 2024-2029 (%)

12.4 Europe - Market size and forecast 2024-2029

Chart on Europe - Market size and forecast 2024-2029 ($ million)
Data Table on Europe - Market size and forecast 2024-2029 ($ million)
Chart on Europe - Year-over-year growth 2024-2029 (%)
Data Table on Europe - Year-over-year growth 2024-2029 (%)
Chart on Regional Comparison - Europe
Data Table on Regional Comparison - Europe

12.4.1 Germany - Market size and forecast 2024-2029

Chart on Germany - Market size and forecast 2024-2029 ($ million)
Data Table on Germany - Market size and forecast 2024-2029 ($ million)
Chart on Germany - Year-over-year growth 2024-2029 (%)
Data Table on Germany - Year-over-year growth 2024-2029 (%)

12.4.2 UK - Market size and forecast 2024-2029

Chart on UK - Market size and forecast 2024-2029 ($ million)
Data Table on UK - Market size and forecast 2024-2029 ($ million)
Chart on UK - Year-over-year growth 2024-2029 (%)
Data Table on UK - Year-over-year growth 2024-2029 (%)

12.4.3 France - Market size and forecast 2024-2029

Chart on France - Market size and forecast 2024-2029 ($ million)
Data Table on France - Market size and forecast 2024-2029 ($ million)
Chart on France - Year-over-year growth 2024-2029 (%)
Data Table on France - Year-over-year growth 2024-2029 (%)

12.4.4 Italy - Market size and forecast 2024-2029

Chart on Italy - Market size and forecast 2024-2029 ($ million)
Data Table on Italy - Market size and forecast 2024-2029 ($ million)
Chart on Italy - Year-over-year growth 2024-2029 (%)
Data Table on Italy - Year-over-year growth 2024-2029 (%)

12.4.5 The Netherlands - Market size and forecast 2024-2029

Chart on The Netherlands - Market size and forecast 2024-2029 ($ million)
Data Table on The Netherlands - Market size and forecast 2024-2029 ($ million)
Chart on The Netherlands - Year-over-year growth 2024-2029 (%)
Data Table on The Netherlands - Year-over-year growth 2024-2029 (%)

12.4.6 Spain - Market size and forecast 2024-2029

Chart on Spain - Market size and forecast 2024-2029 ($ million)
Data Table on Spain - Market size and forecast 2024-2029 ($ million)
Chart on Spain - Year-over-year growth 2024-2029 (%)
Data Table on Spain - Year-over-year growth 2024-2029 (%)

12.5 APAC - Market size and forecast 2024-2029

Chart on APAC - Market size and forecast 2024-2029 ($ million)
Data Table on APAC - Market size and forecast 2024-2029 ($ million)
Chart on APAC - Year-over-year growth 2024-2029 (%)
Data Table on APAC - Year-over-year growth 2024-2029 (%)
Chart on Regional Comparison - APAC
Data Table on Regional Comparison - APAC

12.5.1 China - Market size and forecast 2024-2029

Chart on China - Market size and forecast 2024-2029 ($ million)
Data Table on China - Market size and forecast 2024-2029 ($ million)
Chart on China - Year-over-year growth 2024-2029 (%)
Data Table on China - Year-over-year growth 2024-2029 (%)

12.5.2 India - Market size and forecast 2024-2029

Chart on India - Market size and forecast 2024-2029 ($ million)
Data Table on India - Market size and forecast 2024-2029 ($ million)
Chart on India - Year-over-year growth 2024-2029 (%)
Data Table on India - Year-over-year growth 2024-2029 (%)

12.5.3 Japan - Market size and forecast 2024-2029

Chart on Japan - Market size and forecast 2024-2029 ($ million)
Data Table on Japan - Market size and forecast 2024-2029 ($ million)
Chart on Japan - Year-over-year growth 2024-2029 (%)
Data Table on Japan - Year-over-year growth 2024-2029 (%)

12.5.4 Australia - Market size and forecast 2024-2029

Chart on Australia - Market size and forecast 2024-2029 ($ million)
Data Table on Australia - Market size and forecast 2024-2029 ($ million)
Chart on Australia - Year-over-year growth 2024-2029 (%)
Data Table on Australia - Year-over-year growth 2024-2029 (%)

12.5.5 South Korea - Market size and forecast 2024-2029

Chart on South Korea - Market size and forecast 2024-2029 ($ million)
Data Table on South Korea - Market size and forecast 2024-2029 ($ million)
Chart on South Korea - Year-over-year growth 2024-2029 (%)
Data Table on South Korea - Year-over-year growth 2024-2029 (%)

12.5.6 Indonesia - Market size and forecast 2024-2029

Chart on Indonesia - Market size and forecast 2024-2029 ($ million)
Data Table on Indonesia - Market size and forecast 2024-2029 ($ million)
Chart on Indonesia - Year-over-year growth 2024-2029 (%)
Data Table on Indonesia - Year-over-year growth 2024-2029 (%)

12.6 South America - Market size and forecast 2024-2029

Chart on South America - Market size and forecast 2024-2029 ($ million)
Data Table on South America - Market size and forecast 2024-2029 ($ million)
Chart on South America - Year-over-year growth 2024-2029 (%)
Data Table on South America - Year-over-year growth 2024-2029 (%)
Chart on Regional Comparison - South America
Data Table on Regional Comparison - South America

12.6.1 Brazil - Market size and forecast 2024-2029

Chart on Brazil - Market size and forecast 2024-2029 ($ million)
Data Table on Brazil - Market size and forecast 2024-2029 ($ million)
Chart on Brazil - Year-over-year growth 2024-2029 (%)
Data Table on Brazil - Year-over-year growth 2024-2029 (%)

12.6.2 Argentina - Market size and forecast 2024-2029

Chart on Argentina - Market size and forecast 2024-2029 ($ million)
Data Table on Argentina - Market size and forecast 2024-2029 ($ million)
Chart on Argentina - Year-over-year growth 2024-2029 (%)
Data Table on Argentina - Year-over-year growth 2024-2029 (%)

12.6.3 Colombia - Market size and forecast 2024-2029

Chart on Colombia - Market size and forecast 2024-2029 ($ million)
Data Table on Colombia - Market size and forecast 2024-2029 ($ million)
Chart on Colombia - Year-over-year growth 2024-2029 (%)
Data Table on Colombia - Year-over-year growth 2024-2029 (%)

12.7 Middle East and Africa - Market size and forecast 2024-2029

Chart on Middle East and Africa - Market size and forecast 2024-2029 ($ million)
Data Table on Middle East and Africa - Market size and forecast 2024-2029 ($ million)
Chart on Middle East and Africa - Year-over-year growth 2024-2029 (%)
Data Table on Middle East and Africa - Year-over-year growth 2024-2029 (%)
Chart on Regional Comparison - Middle East and Africa
Data Table on Regional Comparison - Middle East and Africa

12.7.1 Saudi Arabia - Market size and forecast 2024-2029

Chart on Saudi Arabia - Market size and forecast 2024-2029 ($ million)
Data Table on Saudi Arabia - Market size and forecast 2024-2029 ($ million)
Chart on Saudi Arabia - Year-over-year growth 2024-2029 (%)
Data Table on Saudi Arabia - Year-over-year growth 2024-2029 (%)

12.7.2 UAE - Market size and forecast 2024-2029

Chart on UAE - Market size and forecast 2024-2029 ($ million)
Data Table on UAE - Market size and forecast 2024-2029 ($ million)
Chart on UAE - Year-over-year growth 2024-2029 (%)
Data Table on UAE - Year-over-year growth 2024-2029 (%)

12.7.3 South Africa - Market size and forecast 2024-2029

Chart on South Africa - Market size and forecast 2024-2029 ($ million)
Data Table on South Africa - Market size and forecast 2024-2029 ($ million)
Chart on South Africa - Year-over-year growth 2024-2029 (%)
Data Table on South Africa - Year-over-year growth 2024-2029 (%)

12.7.4 Israel - Market size and forecast 2024-2029

Chart on Israel - Market size and forecast 2024-2029 ($ million)
Data Table on Israel - Market size and forecast 2024-2029 ($ million)
Chart on Israel - Year-over-year growth 2024-2029 (%)
Data Table on Israel - Year-over-year growth 2024-2029 (%)

12.7.5 Turkey - Market size and forecast 2024-2029

Chart on Turkey - Market size and forecast 2024-2029 ($ million)
Data Table on Turkey - Market size and forecast 2024-2029 ($ million)
Chart on Turkey - Year-over-year growth 2024-2029 (%)
Data Table on Turkey - Year-over-year growth 2024-2029 (%)

12.8 Market opportunity by geography

Market opportunity by geography ($ million)
Data Tables on Market opportunity by geography ($ million)

13. Drivers, Challenges, and Opportunity

13.1 Market drivers

Increasing emphasis on employee experience and talent retention
Growing demand for premiumization and specialty coffee
Heightened focus on sustainability and corporate wellness

13.2 Market challenges

Persistent shift toward hybrid and remote work models
Intense price competition and threat of service commoditization
Rising operational costs and persistent supply chain volatility

13.3 Impact of drivers and challenges

Impact of drivers and challenges in 2024 and 2029

13.4 Market opportunities

Integration of smart technology and data analytics
Evolution toward experiential breakrooms and holistic wellness
Hyper-customization and demand for personalized beverages

14. Competitive Landscape

14.1 Overview

14.2

Overview on criticality of inputs and factors of differentiation

14.3 Landscape disruption

Overview on factors of disruption

14.4 Industry risks

Impact of key risks on business

15. Competitive Analysis

15.1 Companies profiled

Companies covered

15.2 Company ranking index

15.3 Market positioning of companies

Matrix on companies position and classification

15.4 Aramark

Aramark - Overview
Aramark - Business segments
Aramark - Key news
Aramark - Key offerings
Aramark - Segment focus
SWOT

15.5 AVS Companies

AVS Companies - Overview
AVS Companies - Product / Service
AVS Companies - Key offerings
SWOT

15.6 Bodecker

Bodecker - Overview
Bodecker - Product / Service
Bodecker - Key offerings
SWOT

15.7 Compass Group

Compass Group - Overview
Compass Group - Product / Service
Compass Group - Key offerings
SWOT

15.8 Evoca Group

Evoca Group - Overview
Evoca Group - Product / Service
Evoca Group - Key offerings
SWOT

15.9 Farmer Bros Co.

Farmer Bros Co. - Overview
Farmer Bros Co. - Product / Service
Farmer Bros Co. - Key offerings
SWOT

15.10 JACOBS DOUWE EGBERTS PRO

JACOBS DOUWE EGBERTS PRO - Overview
JACOBS DOUWE EGBERTS PRO - Product / Service
JACOBS DOUWE EGBERTS PRO - Key offerings
SWOT

15.11 Keurig Green Mountain Inc.

Keurig Green Mountain Inc. - Overview
Keurig Green Mountain Inc. - Product / Service
Keurig Green Mountain Inc. - Key offerings
SWOT

15.12 Luigi Lavazza SPA.

Luigi Lavazza SPA. - Overview
Luigi Lavazza SPA. - Product / Service
Luigi Lavazza SPA. - Key offerings
SWOT

15.13 Nestle SA

Nestle SA - Overview
Nestle SA - Business segments
Nestle SA - Key news
Nestle SA - Key offerings
Nestle SA - Segment focus
SWOT

15.14 Royal Cup Inc.

Royal Cup Inc. - Overview
Royal Cup Inc. - Product / Service
Royal Cup Inc. - Key offerings
SWOT

15.15 Selecta Group BV

Selecta Group BV - Overview
Selecta Group BV - Business segments
Selecta Group BV - Key offerings
Selecta Group BV - Segment focus
SWOT

15.16 Sodexo SA

Sodexo SA - Overview
Sodexo SA - Business segments
Sodexo SA - Key news
Sodexo SA - Key offerings
Sodexo SA - Segment focus
SWOT

15.17 Starbucks Corp.

Starbucks Corp. - Overview
Starbucks Corp. - Product / Service
Starbucks Corp. - Key offerings
SWOT

15.18 Westrock Coffee Co.

Westrock Coffee Co. - Overview
Westrock Coffee Co. - Business segments
Westrock Coffee Co. - Key offerings
Westrock Coffee Co. - Segment focus
SWOT

16. Appendix

16.1 Scope of the report

Market definition
Objectives
Notes and caveats

16.2 Inclusions and exclusions checklist

Inclusions checklist
Exclusions checklist

16.3 Currency conversion rates for US$

16.4 Research methodology

16.5 Data procurement

Information sources

16.6 Data validation

16.7 Validation techniques employed for market sizing

16.8 Data synthesis

16.9 360 degree market analysis

16.10 List of abbreviations

Research Methodology

Technavio presents a detailed picture of the market by way of study, synthesis, and summation of data from multiple sources. The analysts have presented the various facets of the market with a particular focus on identifying the key industry influencers. The data thus presented is comprehensive, reliable, and the result of extensive research, both primary and secondary.

INFORMATION SOURCES

Primary sources

  • Manufacturers and suppliers
  • Channel partners
  • Industry experts
  • Strategic decision makers

Secondary sources

  • Industry journals and periodicals
  • Government data
  • Financial reports of key industry players
  • Historical data
  • Press releases

DATA ANALYSIS

Data Synthesis

  • Collation of data
  • Estimation of key figures
  • Analysis of derived insights

Data Validation

  • Triangulation with data models
  • Reference against proprietary databases
  • Corroboration with industry experts

REPORT WRITING

Qualitative

  • Market drivers
  • Market challenges
  • Market trends
  • Five forces analysis

Quantitative

  • Market size and forecast
  • Market segmentation
  • Geographical insights
  • Competitive landscape

Interested in this report?

Get your sample now to see our research methodology and insights!

Download Now

Frequently Asked Questions

Office Coffee Service market growth will increase by USD 3792.7 million during 2025-2029.

The Office Coffee Service market is expected to grow at a CAGR of 10.7% during 2025-2029.

Office Coffee Service market is segmented by Type (Coffee, Associated products) End-user (Large enterprises, SMEs) Service type (Subscription based, One time purchase, Managed services, Others)

American Dining Creations, Aramark, AVS Companies, Bodecker, Bunn O Matic Corp., Compass Group, Evoca Group, Farmer Bros Co., Hamilton Beach Brands Inc., JACOBS DOUWE EGBERTS PRO, Keurig Green Mountain Inc., Luigi Lavazza SPA., Nestle SA, Royal Cup Inc., Selecta Group BV, Sodexo SA, Starbucks Corp., Strauss Coffee BV, Westrock Coffee Co. are a few of the key vendors in the Office Coffee Service market.

North America will register the highest growth rate of 41.5% among the other regions. Therefore, the Office Coffee Service market in North America is expected to garner significant business opportunities for the vendors during the forecast period.

US, Canada, Mexico, Germany, UK, France, Italy, The Netherlands, Spain, China, India, Japan, Australia, South Korea, Indonesia, Brazil, Argentina, Colombia, Saudi Arabia, UAE, South Africa, Israel, Turkey

  • Increasing emphasis on employee experience and talent retention is the driving factor this market.

The Office Coffee Service market vendors should focus on grabbing business opportunities from the Type segment as it accounted for the largest market share in the base year.