Non-Alcoholic Beverages Market Analysis, Size, and Forecast 2025-2029: North America (US and Canada), Europe (France, Germany, Italy, and UK), APAC (China, India, and Japan), South America (Brazil), and Rest of World (ROW)

Non-Alcoholic Beverages Market Analysis, Size, and Forecast 2025-2029:
North America (US and Canada), Europe (France, Germany, Italy, and UK), APAC (China, India, and Japan), South America (Brazil), and Rest of World (ROW)

Published: Jun 2025 218 Pages SKU: IRTNTR80153

Market Overview at a Glance

$294.8 B
Market Opportunity
5.4%
CAGR
5.1
YoY growth 2024-2025(%)

Non-Alcoholic Beverages Market Size 2025-2029

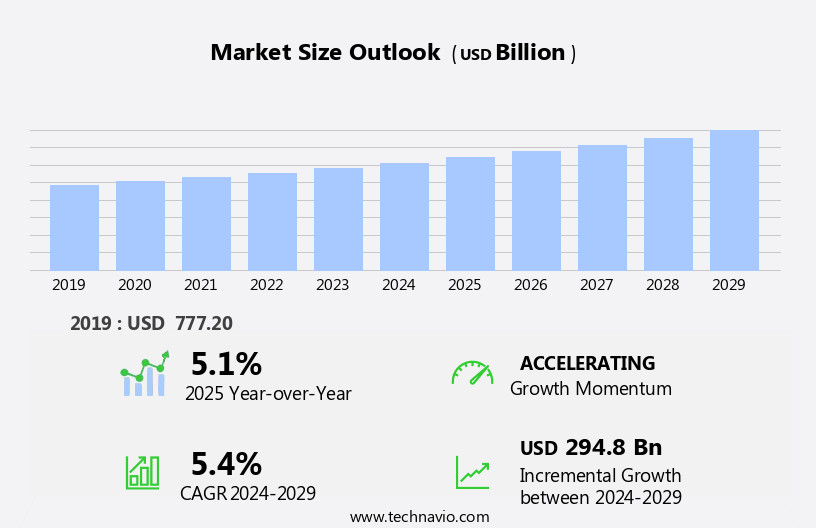
The non-alcoholic beverages market size is forecast to increase by USD 294.8 billion at a CAGR of 5.4% between 2024 and 2029.

  • The market is characterized by a dynamic business landscape, driven by several key factors. Firstly, the market witnesses frequent product launches by companies, reflecting the intense competition and innovation-driven approach. This trend underscores the importance of staying abreast of consumer preferences and trends. Secondly, there is an increased focus on sustainable packaging in the non-alcoholic beverages industry. As consumers become more environmentally conscious, companies are responding by adopting eco-friendly packaging solutions. The market also caters to various dietary preferences, with dairy-free milk alternatives and sugar substitutes gaining traction. This shift not only appeals to the growing eco-conscious consumer base but also positions brands as responsible market players. However, the market is not without challenges.
  • To counter this, non-alcoholic beverage companies must differentiate themselves by offering unique flavors, health benefits, and innovative product formats. Health and wellness trends have led to the growth of plant-based beverages, energy drinks, and ph-balanced options. The market is a vibrant and evolving industry, shaped by consumer preferences, sustainability trends, and intense competition. Companies seeking to capitalize on market opportunities must stay agile, innovative, and responsive to changing consumer demands while navigating the challenges posed by competition and shifting market dynamics.

What will be the Size of the Non-Alcoholic Beverages Market during the forecast period?

Non-Alcoholic Beverages Market Size

 Explore in-depth regional segment analysis with market size data - historical 2019-2023 and forecasts 2025-2029 - in the full report.  
Request Free Sample

The non-alcoholic beverage market is witnessing significant trends, with coffee extracts and tea extracts gaining popularity due to their rich flavors and health benefits. Responsible and ethical sourcing is a priority for retailers, leading to partnerships with suppliers who use natural extracts and fruit concentrates. Nutritional labeling and product lifecycle management are essential for meeting consumer demands and regulatory compliance. Sales forecasting and inventory management help companies optimize supply chain operations and reduce water usage. Pricing models and quality control testing ensure profitability and customer satisfaction. Sustainability initiatives, such as recycling programs and carbon footprint reduction, are crucial for minimizing environmental impact.

Herbal extracts, vegetable juices, and flavor compounds add diversity to the market. Digital and social media marketing strategies expand reach, while distribution networks and supply chain optimization streamline logistics. Health claims and sensory evaluation drive innovation, with aseptic processing, high-pressure processing, and UV sterilization ensuring product safety and shelf life. Market research and packaging innovations keep pace with consumer preferences, while energy consumption and waste management remain key areas for improvement. The competition from alcoholic beverages poses a significant threat, as consumers often perceive these as more exciting and indulgent alternatives.

How is this Non-Alcoholic Beverages Industry segmented?

The non-alcoholic beverages industry research report provides comprehensive data (region-wise segment analysis), with forecasts and estimates in "USD billion" for the period 2025-2029, as well as historical data from 2019-2023 for the following segments.

  • Type
    • Non-carbonated
    • Carbonated
  • Distribution Channel
    • Offline
    • Online
  • Packaging
    • Bottles
    • Cans
    • Tetra pak
    • Pouches
  • Geography
    • North America
      • US
      • Canada
    • Europe
      • France
      • Germany
      • Italy
      • UK
    • APAC
      • China
      • India
      • Japan
    • South America
      • Brazil
    • Rest of World (ROW)

By Type Insights

The non-carbonated segment is estimated to witness significant growth during the forecast period. The non-carbonated segment of the market is witnessing notable growth due to evolving consumer preferences towards healthier, natural drink options. Juices and juice concentrates, a significant part of this category, have gained traction among health-conscious consumers seeking alternatives to sugary sodas and alcoholic beverages. The increasing awareness of the health implications of sugar consumption and artificial ingredients is driving this trend. Consumers are now drawn to beverages perceived as more natural, with clear labels and functional benefits, which often align with ethical and environmental concerns. Innovative flavors and premium positioning have further elevated non-alcoholic beverages, making them appealing alternatives in social settings where alcohol might typically be consumed.

Pricing strategies, shelf appeal, brand loyalty, and customer segmentation are essential marketing considerations. The premium segment of the market, catering to niche demographics, highlights unique taste profiles and sustainable sourcing. Ingredient sourcing, production processes, and supply chain management are crucial elements in delivering high-quality products. The food service industry and online retailers are significant distribution channels for non-alcoholic beverages. Product innovation and consumer behavior continue to shape the market, with a focus on meeting diverse consumer needs and preferences.

Non-Alcoholic Beverages Market Size

 Download Free Sample Report

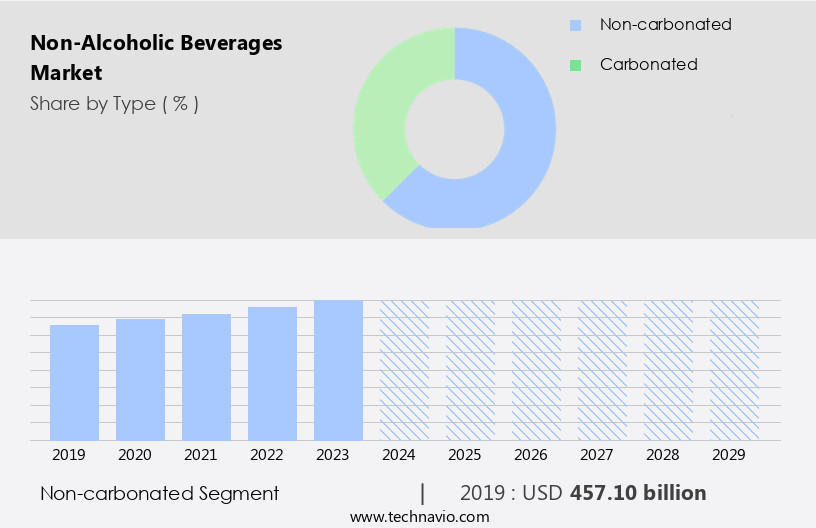
The Non-carbonated segment was valued at USD 457.10 billion in 2019 and showed a gradual increase during the forecast period.

The non-alcoholic beverages market is witnessing robust growth, driven by evolving consumer preferences and insights from consumer surveys. Brands are tapping into digital marketing to better connect with health-conscious consumers, while content marketing helps educate and engage audiences on wellness trends. Strategic retail partnerships are expanding shelf visibility and accessibility. There's a growing demand for ethically produced goods, pushing companies toward responsible sourcing practices. Simultaneously, local sourcing is gaining traction, appealing to eco-aware buyers who value community support and reduced carbon footprints.

Brand positioning plays a crucial role in the market, with many companies focusing on quality assurance and organic ingredients to cater to consumer demands. Ready-to-drink tea and coffee, sparkling water, and dairy-free milk alternatives are popular choices. Quality control and manufacturing efficiency are essential in maintaining consumer trust and ensuring product consistency. Packaging materials, shelf life, and distribution channels are also critical factors in the market. Functional beverages, including probiotic drinks and herbal infusions, are gaining popularity due to their health benefits. Consumer preferences for natural sweeteners over artificial ones have led to a decrease in the use of high-fructose corn syrup.

Regional Analysis

North America is estimated to contribute 36% to the growth of the global market during the forecast period.Technavio's analysts have elaborately explained the regional trends and drivers that shape the market during the forecast period.

Non-Alcoholic Beverages Market Share by Geography

View Free PDF Sample

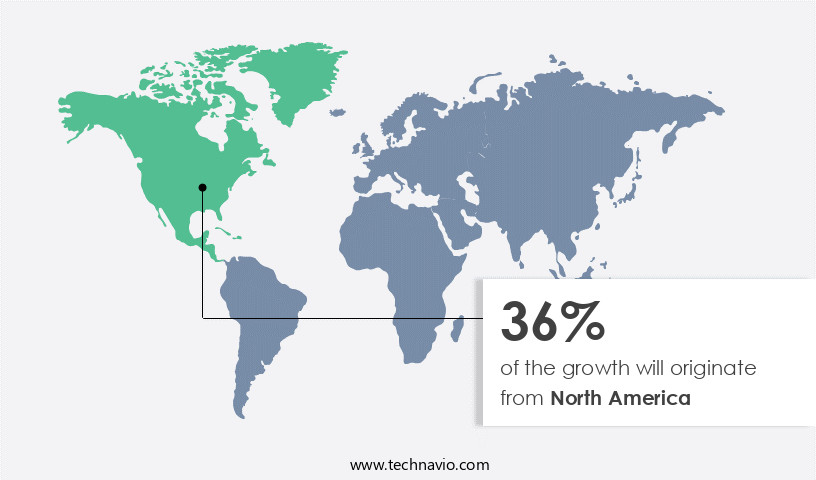
The market in North America is experiencing significant growth, driven by health-conscious consumers, particularly Millennials and Gen Z. These consumers are seeking alternatives to traditional alcoholic drinks and sugary sodas, leading to the popularity of organic juices and ready-to-drink (RTD) options. Organic juices, which offer health benefits and cater to vegans and those with lactose intolerance, have seen rapid growth. RTD options, such as cold brew coffee, energy drinks, and flavored waters, have rised in popularity due to their convenience and sophistication. Consumers value the seamless integration of these beverages into their on-the-go lifestyles.

Quality assurance and fair trade ingredients are essential for brand positioning, as consumers prioritize health and wellness. Manufacturing efficiency and production processes are crucial to meet the demand for these beverages, with bottling plants and distribution channels optimized for mass market appeal. Consumer preferences for probiotic drinks, natural sweeteners, and herbal infusions continue to influence product innovation. Packaging design, shelf appeal, and brand loyalty are essential factors in marketing campaigns, with various pricing strategies employed to cater to different customer segments. Shelf life and sugar content are critical considerations for niche markets, while ph levels and taste profiles are important for various beverage categories, including sports drinks and bottled water.

Aluminum cans and pet bottles are common packaging materials, with glass bottles used for premium segments. The food service industry and online retailers are significant distribution channels. Consummer behavior and trends shape the market, with carbonation levels, artificial sweeteners, and aroma profiles influencing consumer preferences. The market also includes energy drinks, functional beverages, and plant-based beverages, with various production processes and ingredient sourcing strategies employed to meet consumer demands.

Market Dynamics

Our researchers analyzed the data with 2024 as the base year, along with the key drivers, trends, and challenges. A holistic analysis of drivers will help companies refine their marketing strategies to gain a competitive advantage.

What are the Non-Alcoholic Beverages market drivers leading to the rise in the adoption of Industry?

  • Companies' consistent product launches serve as the primary catalyst for market growth. The market is witnessing significant growth due to increasing consumer preferences for healthier and functional drink options. Companies are responding to this trend by introducing innovative products with dairy-free milk alternatives, natural sweeteners, and functional ingredients like probiotics.
  • Parle Agro Pvt Ltd., an Indian beverage brand, recently launched Dhishoom, a jeera masala-flavored carbonated drink, expanding their product portfolio and appealing to diverse consumer tastes. These offerings cater to the mass market and prioritize nutritional value, supply chain management, and fair trade ingredients. Carbonation levels continue to be popular, with both carbonated soft drinks and functional beverages gaining traction. Marketing campaigns highlight the health benefits and unique flavors of these beverages, further driving demand.

What are the Non-Alcoholic Beverages market trends shaping the Industry?

  • Sustainable packaging is gaining significant attention in the market, with an increasing number of companies focusing on eco-friendly solutions to reduce their environmental footprint. This trend is expected to continue as consumers become more conscious of the impact of their purchases on the environment. The market is witnessing notable growth due to shifting consumer preferences towards sustainable packaging. Eco-conscious consumers are demanding more environmentally friendly options, leading beverage companies to invest in innovative, recyclable, and biodegradable solutions. For instance, plant-based bottles, aluminum cans with increased recycled content, and packaging made from ocean-bound plastics are gaining popularity. Coca-Cola, for example, has introduced 100% recyclable PET bottles, which are lighter and have a lower carbon footprint compared to glass. Brand loyalty is another crucial factor driving market growth. Consumers are drawn to brands that cater to their specific needs and preferences, such as sugar substitutes, long shelf life, and aroma profiles.
  • Sports drinks continue to dominate the market due to their association with an active lifestyle and health and wellness. Customer segmentation plays a significant role in market dynamics. Beverage companies are targeting various demographics, including children, millennials, and health-conscious individuals, with product innovation. Plant-based beverages, such as almond milk and soy milk, are gaining popularity due to their health benefits. The food service industry is also contributing to market growth, as restaurants and cafes offer a wide range of non-alcoholic beverage options. Distribution channels, including supermarkets, convenience stores, and online retailers, are expanding their offerings to meet consumer demand. Overall, the market is expected to continue growing as consumers seek out sustainable and health-conscious options.

How does Non-Alcoholic Beverages market faces challenges during its growth?

  • The growth of the industry is significantly impacted by intense competition from alcoholic beverages. Non-alcoholic beverages represent a dynamic market driven by various factors, including health consciousness and consumer preferences. Energy drinks, a popular segment, continue to gain traction due to their ability to provide an energy boost. However, ph levels and sugar content remain key considerations for consumers. Packaging design and the use of pet bottles and aluminum cans are essential elements in this market, catering to diverse consumer demographics. Ingredient sourcing and the addition of flavor enhancers are crucial aspects of product development. The non-alcoholic beverage market is a niche sector, with online retailers playing a significant role in distribution.
  • Despite the growing popularity of non-alcoholic beverages, alcoholic drinks continue to offer unique taste profiles and experiences that appeal to consumers. The complexity of flavors in alcoholic beverages, such as wines, beers, and spirits, provides a more sophisticated drinking experience. Target demographics for non-alcoholic beverages include health-conscious consumers, children, and those abstaining from alcohol for personal or religious reasons. The market is expected to remain competitive, with ongoing innovation in product development and marketing strategies.

Exclusive Customer Landscape

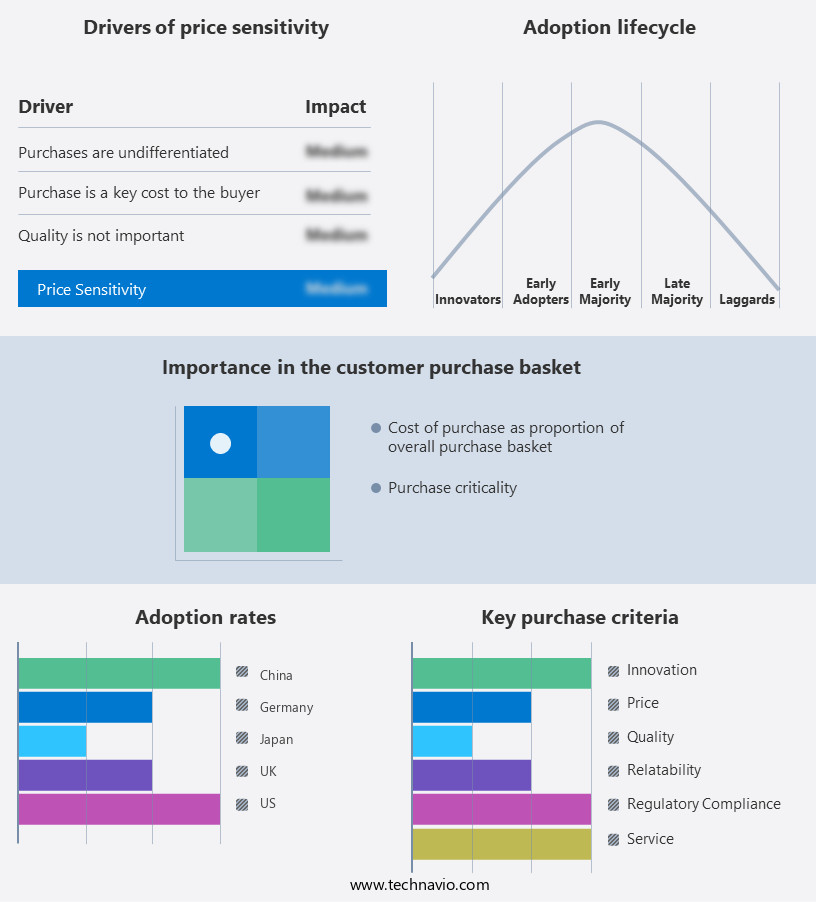
The non-alcoholic beverages market forecasting report includes the adoption lifecycle of the market, covering from the innovator's stage to the laggard's stage. It focuses on adoption rates in different regions based on penetration. Furthermore, the non-alcoholic beverages market report also includes key purchase criteria and drivers of price sensitivity to help companies evaluate and develop their market growth analysis strategies.

Non-Alcoholic Beverages Market Share by Geography

 Customer Landscape

Key Companies & Market Insights

Companies are implementing various strategies, such as strategic alliances, non-alcoholic beverages market forecast, partnerships, mergers and acquisitions, geographical expansion, and product/service launches, to enhance their presence in the industry.

ABC Fruits - The company specializes in providing a range of non-alcoholic beverage options, including fruit pulp, puree, IQF, and concentrate.

The industry research and growth report includes detailed analyses of the competitive landscape of the market and information about key companies, including:

  • ABC Fruits
  • Asahi Group Holdings Ltd.
  • Dabur India Ltd.
  • Foxtrot Beverages Pvt. Ltd
  • Ghousia Food Products Pvt. Ltd.
  • Gusto Foods
  • Keurig Dr Pepper Inc.
  • Manna Beverages and Ventures
  • National Beverage Corp.
  • Nongfu Spring Co. Ltd.
  • Ocean Spray Cranberries Inc.
  • Parle Agro Pvt Ltd.
  • PepsiCo Inc.
  • Rachels Orchard
  • Refresco Group
  • Sajeeb Corp
  • SOURCE DU PAYS S.A
  • Sun Impex International Foods LLC
  • Suntory Beverage and Food Australia Pty Ltd
  • The Coca Cola Co.

Qualitative and quantitative analysis of companies has been conducted to help clients understand the wider business environment as well as the strengths and weaknesses of key industry players. Data is qualitatively analyzed to categorize companies as pure play, category-focused, industry-focused, and diversified; it is quantitatively analyzed to categorize companies as dominant, leading, strong, tentative, and weak.

Recent Development and News in Non-Alcoholic Beverages Market

  • In January 2024, PepsiCo, a leading beverage company, introduced a new line of sugar-free, plant-based drinks called "Driftwell," targeting consumers seeking mental wellness and relaxation. This strategic move expanded PepsiCo's non-alcoholic beverage portfolio (Source: PepsiCo Press Release).
  • In March 2024, Coca-Cola and Starbucks announced a global partnership to produce and distribute ready-to-drink coffee beverages under the Starbucks brand. This collaboration aimed to strengthen both companies' presence in the non-alcoholic beverage market (Source: Coca-Cola Company Press Release).
  • In May 2024, Nestlé, the world's largest food and beverage company, acquired a controlling stake in Blue Bottle Coffee, a premium coffee roaster and retailer, for approximately USD425 million. The acquisition was part of Nestlé's strategy to expand its presence in the specialty coffee market (Source: Nestlé SA Press Release).
  • In April 2025, The Coca-Cola Company received regulatory approval from the European Commission to acquire Costa Coffee, the UK's largest coffee chain, for €3.9 billion. This acquisition was expected to significantly boost Coca-Cola's presence in the European coffee market (Source: European Commission Press Release).

Research Analyst Overview

The market continues to evolve, with dynamic market activities unfolding across various sectors. Calorie content and nutritional value remain key considerations for consumers, driving innovation in flavored water, juice drinks, ready-to-drink tea, and coffee. The premium segment, with its focus on quality assurance and organic ingredients, is gaining traction. Shelf life and packaging materials are crucial factors in the production processes of ready-to-drink beverages, with glass bottles and aluminum cans offering distinct advantages. Manufacturing efficiency and supply chain management are essential for mass market players, while fair trade ingredients and sustainable sourcing cater to niche markets. Consumer preferences for sugar substitutes, natural or artificial, influence pricing strategies and marketing campaigns.

Carbonation levels, ph levels, and taste profiles are critical elements in the development of carbonated soft drinks, sparkling water, and energy drinks. Probiotic drinks and herbal infusions cater to the health and wellness trend. Product innovation in plant-based beverages and dairy-free milk alternatives is a significant area of growth. Consumer behavior shapes distribution channels, with food service industry partnerships and online retailers gaining prominence. The ongoing evolution of the market reflects the industry's commitment to meeting diverse consumer demands and preferences.

Dive into Technavio's robust research methodology, blending expert interviews, extensive data synthesis, and validated models for unparalleled Non-Alcoholic Beverages Market insights. See full methodology.

Market Scope

Report Coverage

Details

Page number

218

Base year

2024

Historic period

2019-2023

Forecast period

2025-2029

Growth momentum & CAGR

Accelerate at a CAGR of 5.4%

Market growth 2025-2029

USD 294.8 billion

Market structure

Fragmented

YoY growth 2024-2025(%)

5.1

Key countries

US, China, Germany, Canada, India, UK, France, Italy, Brazil, and Japan

Competitive landscape

Leading Companies, Market Positioning of Companies, Competitive Strategies, and Industry Risks

Request Free Sample

What are the Key Data Covered in this Non-Alcoholic Beverages Market Research and Growth Report?

  • CAGR of the Non-Alcoholic Beverages industry during the forecast period
  • Detailed information on factors that will drive the growth and forecasting between 2025 and 2029
  • Precise estimation of the size of the market and its contribution of the industry in focus to the parent market
  • Accurate predictions about upcoming growth and trends and changes in consumer behaviour
  • Growth of the market across North America, Europe, APAC, South America, and Middle East and Africa
  • Thorough analysis of the market's competitive landscape and detailed information about companies
  • Comprehensive analysis of factors that will challenge the non-alcoholic beverages market growth of industry companies

We can help! Our analysts can customize this non-alcoholic beverages market research report to meet your requirements.

Get in touch

1 Executive Summary

  • 1.1 Market overview
    • Executive Summary - Chart on Market Overview
    • Executive Summary - Data Table on Market Overview
    • Executive Summary - Chart on Global Market Characteristics
    • Executive Summary - Chart on Market by Geography
    • Executive Summary - Chart on Market Segmentation by Type
    • Executive Summary - Chart on Market Segmentation by Distribution Channel
    • Executive Summary - Chart on Market Segmentation by Packaging
    • Executive Summary - Chart on Incremental Growth
    • Executive Summary - Data Table on Incremental Growth
    • Executive Summary - Chart on Company Market Positioning

2 Technavio Analysis

  • 2.1 Analysis of price sensitivity, lifecycle, customer purchase basket, adoption rates, and purchase criteria
    • Analysis of price sensitivity, lifecycle, customer purchase basket, adoption rates, and purchase criteria
  • 2.2 Criticality of inputs and Factors of differentiation
    • Overview on criticality of inputs and factors of differentiation
  • 2.3 Factors of disruption
    • Overview on factors of disruption
  • 2.4 Impact of drivers and challenges
    • Impact of drivers and challenges in 2024 and 2029

3 Market Landscape

  • 3.1 Market ecosystem
    • Parent Market
    • Data Table on - Parent Market
  • 3.2 Market characteristics
    • Market characteristics analysis
  • 3.3 Value chain analysis
    • Value chain analysis

4 Market Sizing

  • 4.1 Market definition
    • Offerings of companies included in the market definition
  • 4.2 Market segment analysis
    • Market segments
  • 4.3 Market size 2024
    • 4.4 Market outlook: Forecast for 2024-2029
      • Chart on Global - Market size and forecast 2024-2029 ($ billion)
      • Data Table on Global - Market size and forecast 2024-2029 ($ billion)
      • Chart on Global Market: Year-over-year growth 2024-2029 (%)
      • Data Table on Global Market: Year-over-year growth 2024-2029 (%)

    5 Historic Market Size

    • 5.1 Global Non-Alcoholic Beverages Market 2019 - 2023
      • Historic Market Size - Data Table on Global Non-Alcoholic Beverages Market 2019 - 2023 ($ billion)
    • 5.2 Type segment analysis 2019 - 2023
      • Historic Market Size - Type Segment 2019 - 2023 ($ billion)
    • 5.3 Distribution Channel segment analysis 2019 - 2023
      • Historic Market Size - Distribution Channel Segment 2019 - 2023 ($ billion)
    • 5.4 Packaging segment analysis 2019 - 2023
      • Historic Market Size - Packaging Segment 2019 - 2023 ($ billion)
    • 5.5 Geography segment analysis 2019 - 2023
      • Historic Market Size - Geography Segment 2019 - 2023 ($ billion)
    • 5.6 Country segment analysis 2019 - 2023
      • Historic Market Size - Country Segment 2019 - 2023 ($ billion)

    6 Qualitative Analysis

    • 6.1 The AI impact on global non-alcoholic beverages market

      7 Five Forces Analysis

      • 7.1 Five forces summary
        • Five forces analysis - Comparison between 2024 and 2029
      • 7.2 Bargaining power of buyers
        • Bargaining power of buyers - Impact of key factors 2024 and 2029
      • 7.3 Bargaining power of suppliers
        • Bargaining power of suppliers - Impact of key factors in 2024 and 2029
      • 7.4 Threat of new entrants
        • Threat of new entrants - Impact of key factors in 2024 and 2029
      • 7.5 Threat of substitutes
        • Threat of substitutes - Impact of key factors in 2024 and 2029
      • 7.6 Threat of rivalry
        • Threat of rivalry - Impact of key factors in 2024 and 2029
      • 7.7 Market condition
        • Chart on Market condition - Five forces 2024 and 2029

      8 Market Segmentation by Type

      • 8.1 Market segments
        • Chart on Type - Market share 2024-2029 (%)
        • Data Table on Type - Market share 2024-2029 (%)
      • 8.2 Comparison by Type
        • Chart on Comparison by Type
        • Data Table on Comparison by Type
      • 8.3 Non-carbonated - Market size and forecast 2024-2029
        • Chart on Non-carbonated - Market size and forecast 2024-2029 ($ billion)
        • Data Table on Non-carbonated - Market size and forecast 2024-2029 ($ billion)
        • Chart on Non-carbonated - Year-over-year growth 2024-2029 (%)
        • Data Table on Non-carbonated - Year-over-year growth 2024-2029 (%)
      • 8.4 Carbonated - Market size and forecast 2024-2029
        • Chart on Carbonated - Market size and forecast 2024-2029 ($ billion)
        • Data Table on Carbonated - Market size and forecast 2024-2029 ($ billion)
        • Chart on Carbonated - Year-over-year growth 2024-2029 (%)
        • Data Table on Carbonated - Year-over-year growth 2024-2029 (%)
      • 8.5 Market opportunity by Type
        • Market opportunity by Type ($ billion)
        • Data Table on Market opportunity by Type ($ billion)

      9 Market Segmentation by Distribution Channel

      • 9.1 Market segments
        • Chart on Distribution Channel - Market share 2024-2029 (%)
        • Data Table on Distribution Channel - Market share 2024-2029 (%)
      • 9.2 Comparison by Distribution Channel
        • Chart on Comparison by Distribution Channel
        • Data Table on Comparison by Distribution Channel
      • 9.3 Offline - Market size and forecast 2024-2029
        • Chart on Offline - Market size and forecast 2024-2029 ($ billion)
        • Data Table on Offline - Market size and forecast 2024-2029 ($ billion)
        • Chart on Offline - Year-over-year growth 2024-2029 (%)
        • Data Table on Offline - Year-over-year growth 2024-2029 (%)
      • 9.4 Online - Market size and forecast 2024-2029
        • Chart on Online - Market size and forecast 2024-2029 ($ billion)
        • Data Table on Online - Market size and forecast 2024-2029 ($ billion)
        • Chart on Online - Year-over-year growth 2024-2029 (%)
        • Data Table on Online - Year-over-year growth 2024-2029 (%)
      • 9.5 Market opportunity by Distribution Channel
        • Market opportunity by Distribution Channel ($ billion)
        • Data Table on Market opportunity by Distribution Channel ($ billion)

      10 Market Segmentation by Packaging

      • 10.1 Market segments
        • Chart on Packaging - Market share 2024-2029 (%)
        • Data Table on Packaging - Market share 2024-2029 (%)
      • 10.2 Comparison by Packaging
        • Chart on Comparison by Packaging
        • Data Table on Comparison by Packaging
      • 10.3 Bottles - Market size and forecast 2024-2029
        • Chart on Bottles - Market size and forecast 2024-2029 ($ billion)
        • Data Table on Bottles - Market size and forecast 2024-2029 ($ billion)
        • Chart on Bottles - Year-over-year growth 2024-2029 (%)
        • Data Table on Bottles - Year-over-year growth 2024-2029 (%)
      • 10.4 Cans - Market size and forecast 2024-2029
        • Chart on Cans - Market size and forecast 2024-2029 ($ billion)
        • Data Table on Cans - Market size and forecast 2024-2029 ($ billion)
        • Chart on Cans - Year-over-year growth 2024-2029 (%)
        • Data Table on Cans - Year-over-year growth 2024-2029 (%)
      • 10.5 Tetra pak - Market size and forecast 2024-2029
        • Chart on Tetra pak - Market size and forecast 2024-2029 ($ billion)
        • Data Table on Tetra pak - Market size and forecast 2024-2029 ($ billion)
        • Chart on Tetra pak - Year-over-year growth 2024-2029 (%)
        • Data Table on Tetra pak - Year-over-year growth 2024-2029 (%)
      • 10.6 Pouches - Market size and forecast 2024-2029
        • Chart on Pouches - Market size and forecast 2024-2029 ($ billion)
        • Data Table on Pouches - Market size and forecast 2024-2029 ($ billion)
        • Chart on Pouches - Year-over-year growth 2024-2029 (%)
        • Data Table on Pouches - Year-over-year growth 2024-2029 (%)
      • 10.7 Market opportunity by Packaging
        • Market opportunity by Packaging ($ billion)
        • Data Table on Market opportunity by Packaging ($ billion)

      11 Customer Landscape

      • 11.1 Customer landscape overview
        • Analysis of price sensitivity, lifecycle, customer purchase basket, adoption rates, and purchase criteria

      12 Geographic Landscape

      • 12.1 Geographic segmentation
        • Chart on Market share by geography 2024-2029 (%)
        • Data Table on Market share by geography 2024-2029 (%)
      • 12.2 Geographic comparison
        • Chart on Geographic comparison
        • Data Table on Geographic comparison
      • 12.3 North America - Market size and forecast 2024-2029
        • Chart on North America - Market size and forecast 2024-2029 ($ billion)
        • Data Table on North America - Market size and forecast 2024-2029 ($ billion)
        • Chart on North America - Year-over-year growth 2024-2029 (%)
        • Data Table on North America - Year-over-year growth 2024-2029 (%)
      • 12.4 Europe - Market size and forecast 2024-2029
        • Chart on Europe - Market size and forecast 2024-2029 ($ billion)
        • Data Table on Europe - Market size and forecast 2024-2029 ($ billion)
        • Chart on Europe - Year-over-year growth 2024-2029 (%)
        • Data Table on Europe - Year-over-year growth 2024-2029 (%)
      • 12.5 APAC - Market size and forecast 2024-2029
        • Chart on APAC - Market size and forecast 2024-2029 ($ billion)
        • Data Table on APAC - Market size and forecast 2024-2029 ($ billion)
        • Chart on APAC - Year-over-year growth 2024-2029 (%)
        • Data Table on APAC - Year-over-year growth 2024-2029 (%)
      • 12.6 South America - Market size and forecast 2024-2029
        • Chart on South America - Market size and forecast 2024-2029 ($ billion)
        • Data Table on South America - Market size and forecast 2024-2029 ($ billion)
        • Chart on South America - Year-over-year growth 2024-2029 (%)
        • Data Table on South America - Year-over-year growth 2024-2029 (%)
      • 12.7 Middle East and Africa - Market size and forecast 2024-2029
        • Chart on Middle East and Africa - Market size and forecast 2024-2029 ($ billion)
        • Data Table on Middle East and Africa - Market size and forecast 2024-2029 ($ billion)
        • Chart on Middle East and Africa - Year-over-year growth 2024-2029 (%)
        • Data Table on Middle East and Africa - Year-over-year growth 2024-2029 (%)
      • 12.8 US - Market size and forecast 2024-2029
        • Chart on US - Market size and forecast 2024-2029 ($ billion)
        • Data Table on US - Market size and forecast 2024-2029 ($ billion)
        • Chart on US - Year-over-year growth 2024-2029 (%)
        • Data Table on US - Year-over-year growth 2024-2029 (%)
      • 12.9 China - Market size and forecast 2024-2029
        • Chart on China - Market size and forecast 2024-2029 ($ billion)
        • Data Table on China - Market size and forecast 2024-2029 ($ billion)
        • Chart on China - Year-over-year growth 2024-2029 (%)
        • Data Table on China - Year-over-year growth 2024-2029 (%)
      • 12.10 Germany - Market size and forecast 2024-2029
        • Chart on Germany - Market size and forecast 2024-2029 ($ billion)
        • Data Table on Germany - Market size and forecast 2024-2029 ($ billion)
        • Chart on Germany - Year-over-year growth 2024-2029 (%)
        • Data Table on Germany - Year-over-year growth 2024-2029 (%)
      • 12.11 Canada - Market size and forecast 2024-2029
        • Chart on Canada - Market size and forecast 2024-2029 ($ billion)
        • Data Table on Canada - Market size and forecast 2024-2029 ($ billion)
        • Chart on Canada - Year-over-year growth 2024-2029 (%)
        • Data Table on Canada - Year-over-year growth 2024-2029 (%)
      • 12.12 India - Market size and forecast 2024-2029
        • Chart on India - Market size and forecast 2024-2029 ($ billion)
        • Data Table on India - Market size and forecast 2024-2029 ($ billion)
        • Chart on India - Year-over-year growth 2024-2029 (%)
        • Data Table on India - Year-over-year growth 2024-2029 (%)
      • 12.13 UK - Market size and forecast 2024-2029
        • Chart on UK - Market size and forecast 2024-2029 ($ billion)
        • Data Table on UK - Market size and forecast 2024-2029 ($ billion)
        • Chart on UK - Year-over-year growth 2024-2029 (%)
        • Data Table on UK - Year-over-year growth 2024-2029 (%)
      • 12.14 France - Market size and forecast 2024-2029
        • Chart on France - Market size and forecast 2024-2029 ($ billion)
        • Data Table on France - Market size and forecast 2024-2029 ($ billion)
        • Chart on France - Year-over-year growth 2024-2029 (%)
        • Data Table on France - Year-over-year growth 2024-2029 (%)
      • 12.15 Italy - Market size and forecast 2024-2029
        • Chart on Italy - Market size and forecast 2024-2029 ($ billion)
        • Data Table on Italy - Market size and forecast 2024-2029 ($ billion)
        • Chart on Italy - Year-over-year growth 2024-2029 (%)
        • Data Table on Italy - Year-over-year growth 2024-2029 (%)
      • 12.16 Brazil - Market size and forecast 2024-2029
        • Chart on Brazil - Market size and forecast 2024-2029 ($ billion)
        • Data Table on Brazil - Market size and forecast 2024-2029 ($ billion)
        • Chart on Brazil - Year-over-year growth 2024-2029 (%)
        • Data Table on Brazil - Year-over-year growth 2024-2029 (%)
      • 12.17 Japan - Market size and forecast 2024-2029
        • Chart on Japan - Market size and forecast 2024-2029 ($ billion)
        • Data Table on Japan - Market size and forecast 2024-2029 ($ billion)
        • Chart on Japan - Year-over-year growth 2024-2029 (%)
        • Data Table on Japan - Year-over-year growth 2024-2029 (%)
      • 12.18 Market opportunity by geography
        • Market opportunity by geography ($ billion)
        • Data Tables on Market opportunity by geography ($ billion)

      13 Drivers, Challenges, and Opportunity/Restraints

      • 13.1 Market drivers
        • 13.2 Market challenges
          • 13.3 Impact of drivers and challenges
            • Impact of drivers and challenges in 2024 and 2029
          • 13.4 Market opportunities/restraints

            14 Competitive Landscape

            • 14.1 Overview
              • 14.2 Competitive Landscape
                • Overview on criticality of inputs and factors of differentiation
              • 14.3 Landscape disruption
                • Overview on factors of disruption
              • 14.4 Industry risks
                • Impact of key risks on business

              15 Competitive Analysis

              • 15.1 Companies profiled
                • Companies covered
              • 15.2 Company ranking index
                • Company ranking index
              • 15.3 Market positioning of companies
                • Matrix on companies position and classification
              • 15.4 ABC Fruits
                • ABC Fruits - Overview
                • ABC Fruits - Product / Service
                • ABC Fruits - Key offerings
                • SWOT
              • 15.5 Asahi Group Holdings Ltd.
                • Asahi Group Holdings Ltd. - Overview
                • Asahi Group Holdings Ltd. - Business segments
                • Asahi Group Holdings Ltd. - Key news
                • Asahi Group Holdings Ltd. - Key offerings
                • Asahi Group Holdings Ltd. - Segment focus
                • SWOT
              • 15.6 Dabur India Ltd.
                • Dabur India Ltd. - Overview
                • Dabur India Ltd. - Business segments
                • Dabur India Ltd. - Key news
                • Dabur India Ltd. - Key offerings
                • Dabur India Ltd. - Segment focus
                • SWOT
              • 15.7 Foxtrot Beverages Pvt. Ltd
                • Foxtrot Beverages Pvt. Ltd - Overview
                • Foxtrot Beverages Pvt. Ltd - Product / Service
                • Foxtrot Beverages Pvt. Ltd - Key offerings
                • SWOT
              • 15.8 Ghousia Food Products Pvt. Ltd.
                • Ghousia Food Products Pvt. Ltd. - Overview
                • Ghousia Food Products Pvt. Ltd. - Product / Service
                • Ghousia Food Products Pvt. Ltd. - Key offerings
                • SWOT
              • 15.9 Keurig Dr Pepper Inc.
                • Keurig Dr Pepper Inc. - Overview
                • Keurig Dr Pepper Inc. - Business segments
                • Keurig Dr Pepper Inc. - Key offerings
                • Keurig Dr Pepper Inc. - Segment focus
                • SWOT
              • 15.10 National Beverage Corp.
                • National Beverage Corp. - Overview
                • National Beverage Corp. - Product / Service
                • National Beverage Corp. - Key offerings
                • SWOT
              • 15.11 Nongfu Spring Co. Ltd.
                • Nongfu Spring Co. Ltd. - Overview
                • Nongfu Spring Co. Ltd. - Business segments
                • Nongfu Spring Co. Ltd. - Key offerings
                • Nongfu Spring Co. Ltd. - Segment focus
                • SWOT
              • 15.12 Ocean Spray Cranberries Inc.
                • Ocean Spray Cranberries Inc. - Overview
                • Ocean Spray Cranberries Inc. - Product / Service
                • Ocean Spray Cranberries Inc. - Key offerings
                • SWOT
              • 15.13 PepsiCo Inc.
                • PepsiCo Inc. - Overview
                • PepsiCo Inc. - Business segments
                • PepsiCo Inc. - Key news
                • PepsiCo Inc. - Key offerings
                • PepsiCo Inc. - Segment focus
                • SWOT
              • 15.14 Refresco Group
                • Refresco Group - Overview
                • Refresco Group - Product / Service
                • Refresco Group - Key news
                • Refresco Group - Key offerings
                • SWOT
              • 15.15 SOURCE DU PAYS S.A
                • SOURCE DU PAYS S.A - Overview
                • SOURCE DU PAYS S.A - Product / Service
                • SOURCE DU PAYS S.A - Key offerings
                • SWOT
              • 15.16 Sun Impex International Foods LLC
                • Sun Impex International Foods LLC - Overview
                • Sun Impex International Foods LLC - Product / Service
                • Sun Impex International Foods LLC - Key offerings
                • SWOT
              • 15.17 Suntory Beverage and Food Australia Pty Ltd
                • Suntory Beverage and Food Australia Pty Ltd - Overview
                • Suntory Beverage and Food Australia Pty Ltd - Product / Service
                • Suntory Beverage and Food Australia Pty Ltd - Key offerings
                • SWOT
              • 15.18 The Coca Cola Co.
                • The Coca Cola Co. - Overview
                • The Coca Cola Co. - Business segments
                • The Coca Cola Co. - Key news
                • The Coca Cola Co. - Key offerings
                • The Coca Cola Co. - Segment focus
                • SWOT

              16 Appendix

              • 16.1 Scope of the report
                • 16.2 Inclusions and exclusions checklist
                  • Inclusions checklist
                  • Exclusions checklist
                • 16.3 Currency conversion rates for US$
                  • Currency conversion rates for US$
                • 16.4 Research methodology
                  • Research methodology
                • 16.5 Data procurement
                  • Information sources
                • 16.6 Data validation
                  • Data validation
                • 16.7 Validation techniques employed for market sizing
                  • Validation techniques employed for market sizing
                • 16.8 Data synthesis
                  • Data synthesis
                • 16.9 360 degree market analysis
                  • 360 degree market analysis
                • 16.10 List of abbreviations
                  • List of abbreviations

                Research Methodology

                Technavio presents a detailed picture of the market by way of study, synthesis, and summation of data from multiple sources. The analysts have presented the various facets of the market with a particular focus on identifying the key industry influencers. The data thus presented is comprehensive, reliable, and the result of extensive research, both primary and secondary.

                INFORMATION SOURCES

                Primary sources

                • Manufacturers and suppliers
                • Channel partners
                • Industry experts
                • Strategic decision makers

                Secondary sources

                • Industry journals and periodicals
                • Government data
                • Financial reports of key industry players
                • Historical data
                • Press releases

                DATA ANALYSIS

                Data Synthesis

                • Collation of data
                • Estimation of key figures
                • Analysis of derived insights

                Data Validation

                • Triangulation with data models
                • Reference against proprietary databases
                • Corroboration with industry experts

                REPORT WRITING

                Qualitative

                • Market drivers
                • Market challenges
                • Market trends
                • Five forces analysis

                Quantitative

                • Market size and forecast
                • Market segmentation
                • Geographical insights
                • Competitive landscape

                Interested in this report?

                Get your sample now to see our research methodology and insights!

                Download Now

                Frequently Asked Questions

                Non-Alcoholic Beverages market growth will increase by $ 294.8 bn during 2025-2029.

                The Non-Alcoholic Beverages market is expected to grow at a CAGR of 5.4% during 2025-2029.

                Non-Alcoholic Beverages market is segmented by Type( Non-carbonated, Carbonated) Distribution Channel( Offline, Online) Packaging( Bottles, Cans, Tetra pak, Pouches, Middle East and Africa)

                ABC Fruits, Asahi Group Holdings Ltd., Dabur India Ltd., Foxtrot Beverages Pvt. Ltd, Ghousia Food Products Pvt. Ltd., Gusto Foods, Keurig Dr Pepper Inc., Manna Beverages and Ventures, National Beverage Corp., Nongfu Spring Co. Ltd., Ocean Spray Cranberries Inc., Parle Agro Pvt Ltd., PepsiCo Inc., Rachels Orchard, Refresco Group, Sajeeb Corp, SOURCE DU PAYS S.A, Sun Impex International Foods LLC, Suntory Beverage and Food Australia Pty Ltd, The Coca Cola Co. are a few of the key vendors in the Non-Alcoholic Beverages market.

                North America will register the highest growth rate of 36% among the other regions. Therefore, the Non-Alcoholic Beverages market in North America is expected to garner significant business opportunities for the vendors during the forecast period.

                US, China, Germany, Canada, India, UK, France, Italy, Brazil, Japan

                • Frequent product launches by companiesCompanies in the global non-alcoholic beverages market are increasingly focusing on product launches to drive market growth and meet evolving consumer preferences. These new offerings often feature innovative flavors is the driving factor this market.
                • functional ingredients is the driving factor this market.
                • and healthier formulations to appeal to health-conscious consumers. By introducing products like plant-based alternatives is the driving factor this market.
                • zero-sugar options is the driving factor this market.
                • and beverages with added vitamins or probiotics is the driving factor this market.
                • companies are expanding their product portfolios and attracting a wider customer base. Some of the recent launches are mentioned below: In May 2024 is the driving factor this market.
                • Parle Agro Pvt Ltd. is the driving factor this market.
                • an Indian beverage brand is the driving factor this market.
                • introduced Dhishoom is the driving factor this market.
                • a jeera masala-flavored carbonated drink is the driving factor this market.
                • across the nation. With the product launch is the driving factor this market.
                • Parle Agro focuses on becoming a national brand in this category. In March 2024 is the driving factor this market.
                • Louis Dreyfus Company (LDC) announced the exclusive launch of its new fresh fruit juice brand is the driving factor this market.
                • Montebelo Brasil is the driving factor this market.
                • in the French market. This initiative was in collaboration with Laiterie de Saint-Denis-de-l Hotel (LSDH) for commercialization is the driving factor this market.
                • bottling is the driving factor this market.
                • and distribution. Such strategies help companies differentiate themselves in a competitive market and address growing demands for variety is the driving factor this market.
                • nutrition is the driving factor this market.
                • and sustainability in non-alcoholic beverages. As a result is the driving factor this market.
                • these product launches are significantly contributing to the overall expansion and diversification of the global non-alcoholic beverages market during the forecast period. is the driving factor this market.

                The Non-Alcoholic Beverages market vendors should focus on grabbing business opportunities from the Non-carbonated segment as it accounted for the largest market share in the base year.