Nanobatteries Market Analysis, Size, and Forecast 2026-2030: North America (US, Canada, and Mexico), Europe (Germany, France, and UK), APAC (China, Japan, and South Korea), Middle East and Africa (South Africa, UAE, and Saudi Arabia), South America (Brazil and Argentina), and Rest of World (ROW)

Nanobatteries Market Analysis, Size, and Forecast 2026-2030:
North America (US, Canada, and Mexico), Europe (Germany, France, and UK), APAC (China, Japan, and South Korea), Middle East and Africa (South Africa, UAE, and Saudi Arabia), South America (Brazil and Argentina), and Rest of World (ROW)

Published: Jan 2026 282 Pages SKU: IRTNTR72462

Market Overview at a Glance

$2.98 B
Market Opportunity
20.6%
CAGR 2025 - 2030
38.4%
North America Growth
$863.4 Mn
Nanophosphate segment 2024

Nanobatteries Market Size 2026-2030

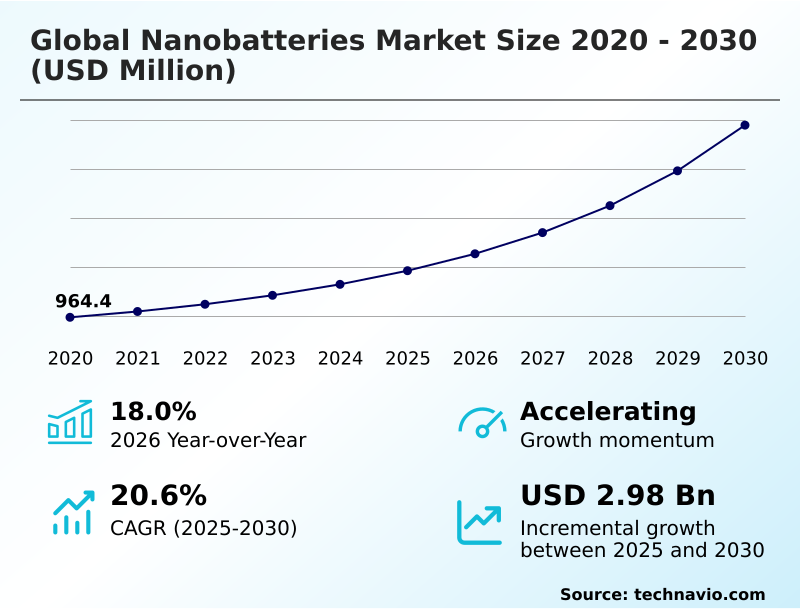
The nanobatteries market size is valued to increase by USD 2.98 billion, at a CAGR of 20.6% from 2025 to 2030. Fast charging and high power will drive the nanobatteries market.

Major Market Trends & Insights

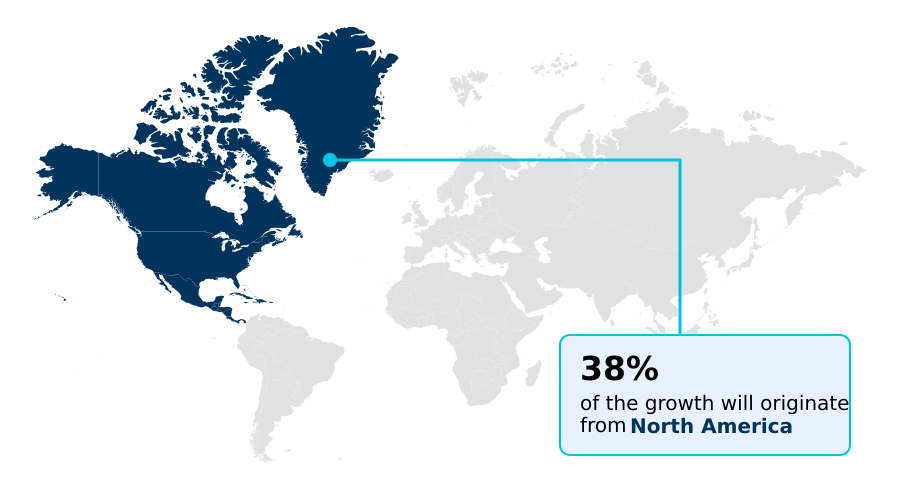
  • North America dominated the market and accounted for a 38.4% growth during the forecast period.
  • By Technology - Nanophosphate segment was valued at USD 863.4 million in 2024
  • By Type - Lithium nanobatteries segment accounted for the largest market revenue share in 2024

Market Size & Forecast

  • Market Opportunities: USD 3.93 billion
  • Market Future Opportunities: USD 2.98 billion
  • CAGR from 2025 to 2030 : 20.6%

Market Summary

  • The nanobatteries market is foundational to the global transition toward advanced energy storage, serving as a critical enabler for electric transportation, grid modernization, and high-performance electronics. Market momentum is sustained by the persistent need for solutions offering fast charging and high power density, which address the core limitations of conventional batteries.
  • An escalating trend is the integration of these technologies into electric vehicles and a new generation of consumer devices that demand slimmer profiles and longer operational lives. These advancements are essential for achieving breakthroughs in both performance and design.
  • However, the industry grapples with the high costs of production tied to intricate nanoscale fabrication processes and the use of rare precursor materials.
  • For instance, a key operational challenge for manufacturers is managing a complex global supply chain to secure a stable, cost-effective supply of these specialized materials, which is essential for maintaining production continuity and competitive pricing in a rapidly expanding market.

What will be the Size of the Nanobatteries Market during the forecast period?

Get Key Insights on Market Forecast (PDF) Request Free Sample

How is the Nanobatteries Market Segmented?

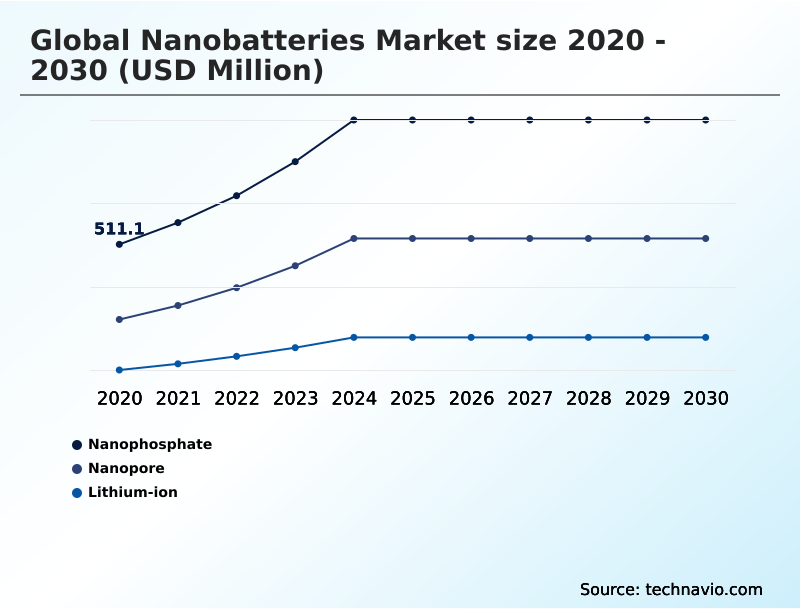
The nanobatteries industry research report provides comprehensive data (region-wise segment analysis), with forecasts and estimates in "USD million" for the period 2026-2030, as well as historical data from 2020-2024 for the following segments.

  • Technology
    • Nanophosphate
    • Nanopore
    • Lithium-ion
  • Type
    • Lithium nanobatteries
    • Graphene nanobatteries
    • Others
  • Application
    • Consumer electronics
    • Electric vehicles
    • Renewable energy storage and grid solutions
  • Geography
    • North America
      • US
      • Canada
      • Mexico
    • Europe
      • Germany
      • France
      • UK
    • APAC
      • China
      • Japan
      • South Korea
    • Middle East and Africa
      • South Africa
      • UAE
      • Saudi Arabia
    • South America
      • Brazil
      • Argentina
    • Rest of World (ROW)

By Technology Insights

The nanophosphate segment is estimated to witness significant growth during the forecast period.

The nanophosphate segment is critical to market expansion, leveraging advanced lithium iron phosphate chemistries. These nanophosphate cathodes are engineered for superior thermal management and exceptional abuse tolerance, making them ideal for high-power applications where safety is paramount.

The technology delivers high power density and an extended cycle life, with systems retaining over 80% capacity after thousands of cycles. Integrated with advanced battery management, these batteries optimize performance in demanding environments like grid-scale systems and electric vehicles.

Unlike some lithium nanobatteries or graphene nanobatteries, their stability reduces fire risks in high-capacity battery packs and pouch cells, driving adoption in the broader energy storage system landscape.

Request Free Sample

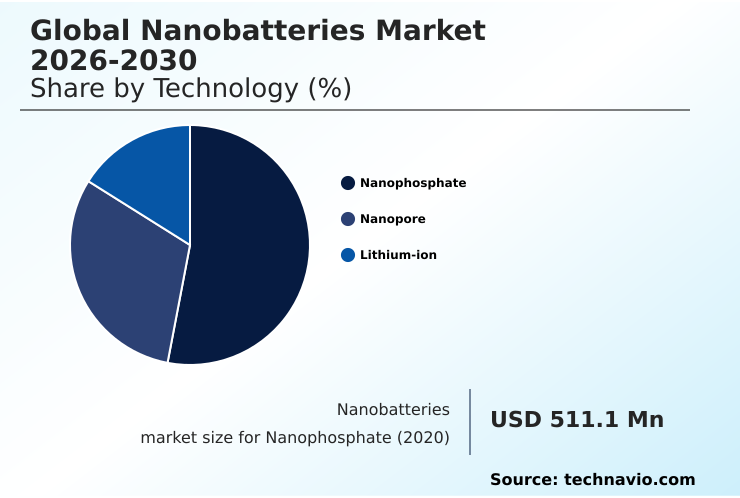
The Nanophosphate segment was valued at USD 863.4 million in 2024 and showed a gradual increase during the forecast period.

Request Free Sample

Regional Analysis

North America is estimated to contribute 38.4% to the growth of the global market during the forecast period.Technavio’s analysts have elaborately explained the regional trends and drivers that shape the market during the forecast period.

See How Nanobatteries Market Demand is Rising in North America Request Free Sample

North America and APAC are key regions shaping the market landscape, with North America representing 38% of the growth opportunity, driven by electrification and grid modernization.

This region focuses on advanced nanomaterials and silicon-dominant anode materials to boost lithium-ion battery performance. Meanwhile, APAC is the fastest-growing region, capitalizing on its manufacturing strength to produce nano-engineered electrodes and 4680 cylindrical cells at scale.

The regional push for cobalt-free chemistries is driving innovation in materials like nanophosphate cathodes to achieve high coulombic efficiency and improve volumetric energy density.

This geographic dynamism, with each region specializing in different aspects of the value chain, is accelerating market expansion globally.

Market Dynamics

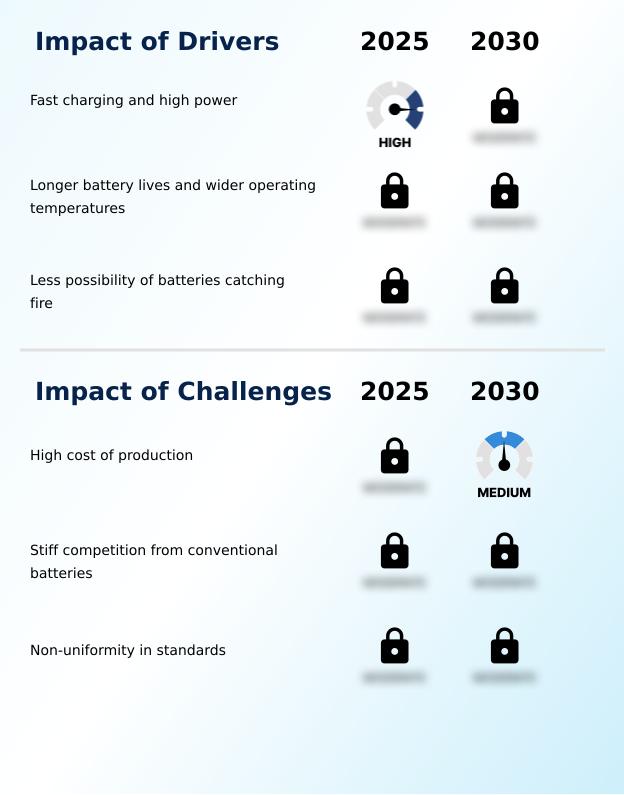
Our researchers analyzed the data with 2025 as the base year, along with the key drivers, trends, and challenges. A holistic analysis of drivers will help companies refine their marketing strategies to gain a competitive advantage.

  • The global push for enhanced nanobatteries for electric vehicle range is accelerating research into silicon anode nanobattery performance metrics and compelling advancements in nanobattery thermal management solutions.
  • As high power density nanobattery applications expand beyond automotive into aerospace and drone applications, the focus on safety intensifies, highlighting solid-state nanobattery safety advantages and driving innovation in dendrite formation suppression in lithium nanobatteries. The development of fast charging nanobattery for consumer electronics continues to be a major driver, pushing for volumetric efficiency gains in silicon nanobatteries.
  • Simultaneously, nanobattery applications in grid storage demand improvements in nanobattery cycle life extension techniques and unique chemistries, such as those seen in graphene nanobattery energy density improvements and cobalt-free nanobattery chemistry development. Addressing these diverse requirements hinges on overcoming manufacturing hurdles.
  • The industry is focused on nanobattery production cost reduction strategies, which include nanoscale fabrication process yield optimization and scaling techniques like atomic layer deposition for nanobattery electrodes.
  • The impact of gigafactory investments on nanobatteries is significant, but managing the complex supply chain for nanobattery precursor materials remains a critical operational challenge, with some firms reporting up to 15% fewer safety incidents through better integration of advanced battery management for nanobatteries compared to legacy systems.

What are the key market drivers leading to the rise in the adoption of Nanobatteries Industry?

  • Fast charging capabilities and high-power delivery are key drivers accelerating the adoption of advanced nanobattery technologies across the electric vehicle, consumer electronics, and industrial sectors.

  • The market is significantly driven by demand for extreme fast charging and high power capabilities. Advanced nanoscale architectures featuring innovative nanoscale components facilitate unprecedented ion diffusion rates, enabling charge times of under 10 minutes.
  • Technologies like carbon silicon anodes and lithium titanate nanostructured batteries are central to these ultra-fast charging solutions. This performance is crucial for electric vehicles and high-voltage storage infrastructure.
  • Further advancements in dendrite formation suppression enhance the safety and longevity of prismatic battery cells.
  • The market benefits from materials like SCC55 silicon-carbon composite and developments in nanopore technology, which contribute to higher efficiency and low self-discharge rates, addressing critical needs across industrial and consumer applications.

What are the market trends shaping the Nanobatteries Industry?

  • The rapid development of electrified luxury vehicles, which demand premium performance exceeding standard EV capabilities, is a significant market trend. This is accelerating demand for advanced, high-density battery solutions.

  • Market expansion is fueled by the development of electrified luxury vehicles, which integrate nanostructured cells to achieve exceptional performance. These vehicles leverage nanostructured lithium structures and advanced silicon-lithium composites to attain high energy density levels exceeding 400 Wh/kg, enabling longer ranges. Innovations in nanostructured electrolytes and fast-charging battery technology support rapid power replenishment without causing thermal throttling.
  • This allows for smaller, lighter batteries that fit into unique and flexible form factors. As the industry moves toward a next-generation silicon anode and even anode-free solid-state cells, a focus on high-nickel chemistries and advancements in semiconductor fabrication are enabling new capabilities and designs.

What challenges does the Nanobatteries Industry face during its growth?

  • The high cost of production, stemming from complex nanoscale fabrication processes and specialized precursor materials, remains a primary challenge restraining widespread market commercialization.

  • A primary challenge facing the market is the high cost associated with intricate nanoscale fabrication processes. Techniques such as atomic layer deposition and chemical vapor deposition are essential for creating uniform nanostructures but elevate production expenses, as seen in SiMaxx cell manufacturing.
  • The production of materials like the silicon-carbon composite involves high-purity vapor deposition and energy-intensive carbonization, further adding to costs. While gigafactory investments are necessary for scale, achieving cost-parity with conventional batteries remains difficult. Developing cost-effective methods for producing silicon nanowire electrode structures and scaling up all-solid-state nanobatteries are key hurdles to overcome for widespread adoption, including for micro-power sources.

Exclusive Technavio Analysis on Customer Landscape

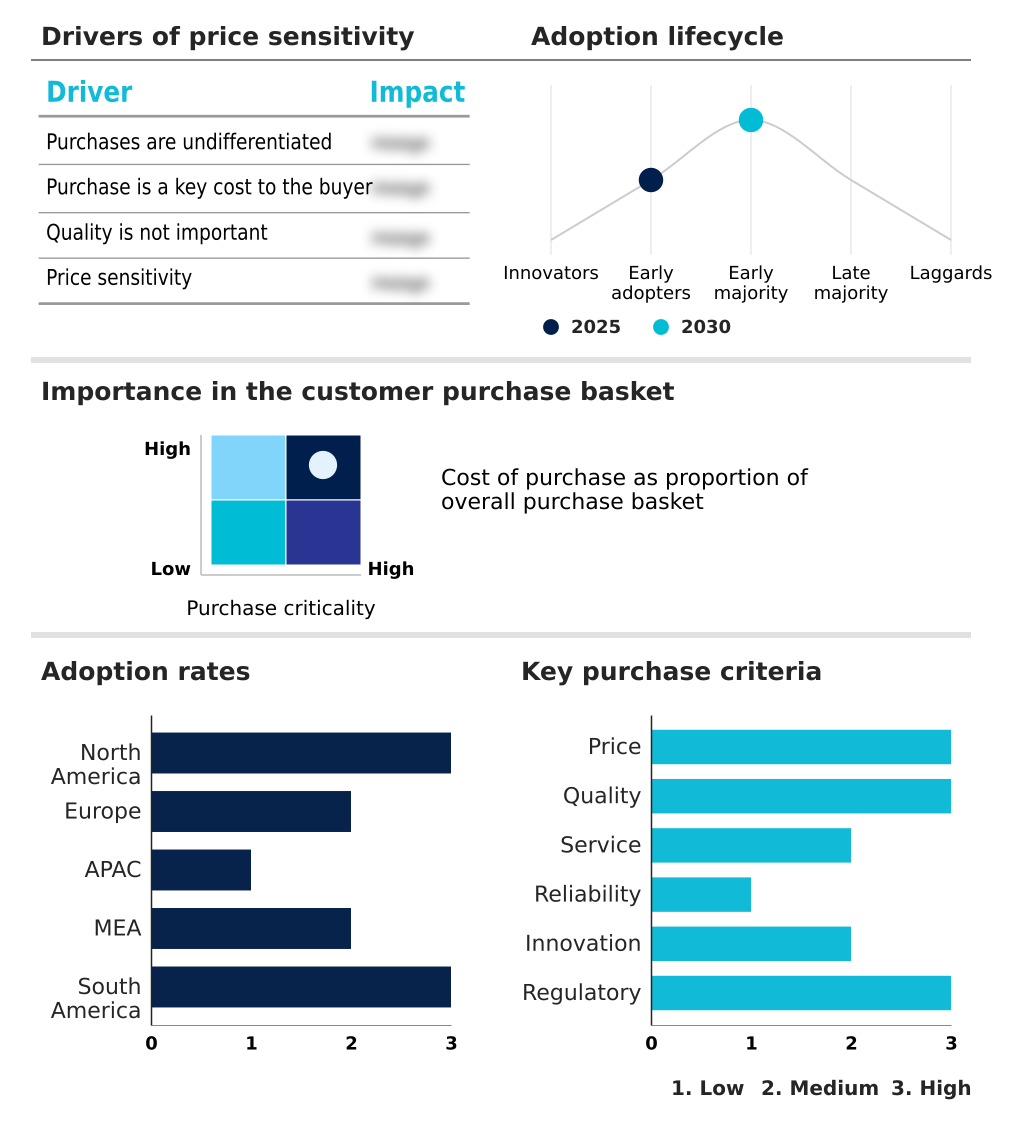
The nanobatteries market forecasting report includes the adoption lifecycle of the market, covering from the innovator’s stage to the laggard’s stage. It focuses on adoption rates in different regions based on penetration. Furthermore, the nanobatteries market report also includes key purchase criteria and drivers of price sensitivity to help companies evaluate and develop their market growth analysis strategies.

Customer Landscape of Nanobatteries Industry

Competitive Landscape

Companies are implementing various strategies, such as strategic alliances, nanobatteries market forecast, partnerships, mergers and acquisitions, geographical expansion, and product/service launches, to enhance their presence in the industry.

6K Inc. - The vendor focuses on developing advanced materials into products that advance key industries such as manufacturing, renewable energy, aerospace, and consumer electronics.

The industry research and growth report includes detailed analyses of the competitive landscape of the market and information about key companies, including:

  • 6K Inc.
  • A123 Systems LLC
  • Altairnano
  • Group14 Technologies
  • HPQ Silicon Inc.
  • LG Energy Solution Ltd.
  • Nanoramic Laboratories
  • Panasonic Holdings Corp.
  • Samsung SDI Co. Ltd.
  • Sila Nanotechnologies Inc.
  • StoreDot.
  • Toshiba Corp.

Qualitative and quantitative analysis of companies has been conducted to help clients understand the wider business environment as well as the strengths and weaknesses of key industry players. Data is qualitatively analyzed to categorize companies as pure play, category-focused, industry-focused, and diversified; it is quantitatively analyzed to categorize companies as dominant, leading, strong, tentative, and weak.

Recent Development and News in Nanobatteries market

  • In August, 2024, Group14 Technologies discussed cost challenges for its SCC55 silicon-carbon composite, revealing partnerships to halve capital outlays and achieve aggressive cost targets within two years.
  • In January, 2025, Samsung SDI disclosed new investment plans to expand electric vehicle battery production capacity in Hungary, Europe, reinforcing its role as a key regional supplier.
  • In March, 2025, Amprius Technologies announced the shipment of its new 6.3 Ah 21700 SiCore cell to a Fortune 500 light electric vehicle customer, marking a key commercial milestone.
  • In April, 2025, Amprius launched its SiMaxx 450 Wh/kg cells tailored for drones, providing a significant boost to market demand in the unmanned aerial vehicle sector.

Dive into Technavio’s robust research methodology, blending expert interviews, extensive data synthesis, and validated models for unparalleled Nanobatteries Market insights. See full methodology.

Market Scope
Page number 282
Base year 2025
Historic period 2020-2024
Forecast period 2026-2030
Growth momentum & CAGR Accelerate at a CAGR of 20.6%
Market growth 2026-2030 USD 2977.2 million
Market structure Concentrated
YoY growth 2025-2026(%) 18.0%
Key countries US, Canada, Mexico, Germany, France, UK, The Netherlands, Spain, Italy, China, Japan, South Korea, India, Australia, Indonesia, South Africa, UAE, Saudi Arabia, Egypt, Turkey, Brazil, Chile and Argentina
Competitive landscape Leading Companies, Market Positioning of Companies, Competitive Strategies, and Industry Risks

Request Free Sample

Research Analyst Overview

  • The nanobatteries market is rapidly evolving from a research-intensive field to a commercially vital industry, driven by the imperative for high energy density and an extended cycle life. Innovations in nanoscale fabrication, including atomic layer deposition and chemical vapor deposition, are enabling superior thermal management and high coulombic efficiency in next-generation cells.
  • The development of advanced nanomaterials such as silicon anode materials, carbon silicon anodes, and silicon-carbon composites is pushing the boundaries of lithium-ion battery performance. Boardroom decisions are increasingly influenced by the need to secure supply chains for these materials while investing in cobalt-free and high-nickel chemistries to meet ESG mandates.
  • Technologies ranging from nanophosphate cathodes and lithium titanate nanostructured batteries to all-solid-state nanobatteries with nanostructured electrolytes are becoming critical differentiators. As firms work on dendrite formation suppression and nano-engineered electrodes, they are targeting manufacturing cost reductions of over 30% through automation, essential for making silicon nanowire electrode and prismatic battery cells commercially viable.

What are the Key Data Covered in this Nanobatteries Market Research and Growth Report?

  • What is the expected growth of the Nanobatteries Market between 2026 and 2030?

    • USD 2.98 billion, at a CAGR of 20.6%

  • What segmentation does the market report cover?

    • The report is segmented by Technology (Nanophosphate, Nanopore, and Lithium-ion), Type (Lithium nanobatteries, Graphene nanobatteries, and Others), Application (Consumer electronics, Electric vehicles, and Renewable energy storage and grid solutions) and Geography (North America, Europe, APAC, Middle East and Africa, South America)

  • Which regions are analyzed in the report?

    • North America, Europe, APAC, Middle East and Africa and South America

  • What are the key growth drivers and market challenges?

    • Fast charging and high power, High cost of production

  • Who are the major players in the Nanobatteries Market?

    • 6K Inc., A123 Systems LLC, Altairnano, Group14 Technologies, HPQ Silicon Inc., LG Energy Solution Ltd., Nanoramic Laboratories, Panasonic Holdings Corp., Samsung SDI Co. Ltd., Sila Nanotechnologies Inc., StoreDot. and Toshiba Corp.

Market Research Insights

  • The nanobatteries market is defined by a structural tension between tightening supply chains for advanced nanomaterials and surging demand from global electrification initiatives. This dynamic is creating significant volatility, as production yields for nanoscale components struggle to keep pace with consumption from EV and grid storage sectors.
  • Some advanced cell manufacturing expenses run 40% above conventional battery costs, creating significant margin pressure. In response, leading firms are implementing multi-year roadmaps targeting cost reductions of over 30% through automated deposition lines and process optimizations aimed at achieving yield enhancements above 90%.
  • This focus on manufacturing efficiency is critical for navigating a landscape where feedstock availability, not just production capacity, dictates market growth.

We can help! Our analysts can customize this nanobatteries market research report to meet your requirements.

Get in touch

1. Executive Summary

1.1 Market overview

Executive Summary - Chart on Market Overview
Executive Summary - Data Table on Market Overview
Executive Summary - Chart on Global Market Characteristics
Executive Summary - Chart on Market by Geography
Executive Summary - Chart on Market Segmentation by Technology
Executive Summary - Chart on Market Segmentation by Type
Executive Summary - Chart on Market Segmentation by Application
Executive Summary - Chart on Incremental Growth
Executive Summary - Data Table on Incremental Growth
Executive Summary - Chart on Company Market Positioning

2. Technavio Analysis

2.1 Analysis of price sensitivity, lifecycle, customer purchase basket, adoption rates, and purchase criteria

2.2 Criticality of inputs and Factors of differentiation

Chart on Overview on criticality of inputs and factors of differentiation

2.3 Factors of disruption

Chart on Overview on factors of disruption

2.4 Impact of drivers and challenges

Chart on Impact of drivers and challenges in 2025 and 2030

3. Market Landscape

3.1 Market ecosystem

Chart on Parent Market
Data Table on - Parent Market

3.2 Market characteristics

Chart on Market characteristics analysis

3.3 Value chain analysis

Chart on Value chain analysis

4. Market Sizing

4.1 Market definition

Data Table on Offerings of companies included in the market definition

4.2 Market segment analysis

Market segments

4.3 Market size 2025

4.4 Market outlook: Forecast for 2025-2030

Chart on Global - Market size and forecast 2025-2030 ($ million)
Data Table on Global - Market size and forecast 2025-2030 ($ million)
Chart on Global Market: Year-over-year growth 2025-2030 (%)
Data Table on Global Market: Year-over-year growth 2025-2030 (%)

5. Historic Market Size

5.1 Global Nanobatteries Market 2020 - 2024

Historic Market Size - Data Table on Global Nanobatteries Market 2020 - 2024 ($ million)

5.2 Technology segment analysis 2020 - 2024

Historic Market Size - Technology Segment 2020 - 2024 ($ million)

5.3 Type segment analysis 2020 - 2024

Historic Market Size - Type Segment 2020 - 2024 ($ million)

5.4 Application segment analysis 2020 - 2024

Historic Market Size - Application Segment 2020 - 2024 ($ million)

5.5 Geography segment analysis 2020 - 2024

Historic Market Size - Geography Segment 2020 - 2024 ($ million)

5.6 Country segment analysis 2020 - 2024

Historic Market Size - Country Segment 2020 - 2024 ($ million)

6. Qualitative Analysis

6.1 AI Impact on Global Nanobatteries Market

7. Five Forces Analysis

7.1 Five forces summary

Five forces analysis - Comparison between 2025 and 2030

7.2 Bargaining power of buyers

Bargaining power of buyers - Impact of key factors 2025 and 2030

7.3 Bargaining power of suppliers

Bargaining power of suppliers - Impact of key factors in 2025 and 2030

7.4 Threat of new entrants

Threat of new entrants - Impact of key factors in 2025 and 2030

7.5 Threat of substitutes

Threat of substitutes - Impact of key factors in 2025 and 2030

7.6 Threat of rivalry

Threat of rivalry - Impact of key factors in 2025 and 2030

7.7 Market condition

Chart on Market condition - Five forces 2025 and 2030

8. Market Segmentation by Technology

8.1 Market segments

Chart on Technology - Market share 2025-2030 (%)
Data Table on Technology - Market share 2025-2030 (%)

8.2 Comparison by Technology

Chart on Comparison by Technology
Data Table on Comparison by Technology

8.3 Nanophosphate - Market size and forecast 2025-2030

Chart on Nanophosphate - Market size and forecast 2025-2030 ($ million)
Data Table on Nanophosphate - Market size and forecast 2025-2030 ($ million)
Chart on Nanophosphate - Year-over-year growth 2025-2030 (%)
Data Table on Nanophosphate - Year-over-year growth 2025-2030 (%)

8.4 Nanopore - Market size and forecast 2025-2030

Chart on Nanopore - Market size and forecast 2025-2030 ($ million)
Data Table on Nanopore - Market size and forecast 2025-2030 ($ million)
Chart on Nanopore - Year-over-year growth 2025-2030 (%)
Data Table on Nanopore - Year-over-year growth 2025-2030 (%)

8.5 Lithium-ion - Market size and forecast 2025-2030

Chart on Lithium-ion - Market size and forecast 2025-2030 ($ million)
Data Table on Lithium-ion - Market size and forecast 2025-2030 ($ million)
Chart on Lithium-ion - Year-over-year growth 2025-2030 (%)
Data Table on Lithium-ion - Year-over-year growth 2025-2030 (%)

8.6 Market opportunity by Technology

Market opportunity by Technology ($ million)
Data Table on Market opportunity by Technology ($ million)

9. Market Segmentation by Type

9.1 Market segments

Chart on Type - Market share 2025-2030 (%)
Data Table on Type - Market share 2025-2030 (%)

9.2 Comparison by Type

Chart on Comparison by Type
Data Table on Comparison by Type

9.3 Lithium nanobatteries - Market size and forecast 2025-2030

Chart on Lithium nanobatteries - Market size and forecast 2025-2030 ($ million)
Data Table on Lithium nanobatteries - Market size and forecast 2025-2030 ($ million)
Chart on Lithium nanobatteries - Year-over-year growth 2025-2030 (%)
Data Table on Lithium nanobatteries - Year-over-year growth 2025-2030 (%)

9.4 Graphene nanobatteries - Market size and forecast 2025-2030

Chart on Graphene nanobatteries - Market size and forecast 2025-2030 ($ million)
Data Table on Graphene nanobatteries - Market size and forecast 2025-2030 ($ million)
Chart on Graphene nanobatteries - Year-over-year growth 2025-2030 (%)
Data Table on Graphene nanobatteries - Year-over-year growth 2025-2030 (%)

9.5 Others - Market size and forecast 2025-2030

Chart on Others - Market size and forecast 2025-2030 ($ million)
Data Table on Others - Market size and forecast 2025-2030 ($ million)
Chart on Others - Year-over-year growth 2025-2030 (%)
Data Table on Others - Year-over-year growth 2025-2030 (%)

9.6 Market opportunity by Type

Market opportunity by Type ($ million)
Data Table on Market opportunity by Type ($ million)

10. Market Segmentation by Application

10.1 Market segments

Chart on Application - Market share 2025-2030 (%)
Data Table on Application - Market share 2025-2030 (%)

10.2 Comparison by Application

Chart on Comparison by Application
Data Table on Comparison by Application

10.3 Consumer electronics - Market size and forecast 2025-2030

Chart on Consumer electronics - Market size and forecast 2025-2030 ($ million)
Data Table on Consumer electronics - Market size and forecast 2025-2030 ($ million)
Chart on Consumer electronics - Year-over-year growth 2025-2030 (%)
Data Table on Consumer electronics - Year-over-year growth 2025-2030 (%)

10.4 Electric vehicles - Market size and forecast 2025-2030

Chart on Electric vehicles - Market size and forecast 2025-2030 ($ million)
Data Table on Electric vehicles - Market size and forecast 2025-2030 ($ million)
Chart on Electric vehicles - Year-over-year growth 2025-2030 (%)
Data Table on Electric vehicles - Year-over-year growth 2025-2030 (%)

10.5 Renewable energy storage and grid solutions - Market size and forecast 2025-2030

Chart on Renewable energy storage and grid solutions - Market size and forecast 2025-2030 ($ million)
Data Table on Renewable energy storage and grid solutions - Market size and forecast 2025-2030 ($ million)
Chart on Renewable energy storage and grid solutions - Year-over-year growth 2025-2030 (%)
Data Table on Renewable energy storage and grid solutions - Year-over-year growth 2025-2030 (%)

10.6 Market opportunity by Application

Market opportunity by Application ($ million)
Data Table on Market opportunity by Application ($ million)

11. Customer Landscape

11.1 Customer landscape overview

Analysis of price sensitivity, lifecycle, customer purchase basket, adoption rates, and purchase criteria

12. Geographic Landscape

12.1 Geographic segmentation

Chart on Market share by geography 2025-2030 (%)
Data Table on Market share by geography 2025-2030 (%)

12.2 Geographic comparison

Chart on Geographic comparison
Data Table on Geographic comparison

12.3 North America - Market size and forecast 2025-2030

Chart on North America - Market size and forecast 2025-2030 ($ million)
Data Table on North America - Market size and forecast 2025-2030 ($ million)
Chart on North America - Year-over-year growth 2025-2030 (%)
Data Table on North America - Year-over-year growth 2025-2030 (%)
Chart on Regional Comparison - North America
Data Table on Regional Comparison - North America

12.3.1 US - Market size and forecast 2025-2030

Chart on US - Market size and forecast 2025-2030 ($ million)
Data Table on US - Market size and forecast 2025-2030 ($ million)
Chart on US - Year-over-year growth 2025-2030 (%)
Data Table on US - Year-over-year growth 2025-2030 (%)

12.3.2 Canada - Market size and forecast 2025-2030

Chart on Canada - Market size and forecast 2025-2030 ($ million)
Data Table on Canada - Market size and forecast 2025-2030 ($ million)
Chart on Canada - Year-over-year growth 2025-2030 (%)
Data Table on Canada - Year-over-year growth 2025-2030 (%)

12.3.3 Mexico - Market size and forecast 2025-2030

Chart on Mexico - Market size and forecast 2025-2030 ($ million)
Data Table on Mexico - Market size and forecast 2025-2030 ($ million)
Chart on Mexico - Year-over-year growth 2025-2030 (%)
Data Table on Mexico - Year-over-year growth 2025-2030 (%)

12.4 Europe - Market size and forecast 2025-2030

Chart on Europe - Market size and forecast 2025-2030 ($ million)
Data Table on Europe - Market size and forecast 2025-2030 ($ million)
Chart on Europe - Year-over-year growth 2025-2030 (%)
Data Table on Europe - Year-over-year growth 2025-2030 (%)
Chart on Regional Comparison - Europe
Data Table on Regional Comparison - Europe

12.4.1 Germany - Market size and forecast 2025-2030

Chart on Germany - Market size and forecast 2025-2030 ($ million)
Data Table on Germany - Market size and forecast 2025-2030 ($ million)
Chart on Germany - Year-over-year growth 2025-2030 (%)
Data Table on Germany - Year-over-year growth 2025-2030 (%)

12.4.2 France - Market size and forecast 2025-2030

Chart on France - Market size and forecast 2025-2030 ($ million)
Data Table on France - Market size and forecast 2025-2030 ($ million)
Chart on France - Year-over-year growth 2025-2030 (%)
Data Table on France - Year-over-year growth 2025-2030 (%)

12.4.3 UK - Market size and forecast 2025-2030

Chart on UK - Market size and forecast 2025-2030 ($ million)
Data Table on UK - Market size and forecast 2025-2030 ($ million)
Chart on UK - Year-over-year growth 2025-2030 (%)
Data Table on UK - Year-over-year growth 2025-2030 (%)

12.4.4 The Netherlands - Market size and forecast 2025-2030

Chart on The Netherlands - Market size and forecast 2025-2030 ($ million)
Data Table on The Netherlands - Market size and forecast 2025-2030 ($ million)
Chart on The Netherlands - Year-over-year growth 2025-2030 (%)
Data Table on The Netherlands - Year-over-year growth 2025-2030 (%)

12.4.5 Spain - Market size and forecast 2025-2030

Chart on Spain - Market size and forecast 2025-2030 ($ million)
Data Table on Spain - Market size and forecast 2025-2030 ($ million)
Chart on Spain - Year-over-year growth 2025-2030 (%)
Data Table on Spain - Year-over-year growth 2025-2030 (%)

12.4.6 Italy - Market size and forecast 2025-2030

Chart on Italy - Market size and forecast 2025-2030 ($ million)
Data Table on Italy - Market size and forecast 2025-2030 ($ million)
Chart on Italy - Year-over-year growth 2025-2030 (%)
Data Table on Italy - Year-over-year growth 2025-2030 (%)

12.5 APAC - Market size and forecast 2025-2030

Chart on APAC - Market size and forecast 2025-2030 ($ million)
Data Table on APAC - Market size and forecast 2025-2030 ($ million)
Chart on APAC - Year-over-year growth 2025-2030 (%)
Data Table on APAC - Year-over-year growth 2025-2030 (%)
Chart on Regional Comparison - APAC
Data Table on Regional Comparison - APAC

12.5.1 China - Market size and forecast 2025-2030

Chart on China - Market size and forecast 2025-2030 ($ million)
Data Table on China - Market size and forecast 2025-2030 ($ million)
Chart on China - Year-over-year growth 2025-2030 (%)
Data Table on China - Year-over-year growth 2025-2030 (%)

12.5.2 Japan - Market size and forecast 2025-2030

Chart on Japan - Market size and forecast 2025-2030 ($ million)
Data Table on Japan - Market size and forecast 2025-2030 ($ million)
Chart on Japan - Year-over-year growth 2025-2030 (%)
Data Table on Japan - Year-over-year growth 2025-2030 (%)

12.5.3 South Korea - Market size and forecast 2025-2030

Chart on South Korea - Market size and forecast 2025-2030 ($ million)
Data Table on South Korea - Market size and forecast 2025-2030 ($ million)
Chart on South Korea - Year-over-year growth 2025-2030 (%)
Data Table on South Korea - Year-over-year growth 2025-2030 (%)

12.5.4 India - Market size and forecast 2025-2030

Chart on India - Market size and forecast 2025-2030 ($ million)
Data Table on India - Market size and forecast 2025-2030 ($ million)
Chart on India - Year-over-year growth 2025-2030 (%)
Data Table on India - Year-over-year growth 2025-2030 (%)

12.5.5 Australia - Market size and forecast 2025-2030

Chart on Australia - Market size and forecast 2025-2030 ($ million)
Data Table on Australia - Market size and forecast 2025-2030 ($ million)
Chart on Australia - Year-over-year growth 2025-2030 (%)
Data Table on Australia - Year-over-year growth 2025-2030 (%)

12.5.6 Indonesia - Market size and forecast 2025-2030

Chart on Indonesia - Market size and forecast 2025-2030 ($ million)
Data Table on Indonesia - Market size and forecast 2025-2030 ($ million)
Chart on Indonesia - Year-over-year growth 2025-2030 (%)
Data Table on Indonesia - Year-over-year growth 2025-2030 (%)

12.6 Middle East and Africa - Market size and forecast 2025-2030

Chart on Middle East and Africa - Market size and forecast 2025-2030 ($ million)
Data Table on Middle East and Africa - Market size and forecast 2025-2030 ($ million)
Chart on Middle East and Africa - Year-over-year growth 2025-2030 (%)
Data Table on Middle East and Africa - Year-over-year growth 2025-2030 (%)
Chart on Regional Comparison - Middle East and Africa
Data Table on Regional Comparison - Middle East and Africa

12.6.1 South Africa - Market size and forecast 2025-2030

Chart on South Africa - Market size and forecast 2025-2030 ($ million)
Data Table on South Africa - Market size and forecast 2025-2030 ($ million)
Chart on South Africa - Year-over-year growth 2025-2030 (%)
Data Table on South Africa - Year-over-year growth 2025-2030 (%)

12.6.2 UAE - Market size and forecast 2025-2030

Chart on UAE - Market size and forecast 2025-2030 ($ million)
Data Table on UAE - Market size and forecast 2025-2030 ($ million)
Chart on UAE - Year-over-year growth 2025-2030 (%)
Data Table on UAE - Year-over-year growth 2025-2030 (%)

12.6.3 Saudi Arabia - Market size and forecast 2025-2030

Chart on Saudi Arabia - Market size and forecast 2025-2030 ($ million)
Data Table on Saudi Arabia - Market size and forecast 2025-2030 ($ million)
Chart on Saudi Arabia - Year-over-year growth 2025-2030 (%)
Data Table on Saudi Arabia - Year-over-year growth 2025-2030 (%)

12.6.4 Egypt - Market size and forecast 2025-2030

Chart on Egypt - Market size and forecast 2025-2030 ($ million)
Data Table on Egypt - Market size and forecast 2025-2030 ($ million)
Chart on Egypt - Year-over-year growth 2025-2030 (%)
Data Table on Egypt - Year-over-year growth 2025-2030 (%)

12.6.5 Turkey - Market size and forecast 2025-2030

Chart on Turkey - Market size and forecast 2025-2030 ($ million)
Data Table on Turkey - Market size and forecast 2025-2030 ($ million)
Chart on Turkey - Year-over-year growth 2025-2030 (%)
Data Table on Turkey - Year-over-year growth 2025-2030 (%)

12.7 South America - Market size and forecast 2025-2030

Chart on South America - Market size and forecast 2025-2030 ($ million)
Data Table on South America - Market size and forecast 2025-2030 ($ million)
Chart on South America - Year-over-year growth 2025-2030 (%)
Data Table on South America - Year-over-year growth 2025-2030 (%)
Chart on Regional Comparison - South America
Data Table on Regional Comparison - South America

12.7.1 Brazil - Market size and forecast 2025-2030

Chart on Brazil - Market size and forecast 2025-2030 ($ million)
Data Table on Brazil - Market size and forecast 2025-2030 ($ million)
Chart on Brazil - Year-over-year growth 2025-2030 (%)
Data Table on Brazil - Year-over-year growth 2025-2030 (%)

12.7.2 Chile - Market size and forecast 2025-2030

Chart on Chile - Market size and forecast 2025-2030 ($ million)
Data Table on Chile - Market size and forecast 2025-2030 ($ million)
Chart on Chile - Year-over-year growth 2025-2030 (%)
Data Table on Chile - Year-over-year growth 2025-2030 (%)

12.7.3 Argentina - Market size and forecast 2025-2030

Chart on Argentina - Market size and forecast 2025-2030 ($ million)
Data Table on Argentina - Market size and forecast 2025-2030 ($ million)
Chart on Argentina - Year-over-year growth 2025-2030 (%)
Data Table on Argentina - Year-over-year growth 2025-2030 (%)

12.8 Market opportunity by geography

Market opportunity by geography ($ million)
Data Tables on Market opportunity by geography ($ million)

13. Drivers, Challenges, and Opportunity

13.1 Market drivers

Fast charging and high power
Longer battery lives and wider operating temperatures
Less possibility of batteries catching fire

13.2 Market challenges

High cost of production
Stiff competition from conventional batteries
Non-uniformity in standards

13.3 Impact of drivers and challenges

Impact of drivers and challenges in 2025 and 2030

13.4 Market opportunities

Rapid development of electrified luxury vehicles
Rise in demand for energy storage system in various applications
Development of bio-based nanobatteries

14. Competitive Landscape

14.1 Overview

14.2

Overview on criticality of inputs and factors of differentiation

14.3 Landscape disruption

Overview on factors of disruption

14.4 Industry risks

Impact of key risks on business

15. Competitive Analysis

15.1 Companies profiled

Companies covered

15.2 Company ranking index

15.3 Market positioning of companies

Matrix on companies position and classification

15.4 6K Inc.

6K Inc. - Overview
6K Inc. - Product / Service
6K Inc. - Key offerings
SWOT

15.5 A123 Systems LLC

A123 Systems LLC - Overview
A123 Systems LLC - Product / Service
A123 Systems LLC - Key offerings
SWOT

15.6 Altairnano

Altairnano - Overview
Altairnano - Product / Service
Altairnano - Key offerings
SWOT

15.7 Group14 Technologies

Group14 Technologies - Overview
Group14 Technologies - Product / Service
Group14 Technologies - Key offerings
SWOT

15.8 HPQ Silicon Inc.

HPQ Silicon Inc. - Overview
HPQ Silicon Inc. - Product / Service
HPQ Silicon Inc. - Key offerings
SWOT

15.9 LG Energy Solution Ltd.

LG Energy Solution Ltd. - Overview
LG Energy Solution Ltd. - Product / Service
LG Energy Solution Ltd. - Key offerings
SWOT

15.10 Nanoramic Laboratories

Nanoramic Laboratories - Overview
Nanoramic Laboratories - Product / Service
Nanoramic Laboratories - Key offerings
SWOT

15.11 Panasonic Holdings Corp.

Panasonic Holdings Corp. - Overview
Panasonic Holdings Corp. - Business segments
Panasonic Holdings Corp. - Key news
Panasonic Holdings Corp. - Key offerings
Panasonic Holdings Corp. - Segment focus
SWOT

15.12 Samsung SDI Co. Ltd.

Samsung SDI Co. Ltd. - Overview
Samsung SDI Co. Ltd. - Business segments
Samsung SDI Co. Ltd. - Key news
Samsung SDI Co. Ltd. - Key offerings
Samsung SDI Co. Ltd. - Segment focus
SWOT

15.13 Sila Nanotechnologies Inc.

Sila Nanotechnologies Inc. - Overview
Sila Nanotechnologies Inc. - Product / Service
Sila Nanotechnologies Inc. - Key offerings
SWOT

15.14 StoreDot.

StoreDot. - Overview
StoreDot. - Product / Service
StoreDot. - Key offerings
SWOT

15.15 Toshiba Corp.

Toshiba Corp. - Overview
Toshiba Corp. - Business segments
Toshiba Corp. - Key news
Toshiba Corp. - Key offerings
Toshiba Corp. - Segment focus
SWOT

16. Appendix

16.1 Scope of the report

Market definition
Objectives
Notes and caveats

16.2 Inclusions and exclusions checklist

Inclusions checklist
Exclusions checklist

16.3 Currency conversion rates for US$

16.4 Research methodology

16.5 Data procurement

Information sources

16.6 Data validation

16.7 Validation techniques employed for market sizing

16.8 Data synthesis

16.9 360 degree market analysis

16.10 List of abbreviations

Research Methodology

Technavio presents a detailed picture of the market by way of study, synthesis, and summation of data from multiple sources. The analysts have presented the various facets of the market with a particular focus on identifying the key industry influencers. The data thus presented is comprehensive, reliable, and the result of extensive research, both primary and secondary.

INFORMATION SOURCES

Primary sources

  • Manufacturers and suppliers
  • Channel partners
  • Industry experts
  • Strategic decision makers

Secondary sources

  • Industry journals and periodicals
  • Government data
  • Financial reports of key industry players
  • Historical data
  • Press releases

DATA ANALYSIS

Data Synthesis

  • Collation of data
  • Estimation of key figures
  • Analysis of derived insights

Data Validation

  • Triangulation with data models
  • Reference against proprietary databases
  • Corroboration with industry experts

REPORT WRITING

Qualitative

  • Market drivers
  • Market challenges
  • Market trends
  • Five forces analysis

Quantitative

  • Market size and forecast
  • Market segmentation
  • Geographical insights
  • Competitive landscape

Interested in this report?

Get your sample now to see our research methodology and insights!

Download Now

Frequently Asked Questions

Nanobatteries market growth will increase by USD 2977.2 million during 2026-2030.

The Nanobatteries market is expected to grow at a CAGR of 20.6% during 2026-2030.

Nanobatteries market is segmented by Technology (Nanophosphate, Nanopore, Lithium-ion) Type (Lithium nanobatteries, Graphene nanobatteries, Others) Application (Consumer electronics, Electric vehicles, Renewable energy storage and grid solutions)

6K Inc., A123 Systems LLC, Altairnano, Group14 Technologies, HPQ Silicon Inc., LG Energy Solution Ltd., Nanoramic Laboratories, Panasonic Holdings Corp., Samsung SDI Co. Ltd., Sila Nanotechnologies Inc., StoreDot., Toshiba Corp. are a few of the key vendors in the Nanobatteries market.

North America will register the highest growth rate of 38.4% among the other regions. Therefore, the Nanobatteries market in North America is expected to garner significant business opportunities for the vendors during the forecast period.

US, Canada, Mexico, Germany, France, UK, The Netherlands, Spain, Italy, China, Japan, South Korea, India, Australia, Indonesia, South Africa, UAE, Saudi Arabia, Egypt, Turkey, Brazil, Chile, Argentina

  • Fast charging and high power is the driving factor this market.

The Nanobatteries market vendors should focus on grabbing business opportunities from the Technology segment as it accounted for the largest market share in the base year.