Molten Sulfur Market Analysis, Size, and Forecast 2025-2029: APAC (China, Japan, and India), North America (US, Canada, and Mexico), Europe (Germany, UK, and France), Middle East and Africa (Saudi Arabia, UAE, and South Africa), South America (Brazil, Argentina, and Colombia), and Rest of World (ROW)

Molten Sulfur Market Analysis, Size, and Forecast 2025-2029:
APAC (China, Japan, and India), North America (US, Canada, and Mexico), Europe (Germany, UK, and France), Middle East and Africa (Saudi Arabia, UAE, and South Africa), South America (Brazil, Argentina, and Colombia), and Rest of World (ROW)

Published: Dec 2025 311 Pages SKU: IRTNTR74491

Market Overview at a Glance

$131.8 Mn
Market Opportunity
2.8%
CAGR 2024 - 2029
47.3%
APAC Growth
$323.6 Mn
Sulfuric acid segment 2023

Molten Sulfur Market Size 2025-2029

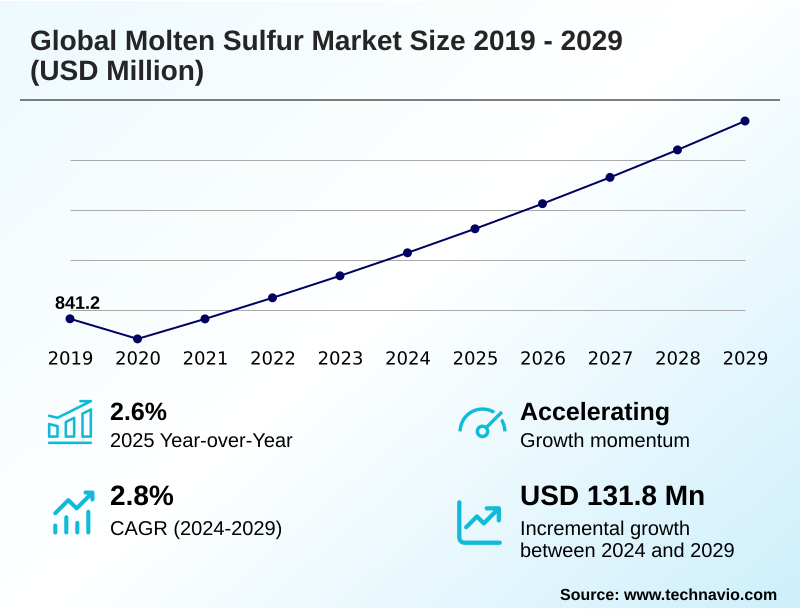
The molten sulfur market size is valued to increase by USD 131.8 million, at a CAGR of 2.8% from 2024 to 2029. Stringent environmental regulations on hydrocarbon desulfurization will drive the molten sulfur market.

Major Market Trends & Insights

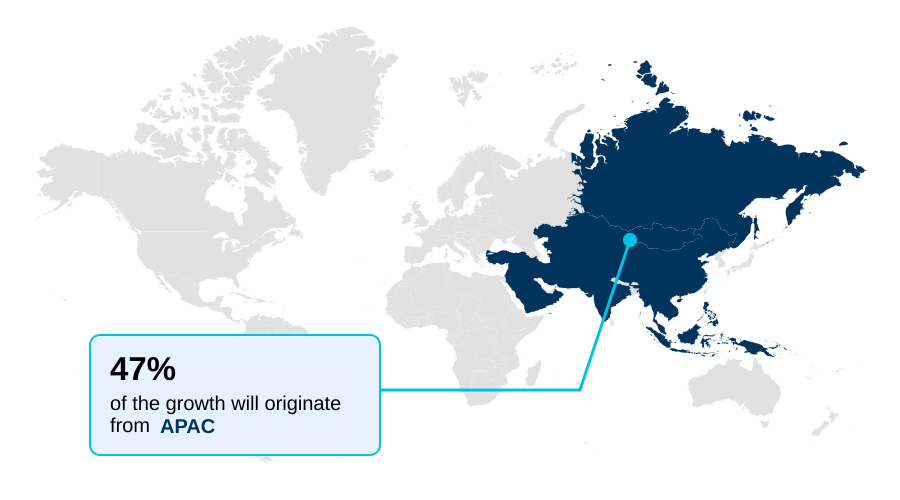
  • APAC dominated the market and accounted for a 47.3% growth during the forecast period.
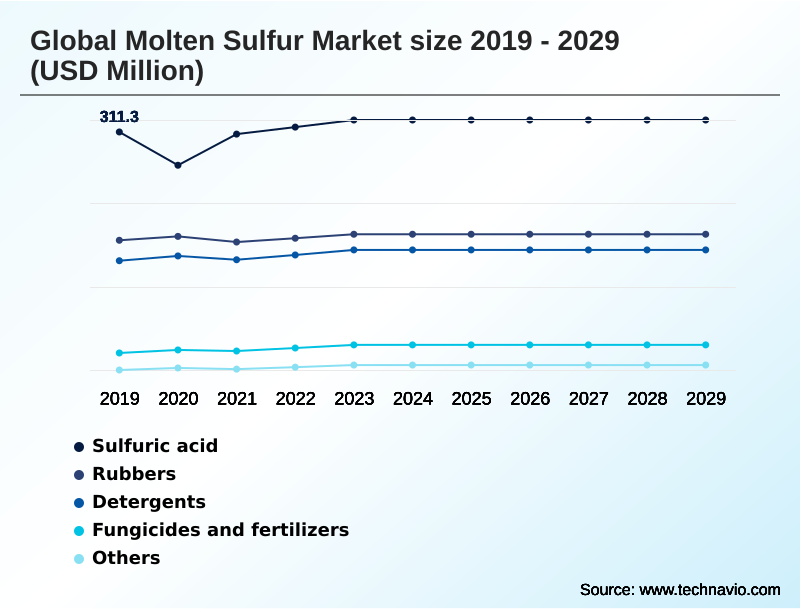
  • By Application - Sulfuric acid segment was valued at USD 323.6 million in 2023
  • By End-user - Fertilizer and agro-chemicals segment accounted for the largest market revenue share in 2023

Market Size & Forecast

  • Market Opportunities: USD 197.8 million
  • Market Future Opportunities: USD 131.8 million
  • CAGR from 2024 to 2029 : 2.8%

Market Summary

  • The molten sulfur market operates on a unique paradigm where supply is an involuntary consequence of environmental compliance rather than a response to direct demand. Stringent regulations requiring hydrocarbon desulfurization in oil and gas processing are the primary force behind production, making the market's volume contingent on energy sector activities.
  • This creates a fundamental disconnect from its main consumption driver: the agricultural industry's need for sulfuric acid to produce phosphate fertilizers. The resulting dynamic is characterized by strategic regional supply-demand imbalances, fostering a complex global trade network.
  • For instance, a major fertilizer manufacturer in a region with limited refining capacity must secure long-term contracts with producers in energy-rich regions, navigating volatile freight costs and geopolitical risks to ensure a steady supply of elemental sulfur recovery.
  • This necessitates sophisticated logistics and risk management, as any disruption in the energy supply chain, such as a cut in crude oil production, directly curtails the availability of molten sulfur, irrespective of agricultural demand.

What will be the Size of the Molten Sulfur Market during the forecast period?

Get Key Insights on Market Forecast (PDF) Request Free Sample

How is the Molten Sulfur Market Segmented?

The molten sulfur industry research report provides comprehensive data (region-wise segment analysis), with forecasts and estimates in "USD million" for the period 2025-2029, as well as historical data from 2019-2023 for the following segments.

  • Application
    • Sulfuric acid
    • Rubbers
    • Detergents
    • Fungicides and fertilizers
    • Others
  • End-user
    • Fertilizer and agro-chemicals
    • Chemicals and petrochemicals
    • Oil and gas refining
    • Mining and metallurgy
    • Others
  • Technology
    • Claus process
    • Granulation
    • Shell process
    • Frasch process
    • Resublimed process
  • Geography
    • APAC
      • China
      • Japan
      • India
    • North America
      • US
      • Canada
      • Mexico
    • Europe
      • Germany
      • UK
      • France
    • Middle East and Africa
      • Saudi Arabia
      • UAE
      • South Africa
    • South America
      • Brazil
      • Argentina
      • Colombia
    • Rest of World (ROW)

By Application Insights

The sulfuric acid segment is estimated to witness significant growth during the forecast period.

Sulfuric acid production is the principal application, driven by its foundational role in chemical synthesis and industrial processing.

This non-discretionary byproduct supply originates from oil and gas operations, creating a market dynamic intrinsically tied to energy sector output rather than end-user demand.

The logistical complexity of moving this material requires a robust heated transport infrastructure, including specialized railcars and vessels. Its use extends to mining and metallurgy use, where it is a key reagent.

Innovations focus on creating value-added products like sulfur derivative chemicals and sulfur-bentonite blends for agricultural applications. Effectively managing supply inelasticity is a primary strategic focus, necessitating sophisticated strategic inventory management and a move toward a circular economy in sulfur.

Long-term supply agreements are crucial for stability, while accurate byproduct stream valuation helps refiners optimize their operations, with some achieving a 10% improvement in byproduct revenue.

Request Free Sample

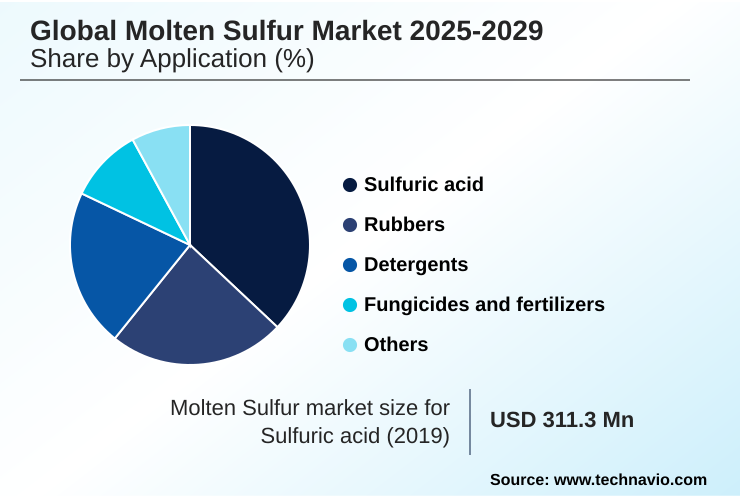
The Sulfuric acid segment was valued at USD 323.6 million in 2023 and showed a gradual increase during the forecast period.

Request Free Sample

Regional Analysis

APAC is estimated to contribute 47.3% to the growth of the global market during the forecast period.Technavio’s analysts have elaborately explained the regional trends and drivers that shape the market during the forecast period.

See How Molten Sulfur Market Demand is Rising in APAC Request Free Sample

The geographic landscape is defined by a dislocation between production and consumption centers.

Regions like the Middle East and North America are net exporters due to extensive refining operations, while APAC, with a 3.2% growth rate, is the largest demand hub, driven by agricultural sulfur demand.

The effective implementation of environmental compliance technology is universal, mandating the reduction of sulfur dioxide emissions globally. This requires robust sulfur handling systems and advanced process control software to manage refinery-grade sulfur output.

Investment in this capital-intensive infrastructure is critical; facilities with modern catalyst formulations for sulfur report a 5% higher recovery rate.

Molten material handling safety remains a top priority, influencing the sulfur quality for acid production and overall operational viability, with APAC accounting for 47.3% of the incremental growth.

Market Dynamics

Our researchers analyzed the data with 2024 as the base year, along with the key drivers, trends, and challenges. A holistic analysis of drivers will help companies refine their marketing strategies to gain a competitive advantage.

  • The global molten sulfur market 2025-2029 operates within a complex framework where technology for molten sulfur transportation and storage is as critical as production itself. The economic impact of geopolitical risk on sulfur trade is significant, as the impact of opec cuts on byproduct sulfur supply can create immediate shortages.
  • The role of molten sulfur in the phosphate fertilizer industry remains the primary demand driver, making the cost-benefit of heated tanker vessel investment a key strategic calculation for logistics providers. On the supply side, optimizing claus process for higher sulfur recovery is a constant objective for refiners.
  • A molten sulfur vs solid sulfur logistics comparison consistently shows that liquid transport is more cost-effective for large volumes, despite higher initial investment. This influences decisions on managing price volatility in the molten sulfur market. Regulatory drivers for hydrocarbon desulfurization ensure a steady, if inflexible, supply.
  • The challenges of supply inelasticity in chemical markets necessitate strategic sourcing of sulfur for sulfuric acid plants. This is amplified by the growth of sulfur demand in mining and metallurgy. Consequently, the importance of logistics in sulfur arbitrage trading cannot be overstated.
  • Improving safety in molten sulfur handling operations is paramount, as is understanding byproduct sulfur quality from different refining processes. The impact of environmental policy on sulfur production, alongside the future of sulfur recovery from industrial waste streams, will continue to shape the market.
  • A regional analysis of sulfur supply and demand reveals that facilities with modernized port infrastructure handle nearly 50% more volume. Finally, the molten sulfur applications in specialty chemicals and the analysis of sulfur derivatives market trends represent emerging growth frontiers.

What are the key market drivers leading to the rise in the adoption of Molten Sulfur Industry?

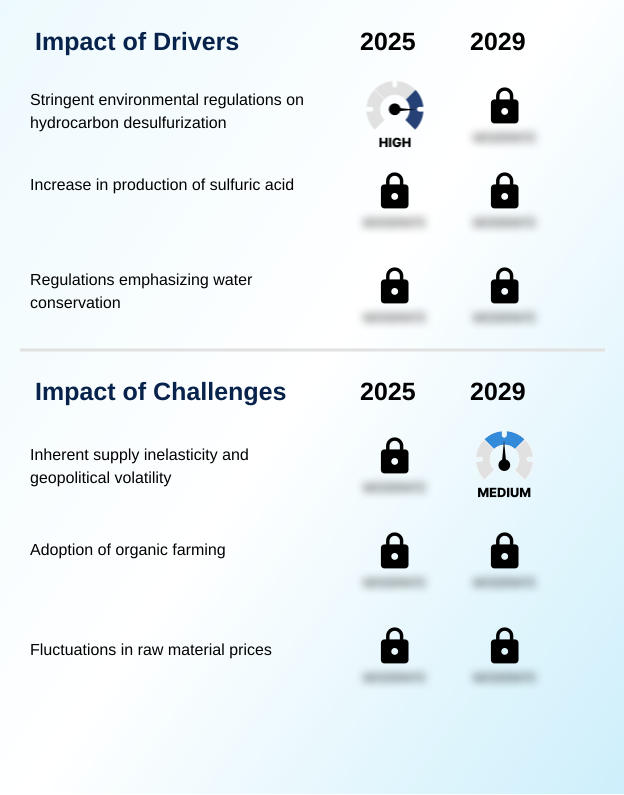
  • Stringent environmental regulations mandating hydrocarbon desulfurization are the primary driver for the market's supply-side dynamics.

  • The market's primary driver is the non-negotiable regulatory mandate for desulfurization, making byproduct sulfur from refining a constant output of the energy sector. This involuntary supply from sour gas processing is managed through energy sector byproduct management strategies.
  • The largest consumer remains the sulfuric acid manufacturing industry, which links market dynamics directly to the agricultural commodity prices link. Even the rubber vulcanization process relies on this steady supply.
  • The logistical chain, including heated storage tanks, is critical, as molten sulfur transportation costs can constitute a significant portion of the final delivered price, sometimes up to 40%.
  • The inherent sulfur supply chain volatility, often influenced by the geopolitical impact on sulfur supply, creates a challenging environment where supply security, rather than price alone, dictates purchasing decisions.

What are the market trends shaping the Molten Sulfur Industry?

  • Strategic regional supply-demand imbalances are creating significant opportunities for logistical arbitrage. This is becoming a defining trend within the market.

  • The market's most significant trend is the intensification of strategic regional supply-demand imbalance, which is driving sophisticated logistical responses. This dynamic elevates the importance of molten sulfur logistics and makes intercontinental sulfur trade a critical component of market stability.
  • Investment in sulfur export infrastructure in production-heavy regions has increased by over 20% in recent years, matched by expansions in sulfur import logistics at consumption hubs. The core of this activity stems from hydrocarbon desulfurization activities and the efficiency of claus process technology. As a result, molten sulfur price dynamics are increasingly tied to freight costs and arbitrage opportunities.
  • This trend is further supported by the growing use of sulfur-based agrochemicals and the need for reliable elemental sulfur recovery, with optimized shipping routes reducing delivery times by an average of 15%.

What challenges does the Molten Sulfur Industry face during its growth?

  • Inherent supply inelasticity, compounded by geopolitical volatility, presents a key challenge to industry growth and stability.

  • Inherent supply inelasticity remains the market's greatest challenge, as production is divorced from demand dynamics. This condition is intensified by geopolitical volatility, making long-term supply agreements essential for stability. For instance, disruptions can cause price spikes of over 30% in a single quarter.
  • The market's reliance on specialized tanker vessels and complex inland distribution networks makes the entire supply chain vulnerable. Key industrial sulfur applications, such as phosphate fertilizer production, are directly impacted by this fragility. Ensuring consistent sulfur purity standards during transit adds another layer of complexity.
  • As a result, market participants are increasingly focused on sulfur recovery rate optimization and securing access to reliable port reception facilities. Investments in granulation technology are also considered a hedge, allowing conversion to solid form during periods of logistical constraint, which can reduce storage costs by 15% compared to maintaining molten inventory.

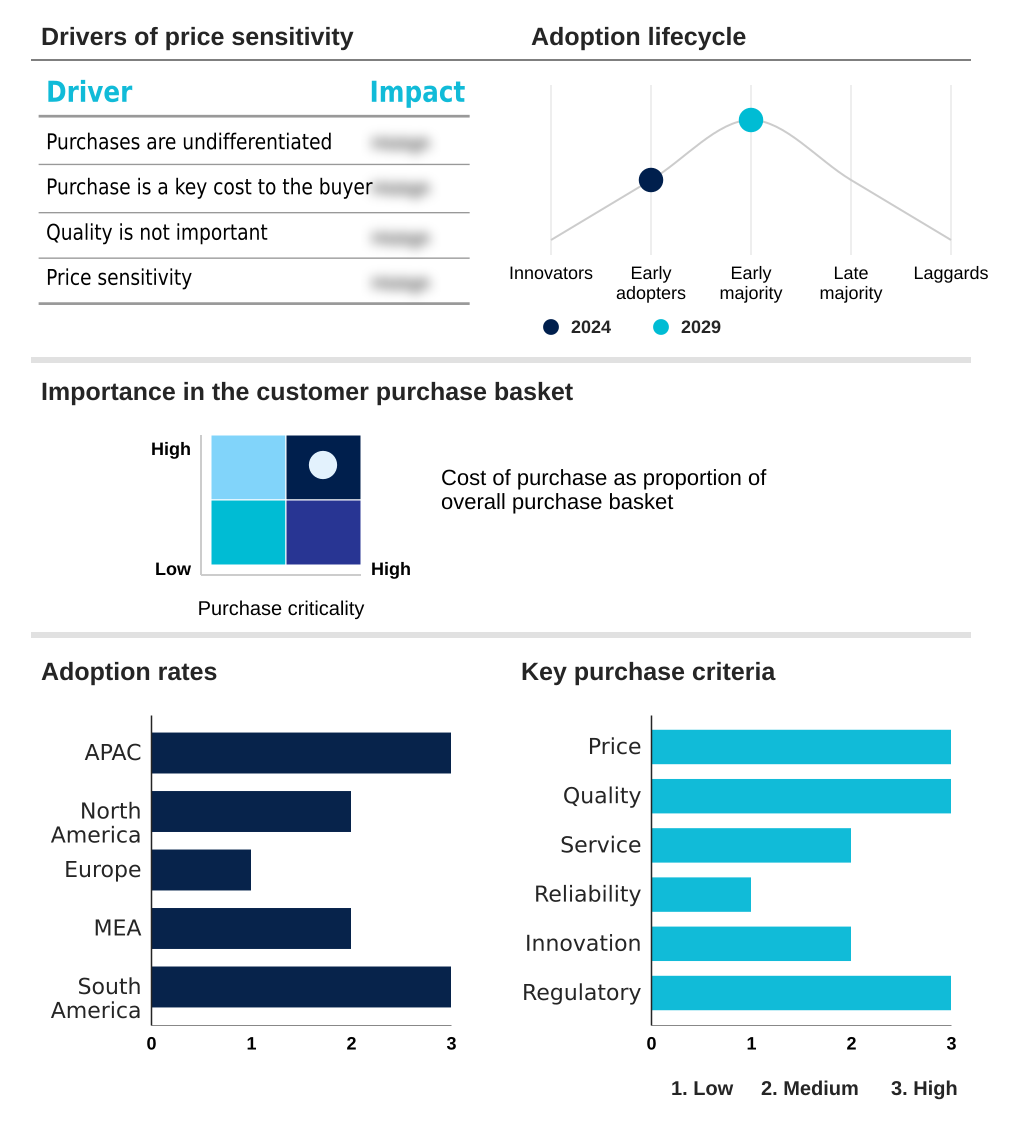
Exclusive Technavio Analysis on Customer Landscape

The molten sulfur market forecasting report includes the adoption lifecycle of the market, covering from the innovator’s stage to the laggard’s stage. It focuses on adoption rates in different regions based on penetration. Furthermore, the molten sulfur market report also includes key purchase criteria and drivers of price sensitivity to help companies evaluate and develop their market growth analysis strategies.

Customer Landscape of Molten Sulfur Industry

Competitive Landscape

Companies are implementing various strategies, such as strategic alliances, molten sulfur market forecast, partnerships, mergers and acquisitions, geographical expansion, and product/service launches, to enhance their presence in the industry.

A. J. Edmond Company - Specialized polycyclamine lining systems are offered to ensure containment and transport integrity for high-solids molten materials.

The industry research and growth report includes detailed analyses of the competitive landscape of the market and information about key companies, including:

  • A. J. Edmond Company
  • Abu Dhabi National Oil Co.
  • Akzo Nobel NV
  • Chemtrade Logistics Income Fund
  • Chevron Corp.
  • Eidon Ionic Minerals
  • H.J. Baker and Bro. LLC.
  • Hindustan Petroleum Corp. Ltd.
  • Kuwait National Petroleum Co.
  • Marathon Petroleum Corp.
  • Martin Midstream Partners L.P.
  • Moeve, S.A.
  • Montana Sulphur and Chemical Co.
  • QUADRIMEX CHEMICAL
  • Repsol SA
  • Sasol Ltd.
  • Sikko Industries Ltd.
  • Suncor Energy Inc.
  • Teck Resources Ltd.
  • Tengizchevroil LLP

Qualitative and quantitative analysis of companies has been conducted to help clients understand the wider business environment as well as the strengths and weaknesses of key industry players. Data is qualitatively analyzed to categorize companies as pure play, category-focused, industry-focused, and diversified; it is quantitatively analyzed to categorize companies as dominant, leading, strong, tentative, and weak.

Recent Development and News in Molten sulfur market

  • In September 2024, Chemtrade Logistics Income Fund announced the completion of an upgrade to its North American terminal network, increasing its molten sulfur storage capacity by 15% to better manage regional supply-demand imbalances, according to a company press release.
  • In November 2024, a strategic partnership was formed between Marathon Petroleum Corp. and a leading agricultural cooperative to establish a dedicated supply chain for delivering molten sulfur directly to new fertilizer production facilities in the US Midwest, as reported by Reuters.
  • In February 2025, Suncor Energy Inc. secured a key patent for a new-generation heated tanker design that reduces energy consumption for temperature maintenance by up to 20%, enhancing the efficiency and environmental profile of long-haul sulfur transport.
  • In April 2025, Sasol Ltd. completed the divestment of its non-core chemical assets to focus on its primary energy and chemicals portfolio, a move that included the sale of a regional sulfur distribution network to a specialized logistics provider, aiming to streamline operations.

Dive into Technavio’s robust research methodology, blending expert interviews, extensive data synthesis, and validated models for unparalleled Molten Sulfur Market insights. See full methodology.

Market Scope
Page number 311
Base year 2024
Historic period 2019-2023
Forecast period 2025-2029
Growth momentum & CAGR Accelerate at a CAGR of 2.8%
Market growth 2025-2029 USD 131.8 million
Market structure Fragmented
YoY growth 2024-2025(%) 2.6%
Key countries China, Japan, India, South Korea, Australia, Indonesia, US, Canada, Mexico, Germany, UK, France, Italy, The Netherlands, Spain, Saudi Arabia, UAE, South Africa, Israel, Turkey, Brazil, Argentina and Colombia
Competitive landscape Leading Companies, Market Positioning of Companies, Competitive Strategies, and Industry Risks

Request Free Sample

Research Analyst Overview

  • The molten sulfur market is fundamentally shaped by its status as a non-discretionary byproduct supply, primarily from sour gas processing and hydrocarbon desulfurization. Its trajectory is dictated by environmental compliance technology rather than direct market demand, with the claus process technology being central to elemental sulfur recovery.
  • A key boardroom consideration is navigating the logistics, as the material requires heated transport infrastructure, including heated storage tanks and specialized tanker vessels. The market's primary offtake is for sulfuric acid manufacturing, crucial for phosphate fertilizer production and a growing range of industrial sulfur applications. The rubber vulcanization process also represents a steady demand source.
  • Volatility is inherent due to the link between supply and refinery operations, compelling consumers to secure refinery-grade sulfur with consistent sulfur purity standards. For producers, decisions around granulation technology for solidifying surplus are weighed against the economics of maintaining molten sulfur logistics. For consumers in agriculture, demand for sulfur-based agrochemicals and sulfur-bentonite blends is rising to address soil deficiencies.
  • In mining and metallurgy use, sulfur is critical for leaching operations. Firms that have optimized their supply chains have achieved a 20% improvement in supply chain predictability, a critical advantage in this market.

What are the Key Data Covered in this Molten Sulfur Market Research and Growth Report?

  • What is the expected growth of the Molten Sulfur Market between 2025 and 2029?

    • USD 131.8 million, at a CAGR of 2.8%

  • What segmentation does the market report cover?

    • The report is segmented by Application (Sulfuric acid, Rubbers, Detergents, Fungicides and fertilizers, and Others), End-user (Fertilizer and agro-chemicals, Chemicals and petrochemicals, Oil and gas refining, Mining and metallurgy, Others), Technology (Claus process, Granulation, Shell process, Frasch process, and Resublimed process) and Geography (APAC, North America, Europe, Middle East and Africa, South America)

  • Which regions are analyzed in the report?

    • APAC, North America, Europe, Middle East and Africa and South America

  • What are the key growth drivers and market challenges?

    • Stringent environmental regulations on hydrocarbon desulfurization, Inherent supply inelasticity and geopolitical volatility

  • Who are the major players in the Molten Sulfur Market?

    • A. J. Edmond Company, Abu Dhabi National Oil Co., Akzo Nobel NV, Chemtrade Logistics Income Fund, Chevron Corp., Eidon Ionic Minerals, H.J. Baker and Bro. LLC., Hindustan Petroleum Corp. Ltd., Kuwait National Petroleum Co., Marathon Petroleum Corp., Martin Midstream Partners L.P., Moeve, S.A., Montana Sulphur and Chemical Co., QUADRIMEX CHEMICAL, Repsol SA, Sasol Ltd., Sikko Industries Ltd., Suncor Energy Inc., Teck Resources Ltd. and Tengizchevroil LLP

Market Research Insights

  • The market is shaped by a delicate balance between involuntary supply and robust industrial demand, creating distinct arbitrage opportunities. The molten sulfur price dynamics are heavily influenced by the cost of intercontinental sulfur trade and logistics. Managing this regional supply-demand imbalance requires significant investment in both sulfur export infrastructure and specialized sulfur import logistics.
  • Firms leveraging advanced analytics for optimizing routes have documented molten sulfur transportation costs reductions of up to 12%. Furthermore, the inherent sulfur supply chain volatility, driven by energy sector byproduct management, has prompted over 30% of major consumers to diversify their supplier portfolios to mitigate geopolitical impact on sulfur supply.
  • This strategic realignment is also tied to the agricultural commodity prices link, where demand forecasting accuracy has improved by nearly 15% through integrated market data.

We can help! Our analysts can customize this molten sulfur market research report to meet your requirements.

Get in touch

1. Executive Summary

1.1 Market overview

Executive Summary - Chart on Market Overview
Executive Summary - Data Table on Market Overview
Executive Summary - Chart on Global Market Characteristics
Executive Summary - Chart on Market by Geography
Executive Summary - Chart on Market Segmentation by Application
Executive Summary - Chart on Market Segmentation by End-user
Executive Summary - Chart on Market Segmentation by Technology
Executive Summary - Chart on Incremental Growth
Executive Summary - Data Table on Incremental Growth
Executive Summary - Chart on Company Market Positioning

2. Technavio Analysis

2.1 Analysis of price sensitivity, lifecycle, customer purchase basket, adoption rates, and purchase criteria

2.2 Criticality of inputs and Factors of differentiation

Chart on Overview on criticality of inputs and factors of differentiation

2.3 Factors of disruption

Chart on Overview on factors of disruption

2.4 Impact of drivers and challenges

Chart on Impact of drivers and challenges in 2024 and 2029

3. Market Landscape

3.1 Market ecosystem

Chart on Parent Market
Data Table on - Parent Market

3.2 Market characteristics

Chart on Market characteristics analysis

3.3 Value chain analysis

Chart on Value chain analysis

4. Market Sizing

4.1 Market definition

Data Table on Offerings of companies included in the market definition

4.2 Market segment analysis

Market segments

4.3 Market size 2024

4.4 Market outlook: Forecast for 2024-2029

Chart on Global - Market size and forecast 2024-2029 ($ million)
Data Table on Global - Market size and forecast 2024-2029 ($ million)
Chart on Global Market: Year-over-year growth 2024-2029 (%)
Data Table on Global Market: Year-over-year growth 2024-2029 (%)

5. Historic Market Size

5.1 Global Molten Sulfur Market 2019 - 2023

Historic Market Size - Data Table on Global Molten Sulfur Market 2019 - 2023 ($ million)

5.2 Application segment analysis 2019 - 2023

Historic Market Size - Application Segment 2019 - 2023 ($ million)

5.3 End-user segment analysis 2019 - 2023

Historic Market Size - End-user Segment 2019 - 2023 ($ million)

5.4 Technology segment analysis 2019 - 2023

Historic Market Size - Technology Segment 2019 - 2023 ($ million)

5.5 Geography segment analysis 2019 - 2023

Historic Market Size - Geography Segment 2019 - 2023 ($ million)

5.6 Country segment analysis 2019 - 2023

Historic Market Size - Country Segment 2019 - 2023 ($ million)

6. Qualitative Analysis

6.1 The AI impact on Global Molten Sulfur Market

7. Five Forces Analysis

7.1 Five forces summary

Five forces analysis - Comparison between 2024 and 2029

7.2 Bargaining power of buyers

Bargaining power of buyers - Impact of key factors 2024 and 2029

7.3 Bargaining power of suppliers

Bargaining power of suppliers - Impact of key factors in 2024 and 2029

7.4 Threat of new entrants

Threat of new entrants - Impact of key factors in 2024 and 2029

7.5 Threat of substitutes

Threat of substitutes - Impact of key factors in 2024 and 2029

7.6 Threat of rivalry

Threat of rivalry - Impact of key factors in 2024 and 2029

7.7 Market condition

Chart on Market condition - Five forces 2024 and 2029

8. Market Segmentation by Application

8.1 Market segments

Chart on Application - Market share 2024-2029 (%)
Data Table on Application - Market share 2024-2029 (%)

8.2 Comparison by Application

Chart on Comparison by Application
Data Table on Comparison by Application

8.3 Sulfuric acid - Market size and forecast 2024-2029

Chart on Sulfuric acid - Market size and forecast 2024-2029 ($ million)
Data Table on Sulfuric acid - Market size and forecast 2024-2029 ($ million)
Chart on Sulfuric acid - Year-over-year growth 2024-2029 (%)
Data Table on Sulfuric acid - Year-over-year growth 2024-2029 (%)

8.4 Rubbers - Market size and forecast 2024-2029

Chart on Rubbers - Market size and forecast 2024-2029 ($ million)
Data Table on Rubbers - Market size and forecast 2024-2029 ($ million)
Chart on Rubbers - Year-over-year growth 2024-2029 (%)
Data Table on Rubbers - Year-over-year growth 2024-2029 (%)

8.5 Detergents - Market size and forecast 2024-2029

Chart on Detergents - Market size and forecast 2024-2029 ($ million)
Data Table on Detergents - Market size and forecast 2024-2029 ($ million)
Chart on Detergents - Year-over-year growth 2024-2029 (%)
Data Table on Detergents - Year-over-year growth 2024-2029 (%)

8.6 Fungicides and fertilizers - Market size and forecast 2024-2029

Chart on Fungicides and fertilizers - Market size and forecast 2024-2029 ($ million)
Data Table on Fungicides and fertilizers - Market size and forecast 2024-2029 ($ million)
Chart on Fungicides and fertilizers - Year-over-year growth 2024-2029 (%)
Data Table on Fungicides and fertilizers - Year-over-year growth 2024-2029 (%)

8.7 Others - Market size and forecast 2024-2029

Chart on Others - Market size and forecast 2024-2029 ($ million)
Data Table on Others - Market size and forecast 2024-2029 ($ million)
Chart on Others - Year-over-year growth 2024-2029 (%)
Data Table on Others - Year-over-year growth 2024-2029 (%)

8.8 Market opportunity by Application

Market opportunity by Application ($ million)
Data Table on Market opportunity by Application ($ million)

9. Market Segmentation by End-user

9.1 Market segments

Chart on End-user - Market share 2024-2029 (%)
Data Table on End-user - Market share 2024-2029 (%)

9.2 Comparison by End-user

Chart on Comparison by End-user
Data Table on Comparison by End-user

9.3 Fertilizer and agro-chemicals - Market size and forecast 2024-2029

Chart on Fertilizer and agro-chemicals - Market size and forecast 2024-2029 ($ million)
Data Table on Fertilizer and agro-chemicals - Market size and forecast 2024-2029 ($ million)
Chart on Fertilizer and agro-chemicals - Year-over-year growth 2024-2029 (%)
Data Table on Fertilizer and agro-chemicals - Year-over-year growth 2024-2029 (%)

9.4 Chemicals and petrochemicals - Market size and forecast 2024-2029

Chart on Chemicals and petrochemicals - Market size and forecast 2024-2029 ($ million)
Data Table on Chemicals and petrochemicals - Market size and forecast 2024-2029 ($ million)
Chart on Chemicals and petrochemicals - Year-over-year growth 2024-2029 (%)
Data Table on Chemicals and petrochemicals - Year-over-year growth 2024-2029 (%)

9.5 Oil and gas refining - Market size and forecast 2024-2029

Chart on Oil and gas refining - Market size and forecast 2024-2029 ($ million)
Data Table on Oil and gas refining - Market size and forecast 2024-2029 ($ million)
Chart on Oil and gas refining - Year-over-year growth 2024-2029 (%)
Data Table on Oil and gas refining - Year-over-year growth 2024-2029 (%)

9.6 Mining and metallurgy - Market size and forecast 2024-2029

Chart on Mining and metallurgy - Market size and forecast 2024-2029 ($ million)
Data Table on Mining and metallurgy - Market size and forecast 2024-2029 ($ million)
Chart on Mining and metallurgy - Year-over-year growth 2024-2029 (%)
Data Table on Mining and metallurgy - Year-over-year growth 2024-2029 (%)

9.7 Others - Market size and forecast 2024-2029

Chart on Others - Market size and forecast 2024-2029 ($ million)
Data Table on Others - Market size and forecast 2024-2029 ($ million)
Chart on Others - Year-over-year growth 2024-2029 (%)
Data Table on Others - Year-over-year growth 2024-2029 (%)

9.8 Market opportunity by End-user

Market opportunity by End-user ($ million)
Data Table on Market opportunity by End-user ($ million)

10. Market Segmentation by Technology

10.1 Market segments

Chart on Technology - Market share 2024-2029 (%)
Data Table on Technology - Market share 2024-2029 (%)

10.2 Comparison by Technology

Chart on Comparison by Technology
Data Table on Comparison by Technology

10.3 Claus process - Market size and forecast 2024-2029

Chart on Claus process - Market size and forecast 2024-2029 ($ million)
Data Table on Claus process - Market size and forecast 2024-2029 ($ million)
Chart on Claus process - Year-over-year growth 2024-2029 (%)
Data Table on Claus process - Year-over-year growth 2024-2029 (%)

10.4 Granulation - Market size and forecast 2024-2029

Chart on Granulation - Market size and forecast 2024-2029 ($ million)
Data Table on Granulation - Market size and forecast 2024-2029 ($ million)
Chart on Granulation - Year-over-year growth 2024-2029 (%)
Data Table on Granulation - Year-over-year growth 2024-2029 (%)

10.5 Shell process - Market size and forecast 2024-2029

Chart on Shell process - Market size and forecast 2024-2029 ($ million)
Data Table on Shell process - Market size and forecast 2024-2029 ($ million)
Chart on Shell process - Year-over-year growth 2024-2029 (%)
Data Table on Shell process - Year-over-year growth 2024-2029 (%)

10.6 Frasch process - Market size and forecast 2024-2029

Chart on Frasch process - Market size and forecast 2024-2029 ($ million)
Data Table on Frasch process - Market size and forecast 2024-2029 ($ million)
Chart on Frasch process - Year-over-year growth 2024-2029 (%)
Data Table on Frasch process - Year-over-year growth 2024-2029 (%)

10.7 Resublimed process - Market size and forecast 2024-2029

Chart on Resublimed process - Market size and forecast 2024-2029 ($ million)
Data Table on Resublimed process - Market size and forecast 2024-2029 ($ million)
Chart on Resublimed process - Year-over-year growth 2024-2029 (%)
Data Table on Resublimed process - Year-over-year growth 2024-2029 (%)

10.8 Market opportunity by Technology

Market opportunity by Technology ($ million)
Data Table on Market opportunity by Technology ($ million)

11. Customer Landscape

11.1 Customer landscape overview

Analysis of price sensitivity, lifecycle, customer purchase basket, adoption rates, and purchase criteria

12. Geographic Landscape

12.1 Geographic segmentation

Chart on Market share by geography 2024-2029 (%)
Data Table on Market share by geography 2024-2029 (%)

12.2 Geographic comparison

Chart on Geographic comparison
Data Table on Geographic comparison

12.3 APAC - Market size and forecast 2024-2029

Chart on APAC - Market size and forecast 2024-2029 ($ million)
Data Table on APAC - Market size and forecast 2024-2029 ($ million)
Chart on APAC - Year-over-year growth 2024-2029 (%)
Data Table on APAC - Year-over-year growth 2024-2029 (%)
Chart on Regional Comparison - APAC
Data Table on Regional Comparison - APAC

12.3.1 China - Market size and forecast 2024-2029

Chart on China - Market size and forecast 2024-2029 ($ million)
Data Table on China - Market size and forecast 2024-2029 ($ million)
Chart on China - Year-over-year growth 2024-2029 (%)
Data Table on China - Year-over-year growth 2024-2029 (%)

12.3.2 Japan - Market size and forecast 2024-2029

Chart on Japan - Market size and forecast 2024-2029 ($ million)
Data Table on Japan - Market size and forecast 2024-2029 ($ million)
Chart on Japan - Year-over-year growth 2024-2029 (%)
Data Table on Japan - Year-over-year growth 2024-2029 (%)

12.3.3 India - Market size and forecast 2024-2029

Chart on India - Market size and forecast 2024-2029 ($ million)
Data Table on India - Market size and forecast 2024-2029 ($ million)
Chart on India - Year-over-year growth 2024-2029 (%)
Data Table on India - Year-over-year growth 2024-2029 (%)

12.3.4 South Korea - Market size and forecast 2024-2029

Chart on South Korea - Market size and forecast 2024-2029 ($ million)
Data Table on South Korea - Market size and forecast 2024-2029 ($ million)
Chart on South Korea - Year-over-year growth 2024-2029 (%)
Data Table on South Korea - Year-over-year growth 2024-2029 (%)

12.3.5 Australia - Market size and forecast 2024-2029

Chart on Australia - Market size and forecast 2024-2029 ($ million)
Data Table on Australia - Market size and forecast 2024-2029 ($ million)
Chart on Australia - Year-over-year growth 2024-2029 (%)
Data Table on Australia - Year-over-year growth 2024-2029 (%)

12.3.6 Indonesia - Market size and forecast 2024-2029

Chart on Indonesia - Market size and forecast 2024-2029 ($ million)
Data Table on Indonesia - Market size and forecast 2024-2029 ($ million)
Chart on Indonesia - Year-over-year growth 2024-2029 (%)
Data Table on Indonesia - Year-over-year growth 2024-2029 (%)

12.4 North America - Market size and forecast 2024-2029

Chart on North America - Market size and forecast 2024-2029 ($ million)
Data Table on North America - Market size and forecast 2024-2029 ($ million)
Chart on North America - Year-over-year growth 2024-2029 (%)
Data Table on North America - Year-over-year growth 2024-2029 (%)
Chart on Regional Comparison - North America
Data Table on Regional Comparison - North America

12.4.1 US - Market size and forecast 2024-2029

Chart on US - Market size and forecast 2024-2029 ($ million)
Data Table on US - Market size and forecast 2024-2029 ($ million)
Chart on US - Year-over-year growth 2024-2029 (%)
Data Table on US - Year-over-year growth 2024-2029 (%)

12.4.2 Canada - Market size and forecast 2024-2029

Chart on Canada - Market size and forecast 2024-2029 ($ million)
Data Table on Canada - Market size and forecast 2024-2029 ($ million)
Chart on Canada - Year-over-year growth 2024-2029 (%)
Data Table on Canada - Year-over-year growth 2024-2029 (%)

12.4.3 Mexico - Market size and forecast 2024-2029

Chart on Mexico - Market size and forecast 2024-2029 ($ million)
Data Table on Mexico - Market size and forecast 2024-2029 ($ million)
Chart on Mexico - Year-over-year growth 2024-2029 (%)
Data Table on Mexico - Year-over-year growth 2024-2029 (%)

12.5 Europe - Market size and forecast 2024-2029

Chart on Europe - Market size and forecast 2024-2029 ($ million)
Data Table on Europe - Market size and forecast 2024-2029 ($ million)
Chart on Europe - Year-over-year growth 2024-2029 (%)
Data Table on Europe - Year-over-year growth 2024-2029 (%)
Chart on Regional Comparison - Europe
Data Table on Regional Comparison - Europe

12.5.1 Germany - Market size and forecast 2024-2029

Chart on Germany - Market size and forecast 2024-2029 ($ million)
Data Table on Germany - Market size and forecast 2024-2029 ($ million)
Chart on Germany - Year-over-year growth 2024-2029 (%)
Data Table on Germany - Year-over-year growth 2024-2029 (%)

12.5.2 UK - Market size and forecast 2024-2029

Chart on UK - Market size and forecast 2024-2029 ($ million)
Data Table on UK - Market size and forecast 2024-2029 ($ million)
Chart on UK - Year-over-year growth 2024-2029 (%)
Data Table on UK - Year-over-year growth 2024-2029 (%)

12.5.3 France - Market size and forecast 2024-2029

Chart on France - Market size and forecast 2024-2029 ($ million)
Data Table on France - Market size and forecast 2024-2029 ($ million)
Chart on France - Year-over-year growth 2024-2029 (%)
Data Table on France - Year-over-year growth 2024-2029 (%)

12.5.4 Italy - Market size and forecast 2024-2029

Chart on Italy - Market size and forecast 2024-2029 ($ million)
Data Table on Italy - Market size and forecast 2024-2029 ($ million)
Chart on Italy - Year-over-year growth 2024-2029 (%)
Data Table on Italy - Year-over-year growth 2024-2029 (%)

12.5.5 The Netherlands - Market size and forecast 2024-2029

Chart on The Netherlands - Market size and forecast 2024-2029 ($ million)
Data Table on The Netherlands - Market size and forecast 2024-2029 ($ million)
Chart on The Netherlands - Year-over-year growth 2024-2029 (%)
Data Table on The Netherlands - Year-over-year growth 2024-2029 (%)

12.5.6 Spain - Market size and forecast 2024-2029

Chart on Spain - Market size and forecast 2024-2029 ($ million)
Data Table on Spain - Market size and forecast 2024-2029 ($ million)
Chart on Spain - Year-over-year growth 2024-2029 (%)
Data Table on Spain - Year-over-year growth 2024-2029 (%)

12.6 Middle East and Africa - Market size and forecast 2024-2029

Chart on Middle East and Africa - Market size and forecast 2024-2029 ($ million)
Data Table on Middle East and Africa - Market size and forecast 2024-2029 ($ million)
Chart on Middle East and Africa - Year-over-year growth 2024-2029 (%)
Data Table on Middle East and Africa - Year-over-year growth 2024-2029 (%)
Chart on Regional Comparison - Middle East and Africa
Data Table on Regional Comparison - Middle East and Africa

12.6.1 Saudi Arabia - Market size and forecast 2024-2029

Chart on Saudi Arabia - Market size and forecast 2024-2029 ($ million)
Data Table on Saudi Arabia - Market size and forecast 2024-2029 ($ million)
Chart on Saudi Arabia - Year-over-year growth 2024-2029 (%)
Data Table on Saudi Arabia - Year-over-year growth 2024-2029 (%)

12.6.2 UAE - Market size and forecast 2024-2029

Chart on UAE - Market size and forecast 2024-2029 ($ million)
Data Table on UAE - Market size and forecast 2024-2029 ($ million)
Chart on UAE - Year-over-year growth 2024-2029 (%)
Data Table on UAE - Year-over-year growth 2024-2029 (%)

12.6.3 South Africa - Market size and forecast 2024-2029

Chart on South Africa - Market size and forecast 2024-2029 ($ million)
Data Table on South Africa - Market size and forecast 2024-2029 ($ million)
Chart on South Africa - Year-over-year growth 2024-2029 (%)
Data Table on South Africa - Year-over-year growth 2024-2029 (%)

12.6.4 Israel - Market size and forecast 2024-2029

Chart on Israel - Market size and forecast 2024-2029 ($ million)
Data Table on Israel - Market size and forecast 2024-2029 ($ million)
Chart on Israel - Year-over-year growth 2024-2029 (%)
Data Table on Israel - Year-over-year growth 2024-2029 (%)

12.6.5 Turkey - Market size and forecast 2024-2029

Chart on Turkey - Market size and forecast 2024-2029 ($ million)
Data Table on Turkey - Market size and forecast 2024-2029 ($ million)
Chart on Turkey - Year-over-year growth 2024-2029 (%)
Data Table on Turkey - Year-over-year growth 2024-2029 (%)

12.7 South America - Market size and forecast 2024-2029

Chart on South America - Market size and forecast 2024-2029 ($ million)
Data Table on South America - Market size and forecast 2024-2029 ($ million)
Chart on South America - Year-over-year growth 2024-2029 (%)
Data Table on South America - Year-over-year growth 2024-2029 (%)
Chart on Regional Comparison - South America
Data Table on Regional Comparison - South America

12.7.1 Brazil - Market size and forecast 2024-2029

Chart on Brazil - Market size and forecast 2024-2029 ($ million)
Data Table on Brazil - Market size and forecast 2024-2029 ($ million)
Chart on Brazil - Year-over-year growth 2024-2029 (%)
Data Table on Brazil - Year-over-year growth 2024-2029 (%)

12.7.2 Argentina - Market size and forecast 2024-2029

Chart on Argentina - Market size and forecast 2024-2029 ($ million)
Data Table on Argentina - Market size and forecast 2024-2029 ($ million)
Chart on Argentina - Year-over-year growth 2024-2029 (%)
Data Table on Argentina - Year-over-year growth 2024-2029 (%)

12.7.3 Colombia - Market size and forecast 2024-2029

Chart on Colombia - Market size and forecast 2024-2029 ($ million)
Data Table on Colombia - Market size and forecast 2024-2029 ($ million)
Chart on Colombia - Year-over-year growth 2024-2029 (%)
Data Table on Colombia - Year-over-year growth 2024-2029 (%)

12.8 Market opportunity by geography

Market opportunity by geography ($ million)
Data Tables on Market opportunity by geography ($ million)

13. Drivers, Challenges, and Opportunity

13.1 Market drivers

Stringent environmental regulations on hydrocarbon desulfurization
Increase in production of sulfuric acid
Regulations emphasizing water conservation

13.2 Market challenges

Inherent supply inelasticity and geopolitical volatility
Adoption of organic farming
Fluctuations in raw material prices

13.3 Impact of drivers and challenges

Impact of drivers and challenges in 2024 and 2029

13.4 Market opportunities

Strategic regional supply-demand imbalances and logistical arbitrage
Capacity expansions and new plant additions
Recovery of by-product sulfuric acid at smelters

14. Competitive Landscape

14.1 Overview

14.2

Overview on criticality of inputs and factors of differentiation

14.3 Landscape disruption

Overview on factors of disruption

14.4 Industry risks

Impact of key risks on business

15. Competitive Analysis

15.1 Companies profiled

Companies covered

15.2 Company ranking index

15.3 Market positioning of companies

Matrix on companies position and classification

15.4 Akzo Nobel NV

Akzo Nobel NV - Overview
Akzo Nobel NV - Business segments
Akzo Nobel NV - Key news
Akzo Nobel NV - Key offerings
Akzo Nobel NV - Segment focus
SWOT

15.5 Chemtrade Logistics Income Fund

Chemtrade Logistics Income Fund - Overview
Chemtrade Logistics Income Fund - Business segments
Chemtrade Logistics Income Fund - Key offerings
Chemtrade Logistics Income Fund - Segment focus
SWOT

15.6 Chevron Corp.

Chevron Corp. - Overview
Chevron Corp. - Business segments
Chevron Corp. - Key news
Chevron Corp. - Key offerings
Chevron Corp. - Segment focus
SWOT

15.7 Eidon Ionic Minerals

Eidon Ionic Minerals - Overview
Eidon Ionic Minerals - Product / Service
Eidon Ionic Minerals - Key offerings
SWOT

15.8 H.J. Baker and Bro. LLC.

H.J. Baker and Bro. LLC. - Overview
H.J. Baker and Bro. LLC. - Product / Service
H.J. Baker and Bro. LLC. - Key offerings
SWOT

15.9 Kuwait National Petroleum Co.

Kuwait National Petroleum Co. - Overview
Kuwait National Petroleum Co. - Product / Service
Kuwait National Petroleum Co. - Key offerings
SWOT

15.10 Marathon Petroleum Corp.

Marathon Petroleum Corp. - Overview
Marathon Petroleum Corp. - Business segments
Marathon Petroleum Corp. - Key offerings
Marathon Petroleum Corp. - Segment focus
SWOT

15.11 Martin Midstream Partners L.P.

Martin Midstream Partners L.P. - Overview
Martin Midstream Partners L.P. - Product / Service
Martin Midstream Partners L.P. - Key offerings
SWOT

15.12 Moeve, S.A.

Moeve, S.A. - Overview
Moeve, S.A. - Product / Service
Moeve, S.A. - Key offerings
SWOT

15.13 Montana Sulphur and Chemical Co.

Montana Sulphur and Chemical Co. - Overview
Montana Sulphur and Chemical Co. - Product / Service
Montana Sulphur and Chemical Co. - Key offerings
SWOT

15.14 QUADRIMEX CHEMICAL

QUADRIMEX CHEMICAL - Overview
QUADRIMEX CHEMICAL - Product / Service
QUADRIMEX CHEMICAL - Key offerings
SWOT

15.15 Sasol Ltd.

Sasol Ltd. - Overview
Sasol Ltd. - Business segments
Sasol Ltd. - Key news
Sasol Ltd. - Key offerings
Sasol Ltd. - Segment focus
SWOT

15.16 Sikko Industries Ltd.

Sikko Industries Ltd. - Overview
Sikko Industries Ltd. - Product / Service
Sikko Industries Ltd. - Key offerings
SWOT

15.17 Suncor Energy Inc.

Suncor Energy Inc. - Overview
Suncor Energy Inc. - Business segments
Suncor Energy Inc. - Key offerings
Suncor Energy Inc. - Segment focus
SWOT

15.18 Teck Resources Ltd.

Teck Resources Ltd. - Overview
Teck Resources Ltd. - Business segments
Teck Resources Ltd. - Key offerings
Teck Resources Ltd. - Segment focus
SWOT

16. Appendix

16.1 Scope of the report

Market definition
Objectives
Notes and caveats

16.2 Inclusions and exclusions checklist

Inclusions checklist
Exclusions checklist

16.3 Currency conversion rates for US$

16.4 Research methodology

16.5 Data procurement

Information sources

16.6 Data validation

16.7 Validation techniques employed for market sizing

16.8 Data synthesis

16.9 360 degree market analysis

16.10 List of abbreviations

Research Methodology

Technavio presents a detailed picture of the market by way of study, synthesis, and summation of data from multiple sources. The analysts have presented the various facets of the market with a particular focus on identifying the key industry influencers. The data thus presented is comprehensive, reliable, and the result of extensive research, both primary and secondary.

INFORMATION SOURCES

Primary sources

  • Manufacturers and suppliers
  • Channel partners
  • Industry experts
  • Strategic decision makers

Secondary sources

  • Industry journals and periodicals
  • Government data
  • Financial reports of key industry players
  • Historical data
  • Press releases

DATA ANALYSIS

Data Synthesis

  • Collation of data
  • Estimation of key figures
  • Analysis of derived insights

Data Validation

  • Triangulation with data models
  • Reference against proprietary databases
  • Corroboration with industry experts

REPORT WRITING

Qualitative

  • Market drivers
  • Market challenges
  • Market trends
  • Five forces analysis

Quantitative

  • Market size and forecast
  • Market segmentation
  • Geographical insights
  • Competitive landscape

Interested in this report?

Get your sample now to see our research methodology and insights!

Download Now

Frequently Asked Questions

Molten Sulfur market growth will increase by USD 131.8 million during 2025-2029.

The Molten Sulfur market is expected to grow at a CAGR of 2.8% during 2025-2029.

Molten Sulfur market is segmented by Application (Sulfuric acid, Rubbers, Detergents, Fungicides and fertilizers, Others) End-user (Fertilizer and agro-chemicals, Chemicals and petrochemicals, Oil and gas refining, Mining and metallurgy, Others) Technology (Claus process, Granulation, Shell process, Frasch process, Resublimed process)

A. J. Edmond Company, Abu Dhabi National Oil Co., Akzo Nobel NV, Chemtrade Logistics Income Fund, Chevron Corp., Eidon Ionic Minerals, H.J. Baker and Bro. LLC., Hindustan Petroleum Corp. Ltd., Kuwait National Petroleum Co., Marathon Petroleum Corp., Martin Midstream Partners L.P., Moeve, S.A., Montana Sulphur and Chemical Co., QUADRIMEX CHEMICAL, Repsol SA, Sasol Ltd., Sikko Industries Ltd., Suncor Energy Inc., Teck Resources Ltd., Tengizchevroil LLP are a few of the key vendors in the Molten Sulfur market.

APAC will register the highest growth rate of 47.3% among the other regions. Therefore, the Molten Sulfur market in APAC is expected to garner significant business opportunities for the vendors during the forecast period.

China, Japan, India, South Korea, Australia, Indonesia, US, Canada, Mexico, Germany, UK, France, Italy, The Netherlands, Spain, Saudi Arabia, UAE, South Africa, Israel, Turkey, Brazil, Argentina, Colombia

  • Stringent environmental regulations on hydrocarbon desulfurization is the driving factor this market.

The Molten Sulfur market vendors should focus on grabbing business opportunities from the Application segment as it accounted for the largest market share in the base year.