Mobility Demand Market Analysis APAC, North America, Europe, South America, Middle East and Africa - US, China, Japan, UK, Germany - Size and Forecast 2024-2028

Mobility Demand Market Analysis APAC, North America, Europe, South America, Middle East and Africa - US, China, Japan, UK, Germany - Size and Forecast 2024-2028

Published: Oct 2024 138 Pages SKU: IRTNTR71802

Market Overview at a Glance

$268.3 B
Market Opportunity
21.5%
CAGR
16.5
YoY growth 2023-2024(%)

Mobility Demand Market Size 2024-2028 

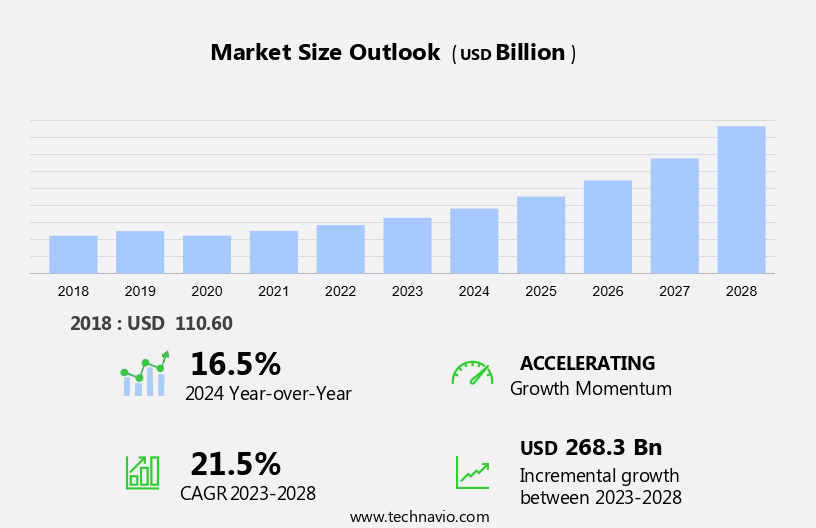
The mobility demand market size is forecast to increase by USD 268.3 million at a CAGR of 21.5% between 2023 and 2028.

  • The market is experiencing significant growth due to the increasing preference for integrated mobility solutions that cater to travellers' personal choices and trip satisfaction. This trend is driven by urban transportation challenges such as congestion and the existence of transit deserts, which are areas not serviced by public transportation. To address these issues, both public transportation systems and private enterprise options are exploring MOD solutions, focusing on first-mile and last-mile connectivity. The adoption of MOD is further driven by the growing interest in self-driving vehicles and increasing investments in autonomous car production. However, the varying transport policies of different countries and resistance from traditional transport services present challenges to the MOD market's growth. Corporations are also showing interest in MOD for their transportation needs, adding to the market's potential. 

What will the size of the market be during the forecast period?

Mobility Demand Market Size

 Request Free Sample

  • Mobility on Demand (MOD) is an evolving concept that focuses on providing travelers with flexible, personalized transportation solutions. This approach combines the benefits of public transportation and private enterprise options to cater to the diverse needs of urban commuters. Public transportation plays a crucial role in addressing urban transportation challenges, such as congestion reduction and providing access to areas known as transit deserts. However, it often faces limitations in terms of fixed routes and schedules. MOD aims to bridge this gap by offering on-demand services that prioritize traveler-focused experiences.
  • Private enterprise options, including ride-sharing services, executive cars, and emerging technologies like Connected and Autonomous Vehicles (CAVs), offer personalized, door-to-door transportation. However, they can contribute to traffic congestion and may not be accessible or affordable for everyone. MOD seeks to optimize these services by integrating them with public transportation and promoting connectivity. The success of MOD relies on several factors, including real-time data, intelligent transportation systems (ITS), and the increasing usage of smartphones, 5G networks, and telecom infrastructure. Onboard Units (OBUs) and Roadside Units (RSUs) enable seamless communication between vehicles and the transportation network, allowing for vehicle platooning and improved traffic flow.

How is this market segmented and which is the largest segment?

The market research report provides comprehensive data (region-wise segment analysis), with forecasts and estimates in "USD billion" for the period 2024-2028, as well as historical data from 2018-2022 for the following segments.
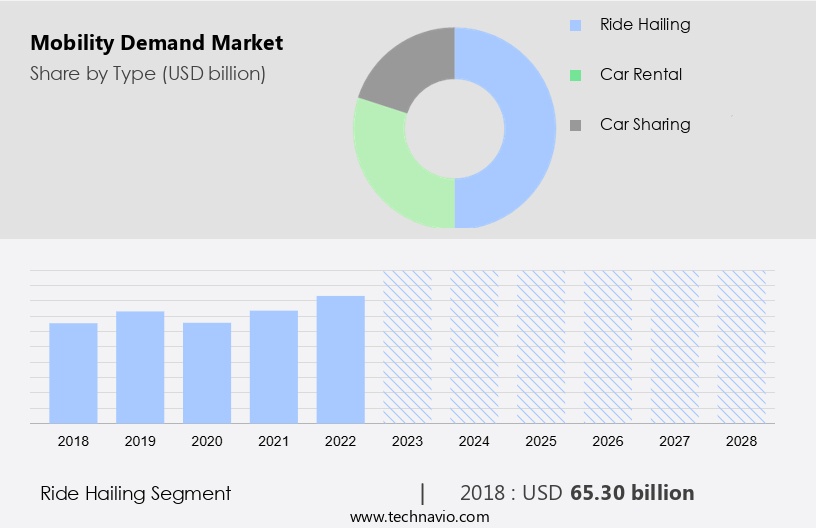
  • Type
    • Ride hailing
    • Car rental
    • Car sharing
  • Geography
    • APAC
      • China
      • Japan
    • North America
      • US
    • Europe
      • Germany
      • UK
    • South America
    • Middle East and Africa

By Type Insights

  • The ride hailing segment is estimated to witness significant growth during the forecast period.

Mobility on Demand, or MOD, represents an integrated mobility solution that caters to the travel needs of consumers in urban areas. This system offers both public transportation and private enterprise options, allowing individuals the freedom of personal choice. MOD prioritizes trip satisfaction by addressing the challenges of urban transportation, such as congestion and the existence of transit deserts. Traditional fixed routes and schedules are supplemented through the provision of first-mile and last-mile solutions. Corporations have also adopted MOD for their transportation needs, streamlining the process and enhancing employee productivity.

Mobility Demand Market Size

Get a glance at the market report of share of various segments Request Free Sample

The ride hailing segment was valued at USD 65.30 billion in 2018 and showed a gradual increase during the forecast period.

Regional Analysis

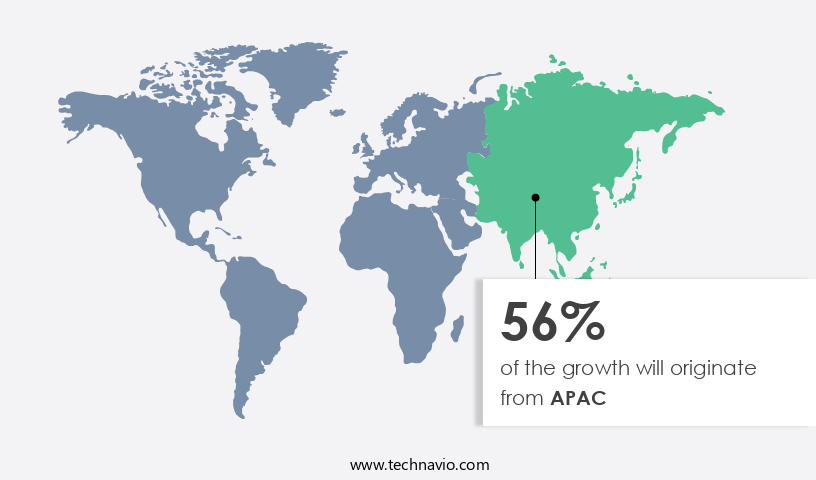
  • APAC is estimated to contribute 56% to the growth of the global market during the forecast period.

Technavio's analysts have elaborately explained the regional trends and drivers that shape the market during the forecast period.

Mobility Demand Market Share by Geography

For more insights on the market share of various regions, Request Free Sample

In the global mobility landscape, the Asia Pacific region (APAC) holds the largest market share in 2023, driven by factors such as increasing disposable income, improving connectivity, and regulatory changes. Gett Inc., in partnership with Ericsson, offers a digital key for cars, enhancing the appeal of car-sharing services. This collaboration is a testament to the growing trend of shared and smart mobility solutions. In developing countries like India and China, economic growth has led to an increase in disposable income, making cost-effective transport options like e-bikes and bike sharing more popular. Furthermore, the relaxation of foreign direct investment (FDI) regulations in these markets will encourage the expansion of fleet sizes for both shared and traditional mobility providers. The advent of 5G networks and the widespread use of smartphones are expected to further fuel the growth of the mobility market in APAC.

Market Dynamics

Our researchers analyzed the data with 2023 as the base year, along with the key drivers, trends, and challenges. A holistic analysis of drivers will help companies refine their marketing strategies to gain a competitive advantage.

What are the key market drivers leading to the rise in the adoption of Mobility Demand Market?

Growing interest in self-driving vehicles is the key driver of the market.

  • Self-driving vehicles, or autonomous vehicles, are revolutionizing the transportation sector in the United States and beyond. These advanced vehicles are no longer confined to the realm of science fiction but are becoming a tangible reality in urban areas. Key industry players, including original equipment manufacturers (OEMs), technology providers, and suppliers, are actively investing in autonomous vehicle technology. Autonomous vehicles come in various forms, from single-lane highway driving to traffic jam autopilot. The technology is not limited to urban transportation; it also extends to intercity transport and electrification. The adoption of self-driving vehicles aligns with the United Nations' objective of creating safer, more resilient, inclusive, and sustainable cities.
  • Telecom infrastructure plays a crucial role in enabling autonomous vehicle technology. Onboard Units (OBUs) and Roadside Units (RSUs) facilitate seamless communication between vehicles and their surroundings. Vehicle platooning, a form of autonomous driving, relies on this communication for efficient traffic management. Mobility operators and public transport operators are also integrating autonomous vehicles into their services. Ticketing systems and payment systems are being updated to accommodate this shift. Data management is a significant concern, with the need for secure and efficient handling of vast amounts of data generated by autonomous vehicles. The complexity of autonomous vehicle software and the transition to a subscription-based mobility model further add to the challenges. The transportation industry is undergoing a significant transformation, and stakeholders must navigate these changes while ensuring safety, reliability, and user experience.

What are the market trends shaping the Mobility Demand Market?

Increasing investments in autonomous car production is the upcoming trend in the market.

  • The market encompasses various modes of transportation, including executive and luxury cars, SUVs, MUVs, economy cars, and emerging advanced mobility solutions such as electric and hybrid vehicles, self-driving cars, and connected vehicles. Investments in autonomous car production are driving the adoption of car-sharing services, electronic control units, sensors, and wiring.
  •  Fleet management, public transport, car rental services, e-hailing, and transportation booking are also integral parts of the market. Peer-to-peer car rental platforms are gaining popularity, offering flexibility and convenience to consumers. Key players in the market include car manufacturers, technology companies, and mobility service providers. The market is expected to grow significantly due to the increasing demand for sustainable and efficient transportation solutions.

What challenges does the Mobility Demand Market face during the growth?

Varying transport policies of different countries and resistance from traditional transport services is a key challenge affecting market growth.

  • In today's complex supply chain management environment, the integration of app-based mobility services into freight services is a growing trend. However, the lack of clear regulations for these services poses challenges for providers, particularly those who do not own vehicles. Moreover, the increasing importance of data privacy and security in the transportation industry necessitates compliance with various data protection laws, such as the California Consumer Privacy Act (CCPA). These regulations govern the collection, use, transfer, and storage of personally identifiable information and other data.
  • Freight brokering companies can leverage technology platforms, such as Intelligent Transportation Systems (ITS) and real-time data, to optimize their operations and reduce traffic congestion. The adoption of electric vehicles (EVs) and on-demand mobility services, like smart personal mobility, is also gaining momentum. To stay competitive, freight brokers must adapt to these trends and ensure compliance with relevant regulations. Technology solutions, such as ITS and data analytics, can help streamline operations and improve efficiency, while electric vehicles and on-demand services can reduce emissions and enhance customer experience.

Exclusive Customer Landscape

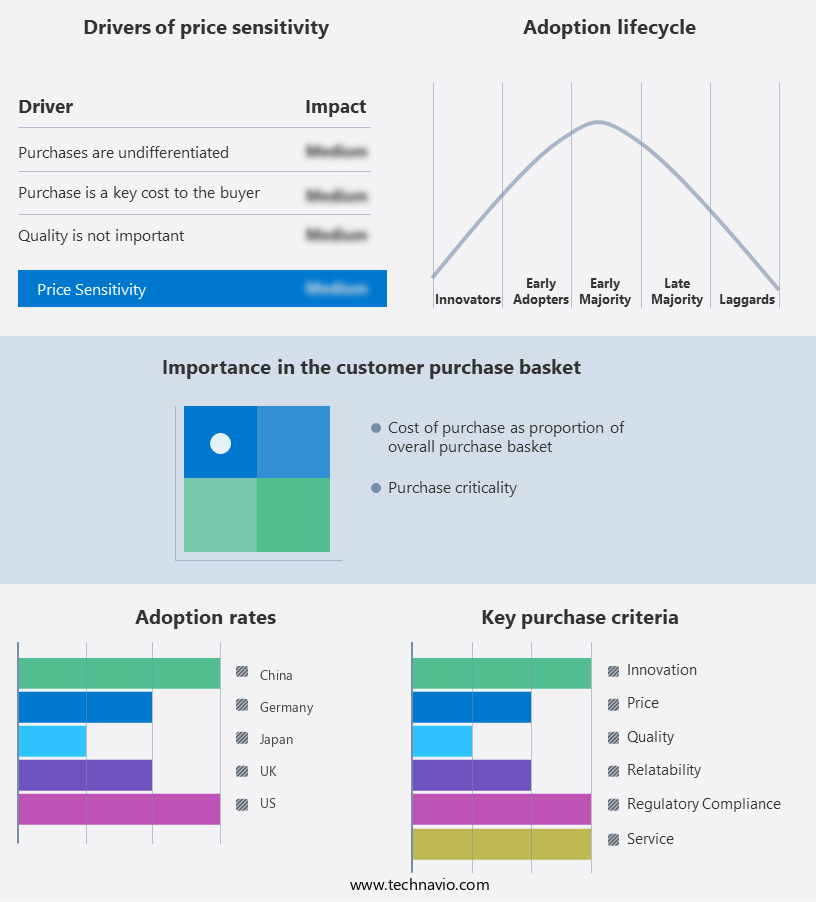
The market forecasting report includes the adoption lifecycle of the market, covering from the innovator's stage to the laggard's stage. It focuses on adoption rates in different regions based on penetration. Furthermore, the market report also includes key purchase criteria and drivers of price sensitivity to help companies evaluate and develop their market growth analysis strategies.

Mobility Demand Market Share by Geography

 Customer Landscape

Key Companies & Market Insights

Companies are implementing various strategies, such as strategic alliances, market forecast, partnerships, mergers and acquisitions, geographical expansion, and product/service launches, to enhance their presence in the market. The market research and growth report includes detailed analyses of the competitive landscape of the market and information about key companies, including:

  • ANI Technologies Pvt. Ltd.
  • Aptiv Plc
  • Comuto SA
  • BMW AG
  • Cabify Espana SL
  • DENSO Corp.
  • Ford Motor Co.
  • General Motors Co.
  • GT Gettaxi UK Ltd.
  • Grab Holdings Ltd.
  • Intel Corp.
  • International Business Machines Corp.
  • Lyft Inc.
  • Orix Corp.
  • Robert Bosch GmbH
  • TomTom NV
  • Toyota Motor Corp.
  • Uber Technologies Inc.
  • Waymo LLC

Qualitative and quantitative analysis of companies has been conducted to help clients understand the wider business environment as well as the strengths and weaknesses of key market players. Data is qualitatively analyzed to categorize companies as pure play, category-focused, industry-focused, and diversified; it is quantitatively analyzed to categorize companies as dominant, leading, strong, tentative, and weak.

Research Analyst Overview

Mobility on Demand (MOD) is revolutionizing urban and intercity transportation by offering integrated mobility solutions that cater to the personal choices of travelers. MOD encompasses various transport modalities, including public transportation, private enterprise options, ride-hailing, ride-sharing, carpool services, bike pool services, and e-bikes. These services focus on trip satisfaction by addressing urban transportation challenges such as congestion reduction and providing solutions for transit deserts. MOD services offer real-time data and intelligent transportation systems (ITS) to optimize travel, reduce energy consumption, and promote zero carbon emissions. The integration of artificial intelligence (AI) and advanced mobility solutions in MOD enhances connectivity through the use of smartphones, 5G networks, onboard units (OBUs), and roadside units (RSUs).

Furthermore, MOD services cater to various sectors, including corporate transportation, paratransit, dial-a-ride, university shuttle services, and freight services. The subscription-based mobility model and fleet expansion enable cost-effective transport and the electrification of vehicles, including executive cars, luxury cars, SUVs, MUVs, economy cars, and electric vehicles. MOD operators face challenges in managing software complexity and data, requiring strong ticketing and payment systems. The integration of technology platforms and the expansion of e-bike demand and sharing fleets contribute to the smart mobility landscape, offering a sustainable and efficient alternative to traditional modes of transport.

Market Scope

Report Coverage

Details

Page number

138

Base year

2023

Historic period

2018-2022

Forecast period

2024-2028

Growth momentum & CAGR

Accelerate at a CAGR of 21.5%

Market Growth 2024-2028

USD 268.3 billion

Market structure

Fragmented

YoY growth 2023-2024(%)

16.5

Key countries

US, China, Japan, UK, and Germany

Competitive landscape

Leading Companies, Market Positioning of Companies, Competitive Strategies, and Industry Risks

Request Free Sample

What are the Key Data Covered in this Market Research and Growth Report?

  • CAGR of the market during the forecast period
  • Detailed information on factors that will drive the market growth and forecasting between 2024 and 2028
  • Precise estimation of the size of the market  and its contribution of the market in focus to the parent market
  • Accurate predictions about upcoming market growth and trends and changes in consumer behaviour
  • Growth of the market across APAC, North America, Europe, South America, and Middle East and Africa
  • Thorough analysis of the market's competitive landscape and detailed information about companies
  • Comprehensive analysis of factors that will challenge the growth of market companies

We can help! Our analysts can customize this market research report to meet your requirements. Get in touch

1 Executive Summary

  • 1.1 Market overview
    • Executive Summary - Chart on Market Overview
    • Executive Summary - Data Table on Market Overview
    • Executive Summary - Chart on Global Market Characteristics
    • Executive Summary - Chart on Market by Geography
    • Executive Summary - Chart on Market Segmentation by Type
    • Executive Summary - Chart on Incremental Growth
    • Executive Summary - Data Table on Incremental Growth
    • Executive Summary - Chart on Company Market Positioning

2 Market Landscape

  • 2.1 Market ecosystem
    • Parent Market
    • Data Table on - Parent Market
  • 2.2 Market characteristics
    • Market characteristics analysis
  • 2.3 Value chain analysis
    • Value Chain Analysis

3 Market Sizing

  • 3.1 Market definition
    • Offerings of companies included in the market definition
  • 3.2 Market segment analysis
    • Market segments
  • 3.3 Market size 2023
    • 3.4 Market outlook: Forecast for 2023-2028
      • Chart on Global - Market size and forecast 2023-2028 ($ billion)
      • Data Table on Global - Market size and forecast 2023-2028 ($ billion)
      • Chart on Global Market: Year-over-year growth 2023-2028 (%)
      • Data Table on Global Market: Year-over-year growth 2023-2028 (%)

    4 Historic Market Size

    • 4.1 Global Mobility Demand Market 2018 - 2022
      • Historic Market Size - Data Table on Global Mobility Demand Market 2018 - 2022 ($ billion)
    • 4.2 Type segment analysis 2018 - 2022
      • Historic Market Size - Type Segment 2018 - 2022 ($ billion)
    • 4.3 Geography segment analysis 2018 - 2022
      • Historic Market Size - Geography Segment 2018 - 2022 ($ billion)
    • 4.4 Country segment analysis 2018 - 2022
      • Historic Market Size - Country Segment 2018 - 2022 ($ billion)

    5 Five Forces Analysis

    • 5.1 Five forces summary
      • Five forces analysis - Comparison between 2023 and 2028
    • 5.2 Bargaining power of buyers
      • Bargaining power of buyers - Impact of key factors 2023 and 2028
    • 5.3 Bargaining power of suppliers
      • Bargaining power of suppliers - Impact of key factors in 2023 and 2028
    • 5.4 Threat of new entrants
      • Threat of new entrants - Impact of key factors in 2023 and 2028
    • 5.5 Threat of substitutes
      • Threat of substitutes - Impact of key factors in 2023 and 2028
    • 5.6 Threat of rivalry
      • Threat of rivalry - Impact of key factors in 2023 and 2028
    • 5.7 Market condition
      • Chart on Market condition - Five forces 2023 and 2028

    6 Market Segmentation by Type

    • 6.1 Market segments
      • Chart on Type - Market share 2023-2028 (%)
      • Data Table on Type - Market share 2023-2028 (%)
    • 6.2 Comparison by Type
      • Chart on Comparison by Type
      • Data Table on Comparison by Type
    • 6.3 Ride hailing - Market size and forecast 2023-2028
      • Chart on Ride hailing - Market size and forecast 2023-2028 ($ billion)
      • Data Table on Ride hailing - Market size and forecast 2023-2028 ($ billion)
      • Chart on Ride hailing - Year-over-year growth 2023-2028 (%)
      • Data Table on Ride hailing - Year-over-year growth 2023-2028 (%)
    • 6.4 Car rental - Market size and forecast 2023-2028
      • Chart on Car rental - Market size and forecast 2023-2028 ($ billion)
      • Data Table on Car rental - Market size and forecast 2023-2028 ($ billion)
      • Chart on Car rental - Year-over-year growth 2023-2028 (%)
      • Data Table on Car rental - Year-over-year growth 2023-2028 (%)
    • 6.5 Car sharing - Market size and forecast 2023-2028
      • Chart on Car sharing - Market size and forecast 2023-2028 ($ billion)
      • Data Table on Car sharing - Market size and forecast 2023-2028 ($ billion)
      • Chart on Car sharing - Year-over-year growth 2023-2028 (%)
      • Data Table on Car sharing - Year-over-year growth 2023-2028 (%)
    • 6.6 Market opportunity by Type
      • Market opportunity by Type ($ billion)
      • Data Table on Market opportunity by Type ($ billion)

    7 Customer Landscape

    • 7.1 Customer landscape overview
      • Analysis of price sensitivity, lifecycle, customer purchase basket, adoption rates, and purchase criteria

    8 Geographic Landscape

    • 8.1 Geographic segmentation
      • Chart on Market share by geography 2023-2028 (%)
      • Data Table on Market share by geography 2023-2028 (%)
    • 8.2 Geographic comparison
      • Chart on Geographic comparison
      • Data Table on Geographic comparison
    • 8.3 APAC - Market size and forecast 2023-2028
      • Chart on APAC - Market size and forecast 2023-2028 ($ billion)
      • Data Table on APAC - Market size and forecast 2023-2028 ($ billion)
      • Chart on APAC - Year-over-year growth 2023-2028 (%)
      • Data Table on APAC - Year-over-year growth 2023-2028 (%)
    • 8.4 North America - Market size and forecast 2023-2028
      • Chart on North America - Market size and forecast 2023-2028 ($ billion)
      • Data Table on North America - Market size and forecast 2023-2028 ($ billion)
      • Chart on North America - Year-over-year growth 2023-2028 (%)
      • Data Table on North America - Year-over-year growth 2023-2028 (%)
    • 8.5 Europe - Market size and forecast 2023-2028
      • Chart on Europe - Market size and forecast 2023-2028 ($ billion)
      • Data Table on Europe - Market size and forecast 2023-2028 ($ billion)
      • Chart on Europe - Year-over-year growth 2023-2028 (%)
      • Data Table on Europe - Year-over-year growth 2023-2028 (%)
    • 8.6 South America - Market size and forecast 2023-2028
      • Chart on South America - Market size and forecast 2023-2028 ($ billion)
      • Data Table on South America - Market size and forecast 2023-2028 ($ billion)
      • Chart on South America - Year-over-year growth 2023-2028 (%)
      • Data Table on South America - Year-over-year growth 2023-2028 (%)
    • 8.7 Middle East and Africa - Market size and forecast 2023-2028
      • Chart on Middle East and Africa - Market size and forecast 2023-2028 ($ billion)
      • Data Table on Middle East and Africa - Market size and forecast 2023-2028 ($ billion)
      • Chart on Middle East and Africa - Year-over-year growth 2023-2028 (%)
      • Data Table on Middle East and Africa - Year-over-year growth 2023-2028 (%)
    • 8.8 US - Market size and forecast 2023-2028
      • Chart on US - Market size and forecast 2023-2028 ($ billion)
      • Data Table on US - Market size and forecast 2023-2028 ($ billion)
      • Chart on US - Year-over-year growth 2023-2028 (%)
      • Data Table on US - Year-over-year growth 2023-2028 (%)
    • 8.9 China - Market size and forecast 2023-2028
      • Chart on China - Market size and forecast 2023-2028 ($ billion)
      • Data Table on China - Market size and forecast 2023-2028 ($ billion)
      • Chart on China - Year-over-year growth 2023-2028 (%)
      • Data Table on China - Year-over-year growth 2023-2028 (%)
    • 8.10 Japan - Market size and forecast 2023-2028
      • Chart on Japan - Market size and forecast 2023-2028 ($ billion)
      • Data Table on Japan - Market size and forecast 2023-2028 ($ billion)
      • Chart on Japan - Year-over-year growth 2023-2028 (%)
      • Data Table on Japan - Year-over-year growth 2023-2028 (%)
    • 8.11 UK - Market size and forecast 2023-2028
      • Chart on UK - Market size and forecast 2023-2028 ($ billion)
      • Data Table on UK - Market size and forecast 2023-2028 ($ billion)
      • Chart on UK - Year-over-year growth 2023-2028 (%)
      • Data Table on UK - Year-over-year growth 2023-2028 (%)
    • 8.12 Germany - Market size and forecast 2023-2028
      • Chart on Germany - Market size and forecast 2023-2028 ($ billion)
      • Data Table on Germany - Market size and forecast 2023-2028 ($ billion)
      • Chart on Germany - Year-over-year growth 2023-2028 (%)
      • Data Table on Germany - Year-over-year growth 2023-2028 (%)
    • 8.13 Market opportunity by geography
      • Market opportunity by geography ($ billion)
      • Data Tables on Market opportunity by geography ($ billion)

    9 Drivers, Challenges, and Opportunity/Restraints

    • 9.1 Market drivers
      • 9.2 Market challenges
        • 9.3 Impact of drivers and challenges
          • Impact of drivers and challenges in 2023 and 2028
        • 9.4 Market opportunities/restraints

          10 Competitive Landscape

          • 10.1 Overview
            • 10.2 Competitive Landscape
              • Overview on criticality of inputs and factors of differentiation
            • 10.3 Landscape disruption
              • Overview on factors of disruption
            • 10.4 Industry risks
              • Impact of key risks on business

            11 Competitive Analysis

            • 11.1 Companies profiled
              • Companies covered
            • 11.2 Market positioning of companies
              • Matrix on companies position and classification
            • 11.3 ANI Technologies Pvt. Ltd.
              • ANI Technologies Pvt. Ltd. - Overview
              • ANI Technologies Pvt. Ltd. - Product / Service
              • ANI Technologies Pvt. Ltd. - Key offerings
            • 11.4 Aptiv Plc
              • Aptiv Plc - Overview
              • Aptiv Plc - Business segments
              • Aptiv Plc - Key news
              • Aptiv Plc - Key offerings
              • Aptiv Plc - Segment focus
            • 11.5 Comuto SA
              • Comuto SA - Overview
              • Comuto SA - Product / Service
              • Comuto SA - Key offerings
            • 11.6 DENSO Corp.
              • DENSO Corp. - Overview
              • DENSO Corp. - Business segments
              • DENSO Corp. - Key news
              • DENSO Corp. - Key offerings
              • DENSO Corp. - Segment focus
            • 11.7 Grab Holdings Ltd.
              • Grab Holdings Ltd. - Overview
              • Grab Holdings Ltd. - Business segments
              • Grab Holdings Ltd. - Key offerings
              • Grab Holdings Ltd. - Segment focus
            • 11.8 Intel Corp.
              • Intel Corp. - Overview
              • Intel Corp. - Business segments
              • Intel Corp. - Key news
              • Intel Corp. - Key offerings
              • Intel Corp. - Segment focus
            • 11.9 International Business Machines Corp.
              • International Business Machines Corp. - Overview
              • International Business Machines Corp. - Business segments
              • International Business Machines Corp. - Key news
              • International Business Machines Corp. - Key offerings
              • International Business Machines Corp. - Segment focus
            • 11.10 Lyft Inc.
              • Lyft Inc. - Overview
              • Lyft Inc. - Product / Service
              • Lyft Inc. - Key offerings
            • 11.11 Robert Bosch GmbH
              • Robert Bosch GmbH - Overview
              • Robert Bosch GmbH - Product / Service
              • Robert Bosch GmbH - Key news
              • Robert Bosch GmbH - Key offerings
            • 11.12 Uber Technologies Inc.
              • Uber Technologies Inc. - Overview
              • Uber Technologies Inc. - Business segments
              • Uber Technologies Inc. - Key offerings
              • Uber Technologies Inc. - Segment focus

            12 Appendix

            • 12.1 Scope of the report
              • 12.2 Inclusions and exclusions checklist
                • Inclusions checklist
                • Exclusions checklist
              • 12.3 Currency conversion rates for US$
                • Currency conversion rates for US$
              • 12.4 Research methodology
                • Research methodology
              • 12.5 Data procurement
                • Information sources
              • 12.6 Data validation
                • Data validation
              • 12.7 Validation techniques employed for market sizing
                • Validation techniques employed for market sizing
              • 12.8 Data synthesis
                • Data synthesis
              • 12.9 360 degree market analysis
                • 360 degree market analysis
              • 12.10 List of abbreviations
                • List of abbreviations

              Research Methodology

              Technavio presents a detailed picture of the market by way of study, synthesis, and summation of data from multiple sources. The analysts have presented the various facets of the market with a particular focus on identifying the key industry influencers. The data thus presented is comprehensive, reliable, and the result of extensive research, both primary and secondary.

              INFORMATION SOURCES

              Primary sources

              • Manufacturers and suppliers
              • Channel partners
              • Industry experts
              • Strategic decision makers

              Secondary sources

              • Industry journals and periodicals
              • Government data
              • Financial reports of key industry players
              • Historical data
              • Press releases

              DATA ANALYSIS

              Data Synthesis

              • Collation of data
              • Estimation of key figures
              • Analysis of derived insights

              Data Validation

              • Triangulation with data models
              • Reference against proprietary databases
              • Corroboration with industry experts

              REPORT WRITING

              Qualitative

              • Market drivers
              • Market challenges
              • Market trends
              • Five forces analysis

              Quantitative

              • Market size and forecast
              • Market segmentation
              • Geographical insights
              • Competitive landscape

              Interested in this report?

              Get your sample now to see our research methodology and insights!

              Download Now

              Frequently Asked Questions

              Mobility Demand market growth will increase by $ 268.3 bn during 2024-2028.

              The Mobility Demand market is expected to grow at a CAGR of 21.5% during 2024-2028.

              Mobility Demand market is segmented by Type( Ride hailing, Car rental, Car sharing)

              ANI Technologies Pvt. Ltd., Aptiv Plc, Comuto SA, BMW AG, Cabify Espana SL, DENSO Corp., Ford Motor Co., General Motors Co., GT Gettaxi UK Ltd., Grab Holdings Ltd., Intel Corp., International Business Machines Corp., Lyft Inc., Orix Corp., Robert Bosch GmbH, TomTom NV, Toyota Motor Corp., Uber Technologies Inc., Waymo LLC are a few of the key vendors in the Mobility Demand market.

              APAC will register the highest growth rate of 56% among the other regions. Therefore, the Mobility Demand market in APAC is expected to garner significant business opportunities for the vendors during the forecast period.

              US, China, Japan, UK, Germany

              • Growing interest in self-driving vehiclesSelf-driving vehicles (SDV) are also known as autonomous vehicles. They have evolved from the pages of sci-fiction to be the new urban reality. Multiple parties are already working on autonomous vehicle technology. There are SDVs with a wide range of capabilities such as single-lane highway driving is the driving factor this market.
              • autonomous driving is the driving factor this market.
              • and traffic jam autopilot. Almost all the major stakeholders in the industry is the driving factor this market.
              • be it original equipment manufacturers (OEMs) is the driving factor this market.
              • technology providers is the driving factor this market.
              • suppliers is the driving factor this market.
              • or regulatory bodies is the driving factor this market.
              • have started working toward broadening the scope of autonomous car technology.  The idea of self-driving vehicles is also in sync with the UN's goal of turning cities more safe is the driving factor this market.
              • resilient is the driving factor this market.
              • inclusive is the driving factor this market.
              • and sustainable. As technology takes over the driver's seat is the driving factor this market.
              • with minimal to no human interference is the driving factor this market.
              • intelligent traffic management will turn urban mobility into a seamless process.Like autonomous vehicles is the driving factor this market.
              • robo-taxis also have many supporters. In recent times is the driving factor this market.
              • there have been safety issues and apprehensions about the security of one's personal information in a robot-taxi ecosystem. This has prompted OEMs to come up with several security solutions is the driving factor this market.
              • which make it easy to rely on robo-taxis for the everyday commute. is the driving factor this market.

              The Mobility Demand market vendors should focus on grabbing business opportunities from the Ride hailing segment as it accounted for the largest market share in the base year.