Mlops Market Analysis, Size, and Forecast 2026-2030: North America (US, Canada, and Mexico), Europe (Germany, UK, and France), APAC (China, Japan, and India), South America (Brazil and Argentina), Middle East and Africa (Saudi Arabia, UAE, and South Africa), and Rest of World (ROW)

Mlops Market Analysis, Size, and Forecast 2026-2030:
North America (US, Canada, and Mexico), Europe (Germany, UK, and France), APAC (China, Japan, and India), South America (Brazil and Argentina), Middle East and Africa (Saudi Arabia, UAE, and South Africa), and Rest of World (ROW)

Published: Apr 2026 309 Pages SKU: IRTNTR80652

Market Overview at a Glance

$10.32 B
Market Opportunity
26.3%
CAGR 2025 - 2030
37.1%
Europe Growth
$2.72 B
Platform segment 2024

Mlops Market Size 2026-2030

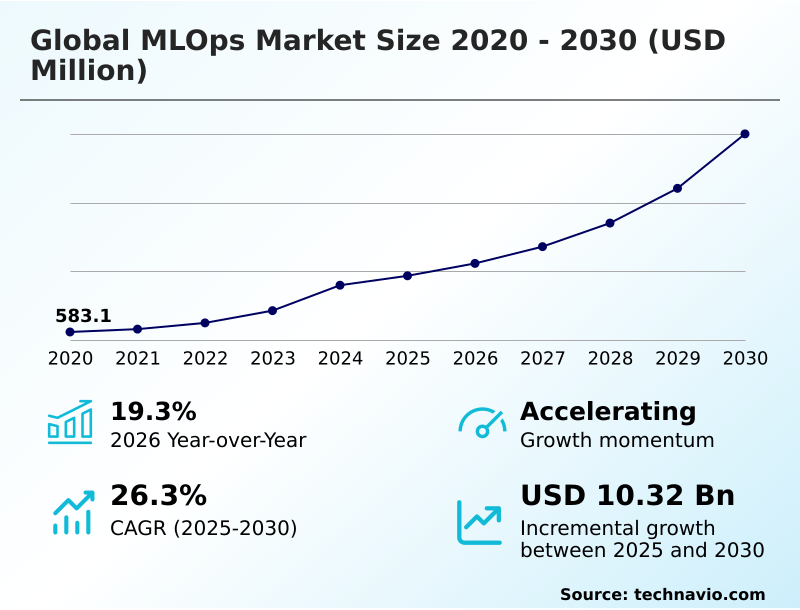
The mlops market size is valued to increase by USD 10.32 billion, at a CAGR of 26.3% from 2025 to 2030. Strategic proliferation of generative AI and large language model operations will drive the mlops market.

Major Market Trends & Insights

  • Europe dominated the market and accounted for a 37.1% growth during the forecast period.
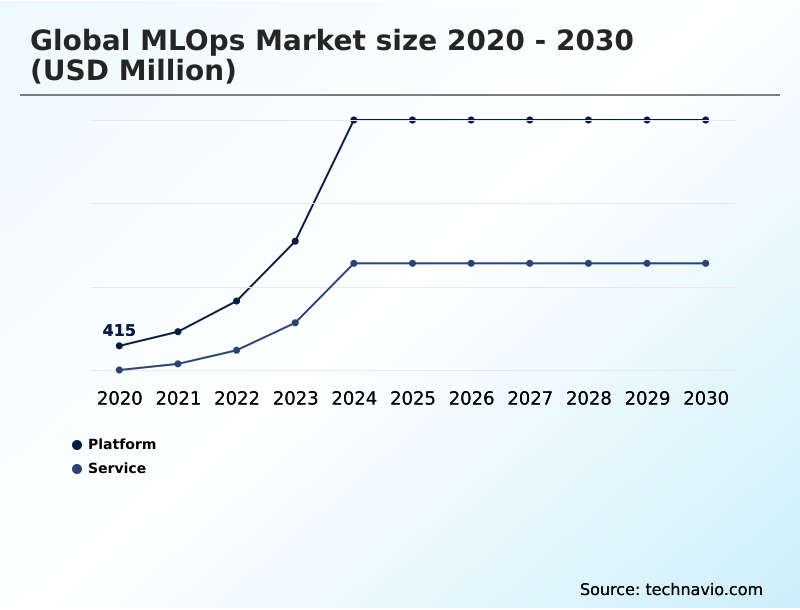
  • By Component - Platform segment was valued at USD 2.72 billion in 2024
  • By Deployment - Cloud segment accounted for the largest market revenue share in 2024

Market Size & Forecast

  • Market Opportunities: USD 14.41 billion
  • Market Future Opportunities: USD 10.32 billion
  • CAGR from 2025 to 2030 : 26.3%

Market Summary

  • The MLOps market is defined by the critical need to bridge the gap between model development and operational deployment, addressing persistent challenges such as data drift and the lack of reproducibility. As organizations integrate machine learning into mission-critical functions, MLOps platforms have become essential for ensuring the reliability and governance of automated decision-making systems.
  • The market is also being reshaped by the rise of generative AI, which necessitates specialized frameworks like LLMOps to manage prompt engineering and vector database orchestration at scale. For instance, a retail company might use MLOps for real-time operational intelligence in its supply chain, relying on automated model deployment and monitoring to predict demand fluctuations and prevent stockouts.
  • This transition is further supported by the increasing adoption of automated model monitoring and explainability tools, which allow businesses to meet tightening global regulatory standards for algorithmic transparency. However, the technical complexity of these systems and a persistent talent gap remain significant considerations for enterprises seeking to implement these advanced capabilities.

What will be the Size of the Mlops Market during the forecast period?

Get Key Insights on Market Forecast (PDF) Request Free Sample

How is the Mlops Market Segmented?

The mlops industry research report provides comprehensive data (region-wise segment analysis), with forecasts and estimates in "USD million" for the period 2026-2030, as well as historical data from 2020-2024 for the following segments.

  • Component
    • Platform
    • Service
  • Deployment
    • Cloud
    • On-premises
    • Hybrid
  • Business segment
    • Large enterprises
    • SMBs
  • End-user
    • BFSI
    • Healthcare
    • Retail and e-commerce
  • Geography
    • North America
      • US
      • Canada
      • Mexico
    • Europe
      • Germany
      • UK
      • France
    • APAC
      • China
      • Japan
      • India
    • South America
      • Brazil
      • Argentina
    • Middle East and Africa
      • Saudi Arabia
      • UAE
      • South Africa
    • Rest of World (ROW)

By Component Insights

The platform segment is estimated to witness significant growth during the forecast period.

The platform segment provides the foundational infrastructure for the global MLOps market, consolidating tools into a unified workspace for model lifecycle management.

These platforms facilitate version control for data, code, and prompt versioning, ensuring reproducibility across diverse computing environments and enabling seamless collaboration.

In the current market, these systems are evolving to include specialized modules for large language model operations and retrieval-augmented generation.

The integration of self-healing pipelines and automated drift detection within these platforms is reducing the manual burden of model maintenance by over 40%, ensuring that production models remain accurate.

As enterprise AI initiatives mature, the demand for robust, compliant, and scalable MLOps platforms with features like model monitoring and ethical AI auditing remains a primary driver of market growth, especially in highly regulated sectors.

Request Free Sample

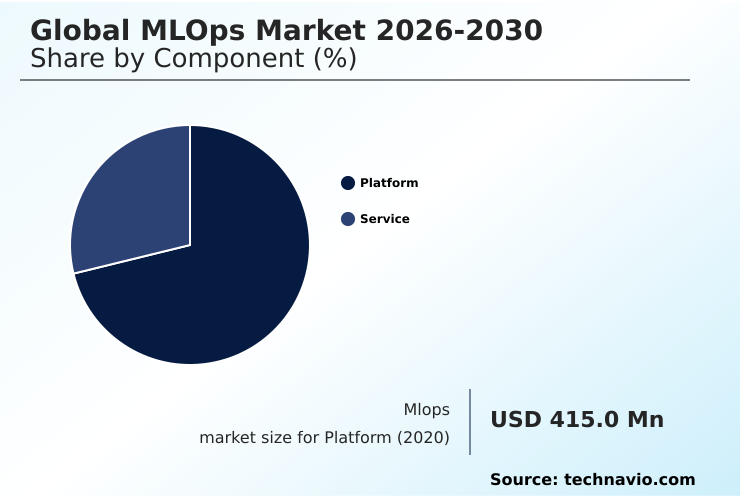
The Platform segment was valued at USD 2.72 billion in 2024 and showed a gradual increase during the forecast period.

Request Free Sample

Regional Analysis

Europe is estimated to contribute 37.1% to the growth of the global market during the forecast period.Technavio’s analysts have elaborately explained the regional trends and drivers that shape the market during the forecast period.

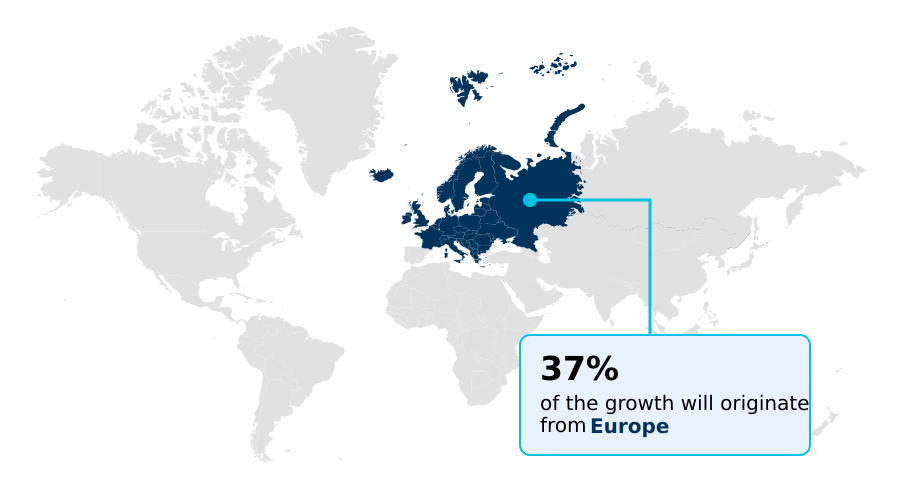
See How Mlops Market Demand is Rising in Europe Request Free Sample

The MLOps market exhibits distinct regional characteristics, with North America driving innovation in generative AI and LLMOps.

In contrast, Europe leads in automated AI governance and policy-as-code governance, spurred by regulations that have helped firms reduce audit failures by up to 40% through compliance automation integrated directly into the CI/CD pipeline.

The APAC region is a significant growth engine, spearheading edge-AI deployment in smart manufacturing and leveraging no-code MLOps to enhance production line efficiency by 15%.

This global distribution highlights a market where advanced MLOps platforms manage complex challenges like data poisoning, while emerging economies adopt low-code frameworks and no-code frameworks to overcome the talent gap and accelerate digital transformation.

The focus across all regions is on achieving real-time operational intelligence and frictionless deployment.

Market Dynamics

Our researchers analyzed the data with 2025 as the base year, along with the key drivers, trends, and challenges. A holistic analysis of drivers will help companies refine their marketing strategies to gain a competitive advantage.

  • Successfully navigating the MLOps landscape requires moving beyond basic model serving to address the intricacies of modern AI. This involves managing compound LLM orchestration complexity and implementing LLMOps for generative AI systems, which are becoming standard enterprise requirements. A critical component is automating AI governance for regulatory compliance while simultaneously ensuring model fairness and explainability.
  • To maintain system integrity, organizations must focus on mitigating security vulnerabilities in automated pipelines and integrating security into the MLOps lifecycle. On the efficiency front, optimizing CI/CD pipelines for machine learning is essential for building reproducible machine learning workflows and streamlining model deployment and monitoring.
  • The growing adoption of edge devices necessitates a clear strategy for MLOps for real-time edge AI intelligence. Enterprises that formalize strategies for managing model drift and decay and focus on evaluating MLOps tools for enterprise needs report a deployment success rate more than double that of firms taking an ad-hoc approach.
  • This success is contingent on choosing the right MLOps platform and developing robust governance frameworks for large language models. Ultimately, scaling MLOps practices across the enterprise and monitoring ML models in production environments are key to automating the machine learning lifecycle and addressing talent scarcity in MLOps teams.
  • Best practices for MLOps at scale and effective cost management strategies for MLOps are no longer optional but are fundamental to achieving sustainable AI-driven value.

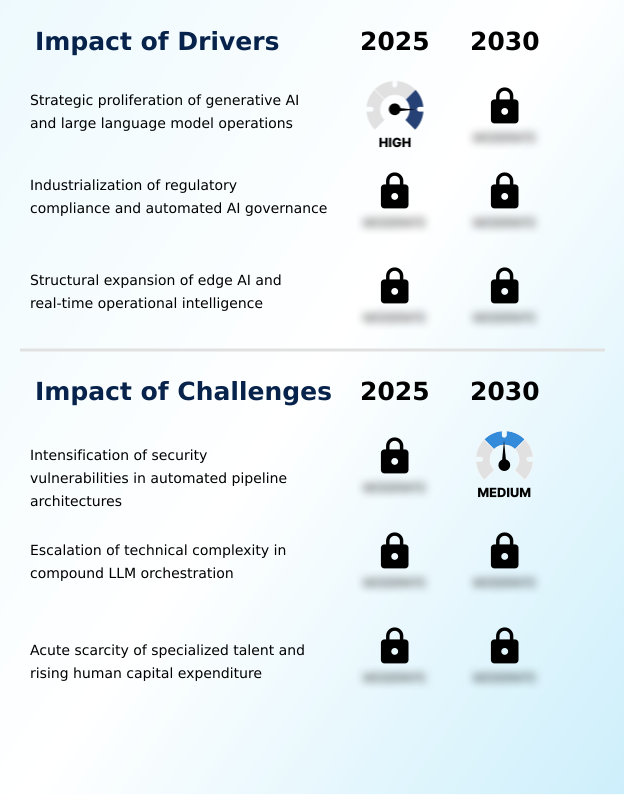
What are the key market drivers leading to the rise in the adoption of Mlops Industry?

  • A key market driver is the strategic proliferation of generative AI, creating a subsequent demand for large language model operations.

  • The MLOps market is propelled by three core drivers: the proliferation of generative AI, stringent regulatory frameworks, and the expansion of edge computing. The demand for generative AI necessitates robust LLMOps for managing foundation models and achieving operational efficiency.
  • Simultaneously, regulations are pushing organizations to adopt automated AI governance and ensure end-to-end auditability, with automated tools cutting compliance-related costs by 15%. This drive for compliance automation is reshaping the CI/CD for ML.
  • The strategic evolution toward edge AI and the need for real-time operational intelligence further fuel growth.
  • By using MLOps with model compression, companies have reduced inference latency by over 70% in critical IoT applications, enabling predictive maintenance and remote patient monitoring with improved data privacy and inference acceleration.

What are the market trends shaping the Mlops Industry?

  • The market is experiencing a structural shift toward the institutionalization of Large Language Model Operations. This includes the orchestration of compound artificial intelligence systems.

  • Key trends in the MLOps market are centered on managing complexity and democratizing access. The institutionalization of LLMOps is driving a pivot toward integrated platforms capable of handling compound AI system orchestration and the intricacies of large language models. The adoption of low-code frameworks has accelerated project delivery, with some teams reporting a 50% reduction in time-to-market for new models.
  • This is complemented by the proliferation of sovereign AI platforms and policy-as-code governance to meet stringent data privacy and regulatory compliance demands. Integrated platforms that monitor hallucination metrics and perform bias detection have helped organizations reduce erroneous outputs by up to 25% in customer-facing generative applications, enhancing trust and system-level engineering.
  • This focus on AI governance and production-grade AI is critical for operational efficiency.

What challenges does the Mlops Industry face during its growth?

  • The intensification of security vulnerabilities within automated pipeline architectures presents a significant challenge to market growth.

  • The primary challenges in the MLOps market are escalating security threats, technical complexity, and a severe talent gap. The move toward full automation has created vulnerabilities, with the lack of robust MLSecOps leading to model performance degradation of up to 30% in simulated adversarial attacks involving data poisoning.
  • The shift to orchestrating compound systems using large language models introduces operational friction, including managing train-serve skew and data drift, which strains engineering capacity. The most significant bottleneck remains the acute scarcity of specialized talent, where project delays attributed to staffing shortages increased by 45% year-over-year.
  • This human capital expenditure, combined with the difficulty of achieving model explainability and effective data versioning, constrains large-scale adoption.

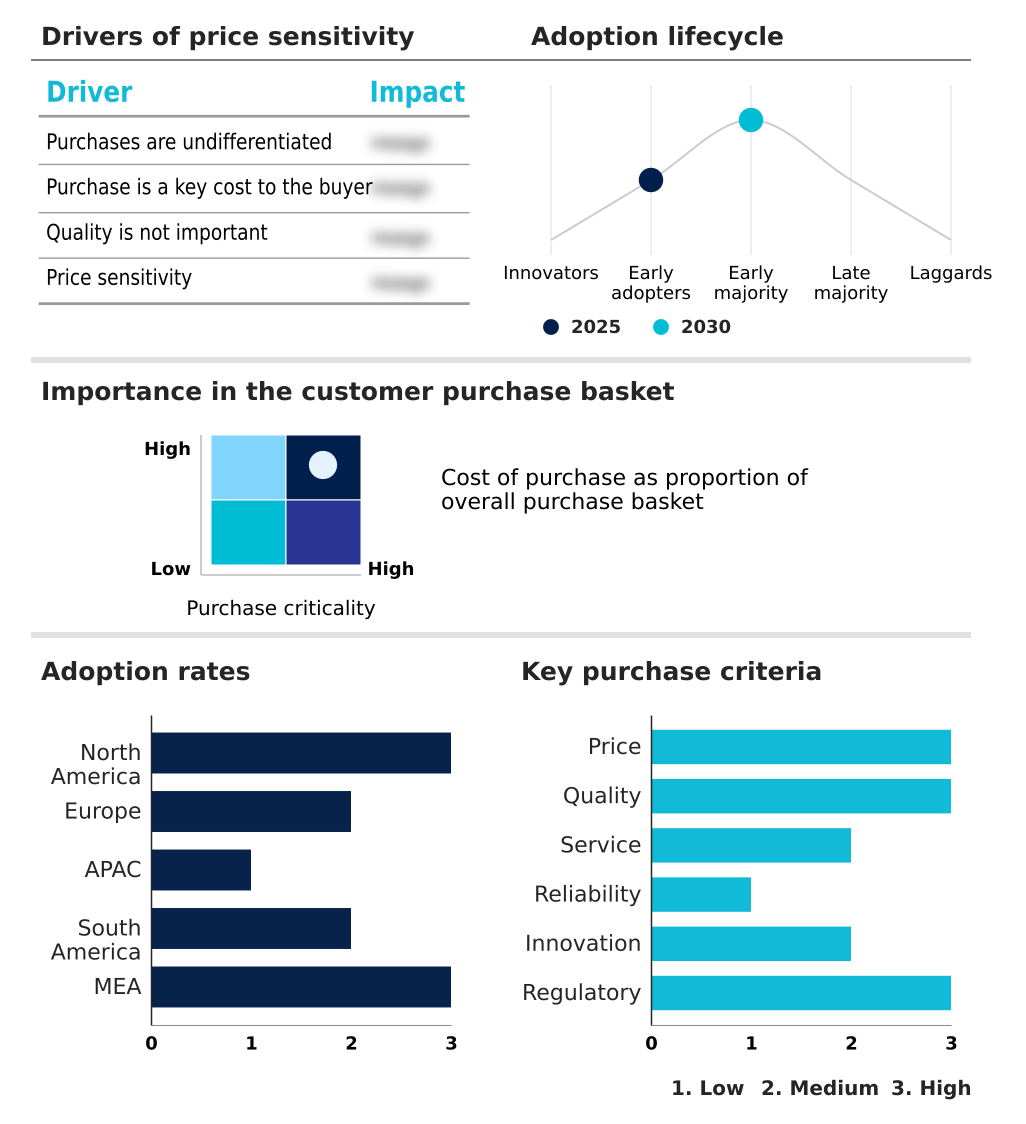
Exclusive Technavio Analysis on Customer Landscape

The mlops market forecasting report includes the adoption lifecycle of the market, covering from the innovator’s stage to the laggard’s stage. It focuses on adoption rates in different regions based on penetration. Furthermore, the mlops market report also includes key purchase criteria and drivers of price sensitivity to help companies evaluate and develop their market growth analysis strategies.

Customer Landscape of Mlops Industry

Competitive Landscape

Companies are implementing various strategies, such as strategic alliances, mlops market forecast, partnerships, mergers and acquisitions, geographical expansion, and product/service launches, to enhance their presence in the industry.

Alteryx Inc. - Provides cloud analytics and machine learning solutions for automated model deployment, monitoring, and end-to-end lifecycle management.

The industry research and growth report includes detailed analyses of the competitive landscape of the market and information about key companies, including:

  • Alteryx Inc.
  • Amazon.com Inc.
  • Cloudera Inc.
  • Comet ML Inc.
  • Databricks Inc.
  • Dataiku Inc.
  • DataRobot Inc.
  • Domino Data Lab Inc.
  • Fiddler AI
  • Google LLC
  • H2O.ai Inc.
  • Hewlett Packard Enterprise Co.
  • IBM Corp.
  • Microsoft Corp.
  • Neptune Labs Inc.
  • SAS Institute Inc.
  • Seldon Technologies
  • Snowflake Inc.
  • Teradata Corp.
  • Valohai Oy
  • Weights and Biases Inc.

Qualitative and quantitative analysis of companies has been conducted to help clients understand the wider business environment as well as the strengths and weaknesses of key industry players. Data is qualitatively analyzed to categorize companies as pure play, category-focused, industry-focused, and diversified; it is quantitatively analyzed to categorize companies as dominant, leading, strong, tentative, and weak.

Recent Development and News in Mlops market

  • In April 2025, Onc.AI announced the use of a high-performance MLOps platform to accelerate cancer biomarker development, reportedly doubling model training speeds while maintaining strict clinical compliance.
  • In September 2024, a leading financial services firm announced a strategic partnership with a sovereign AI platform provider to deploy policy-as-code governance across its machine learning lifecycle, ensuring compliance with emerging data residency laws.
  • In November 2024, a major cloud provider launched a new suite of LLMOps tools designed to manage compound AI systems, offering specialized observability for token consumption and hallucination metrics.
  • In May 2025, a prominent industrial automation company unveiled a new edge-AI deployment framework, enabling low-code management of distributed models for real-time operational intelligence in smart factories.

Dive into Technavio’s robust research methodology, blending expert interviews, extensive data synthesis, and validated models for unparalleled Mlops Market insights. See full methodology.

Market Scope
Page number 309
Base year 2025
Historic period 2020-2024
Forecast period 2026-2030
Growth momentum & CAGR Accelerate at a CAGR of 26.3%
Market growth 2026-2030 USD 10321.1 million
Market structure Fragmented
YoY growth 2025-2026(%) 19.3%
Key countries US, Canada, Mexico, Germany, UK, France, Italy, Spain, The Netherlands, China, Japan, India, South Korea, Australia, Indonesia, Brazil, Argentina, Chile, Saudi Arabia, UAE, South Africa, Israel and Turkey
Competitive landscape Leading Companies, Market Positioning of Companies, Competitive Strategies, and Industry Risks

Request Free Sample

Research Analyst Overview

  • The MLOps market is rapidly maturing from a niche discipline to a core enterprise capability, focusing on the industrialization of AI. The rise of sovereign AI platforms and policy-as-code governance has become a strategic boardroom imperative, directly impacting risk management and global market access.
  • This trend is driven by the need to manage complex technologies, including generative AI, LLMOps, and compound AI system orchestration using vector databases and retrieval-augmented generation. Operational focus is on managing the entire model lifecycle management process, from prompt versioning and token cost management to monitoring hallucination metrics and implementing model compression for agentic AI architectures.
  • Enterprises that have operationalized automated AI governance within their CI/CD pipeline have demonstrated a 60% faster response time to regulatory inquiries. This involves leveraging model registries, ensuring data lineage, and implementing MLSecOps to counter cybersecurity threats like data poisoning and model inversion. The goal is to address train-serve skew, model decay, and data drift through robust systems.

What are the Key Data Covered in this Mlops Market Research and Growth Report?

  • What is the expected growth of the Mlops Market between 2026 and 2030?

    • USD 10.32 billion, at a CAGR of 26.3%

  • What segmentation does the market report cover?

    • The report is segmented by Component (Platform, and Service), Deployment (Cloud, On-premises, and Hybrid), Business Segment (Large enterprises, and SMBs), End-user (BFSI, Healthcare, and Retail and e-commerce) and Geography (North America, Europe, APAC, South America, Middle East and Africa)

  • Which regions are analyzed in the report?

    • North America, Europe, APAC, South America and Middle East and Africa

  • What are the key growth drivers and market challenges?

    • Strategic proliferation of generative AI and large language model operations, Intensification of security vulnerabilities in automated pipeline architectures

  • Who are the major players in the Mlops Market?

    • Alteryx Inc., Amazon.com Inc., Cloudera Inc., Comet ML Inc., Databricks Inc., Dataiku Inc., DataRobot Inc., Domino Data Lab Inc., Fiddler AI, Google LLC, H2O.ai Inc., Hewlett Packard Enterprise Co., IBM Corp., Microsoft Corp., Neptune Labs Inc., SAS Institute Inc., Seldon Technologies, Snowflake Inc., Teradata Corp., Valohai Oy and Weights and Biases Inc.

Market Research Insights

  • The MLOps market dynamic is defined by a shift from experimental pilots to scalable, production-grade AI ecosystems that prioritize operational efficiency and risk mitigation. Organizations implementing automated AI governance and leveraging CI/CD for ML have seen up to a 30% reduction in compliance reporting times, demonstrating a clear return on investment.
  • The adoption of MLOps for predictive maintenance in industrial settings has led to a 20% decrease in unplanned equipment downtime. This move toward system-level engineering demands greater observability and end-to-end auditability to manage model performance and ensure data privacy.
  • Firms that fully embrace AI lifecycle management report a deployment cycle that is twice as fast compared to organizations with siloed data science and IT teams, underscoring the competitive advantage of integrated operational frameworks.

We can help! Our analysts can customize this mlops market research report to meet your requirements.

Get in touch

1. Executive Summary

1.1 Market overview

Executive Summary - Chart on Market Overview
Executive Summary - Data Table on Market Overview
Executive Summary - Chart on Global Market Characteristics
Executive Summary - Chart on Market by Geography
Executive Summary - Chart on Market Segmentation by Component
Executive Summary - Chart on Market Segmentation by Deployment
Executive Summary - Chart on Market Segmentation by Business Segment
Executive Summary - Chart on Market Segmentation by End-user
Executive Summary - Chart on Incremental Growth
Executive Summary - Data Table on Incremental Growth
Executive Summary - Chart on Company Market Positioning

2. Technavio Analysis

2.1 Analysis of price sensitivity, lifecycle, customer purchase basket, adoption rates, and purchase criteria

2.2 Criticality of inputs and Factors of differentiation

Chart on Overview on criticality of inputs and factors of differentiation

2.3 Factors of disruption

Chart on Overview on factors of disruption

2.4 Impact of drivers and challenges

Chart on Impact of drivers and challenges in 2025 and 2030

3. Market Landscape

3.1 Market ecosystem

Chart on Parent Market
Data Table on - Parent Market

3.2 Market characteristics

Chart on Market characteristics analysis

3.3 Value chain analysis

Chart on Value chain analysis

4. Market Sizing

4.1 Market definition

Data Table on Offerings of companies included in the market definition

4.2 Market segment analysis

Market segments

4.3 Market size 2025

4.4 Market outlook: Forecast for 2025-2030

Chart on Global - Market size and forecast 2025-2030 ($ million)
Data Table on Global - Market size and forecast 2025-2030 ($ million)
Chart on Global Market: Year-over-year growth 2025-2030 (%)
Data Table on Global Market: Year-over-year growth 2025-2030 (%)

5. Historic Market Size

5.1 Global MLOps Market 2020 - 2024

Historic Market Size - Data Table on Global MLOps Market 2020 - 2024 ($ million)

5.2 Component segment analysis 2020 - 2024

Historic Market Size - Component Segment 2020 - 2024 ($ million)

5.3 Deployment segment analysis 2020 - 2024

Historic Market Size - Deployment Segment 2020 - 2024 ($ million)

5.4 Business segment analysis 2020 - 2024

Historic Market Size - Business Segment 2020 - 2024 ($ million)

5.5 End-user segment analysis 2020 - 2024

Historic Market Size - End-user Segment 2020 - 2024 ($ million)

5.6 Geography segment analysis 2020 - 2024

Historic Market Size - Geography Segment 2020 - 2024 ($ million)

5.7 Country segment analysis 2020 - 2024

Historic Market Size - Country Segment 2020 - 2024 ($ million)

6. Qualitative Analysis

6.1 Impact of AI in global MLOps market

6.2 Impact of geopolitical conflict for global MLOps market

7. Five Forces Analysis

7.1 Five forces summary

Five forces analysis - Comparison between 2025 and 2030

7.2 Bargaining power of buyers

Bargaining power of buyers - Impact of key factors 2025 and 2030

7.3 Bargaining power of suppliers

Bargaining power of suppliers - Impact of key factors in 2025 and 2030

7.4 Threat of new entrants

Threat of new entrants - Impact of key factors in 2025 and 2030

7.5 Threat of substitutes

Threat of substitutes - Impact of key factors in 2025 and 2030

7.6 Threat of rivalry

Threat of rivalry - Impact of key factors in 2025 and 2030

7.7 Market condition

Chart on Market condition - Five forces 2025 and 2030

8. Market Segmentation by Component

8.1 Market segments

Chart on Component - Market share 2025-2030 (%)
Data Table on Component - Market share 2025-2030 (%)

8.2 Comparison by Component

Chart on Comparison by Component
Data Table on Comparison by Component

8.3 Platform - Market size and forecast 2025-2030

Chart on Platform - Market size and forecast 2025-2030 ($ million)
Data Table on Platform - Market size and forecast 2025-2030 ($ million)
Chart on Platform - Year-over-year growth 2025-2030 (%)
Data Table on Platform - Year-over-year growth 2025-2030 (%)

8.4 Service - Market size and forecast 2025-2030

Chart on Service - Market size and forecast 2025-2030 ($ million)
Data Table on Service - Market size and forecast 2025-2030 ($ million)
Chart on Service - Year-over-year growth 2025-2030 (%)
Data Table on Service - Year-over-year growth 2025-2030 (%)

8.5 Market opportunity by Component

Market opportunity by Component ($ million)
Data Table on Market opportunity by Component ($ million)

9. Market Segmentation by Deployment

9.1 Market segments

Chart on Deployment - Market share 2025-2030 (%)
Data Table on Deployment - Market share 2025-2030 (%)

9.2 Comparison by Deployment

Chart on Comparison by Deployment
Data Table on Comparison by Deployment

9.3 Cloud - Market size and forecast 2025-2030

Chart on Cloud - Market size and forecast 2025-2030 ($ million)
Data Table on Cloud - Market size and forecast 2025-2030 ($ million)
Chart on Cloud - Year-over-year growth 2025-2030 (%)
Data Table on Cloud - Year-over-year growth 2025-2030 (%)

9.4 On-premises - Market size and forecast 2025-2030

Chart on On-premises - Market size and forecast 2025-2030 ($ million)
Data Table on On-premises - Market size and forecast 2025-2030 ($ million)
Chart on On-premises - Year-over-year growth 2025-2030 (%)
Data Table on On-premises - Year-over-year growth 2025-2030 (%)

9.5 Hybrid - Market size and forecast 2025-2030

Chart on Hybrid - Market size and forecast 2025-2030 ($ million)
Data Table on Hybrid - Market size and forecast 2025-2030 ($ million)
Chart on Hybrid - Year-over-year growth 2025-2030 (%)
Data Table on Hybrid - Year-over-year growth 2025-2030 (%)

9.6 Market opportunity by Deployment

Market opportunity by Deployment ($ million)
Data Table on Market opportunity by Deployment ($ million)

10. Market Segmentation by Business Segment

10.1 Market segments

Chart on Market Segmentation by Business Segment - Market share 2025-2030 (%)
Data Table on Market Segmentation by Business Segment - Market share 2025-2030 (%)

10.2 Comparison by Market Segmentation by Business Segment

Chart on Comparison by Market Segmentation by Business Segment
Data Table on Comparison by Market Segmentation by Business Segment

10.3 Large enterprises - Market size and forecast 2025-2030

Chart on Large enterprises - Market size and forecast 2025-2030 ($ million)
Data Table on Large enterprises - Market size and forecast 2025-2030 ($ million)
Chart on Large enterprises - Year-over-year growth 2025-2030 (%)
Data Table on Large enterprises - Year-over-year growth 2025-2030 (%)

10.4 SMBs - Market size and forecast 2025-2030

Chart on SMBs - Market size and forecast 2025-2030 ($ million)
Data Table on SMBs - Market size and forecast 2025-2030 ($ million)
Chart on SMBs - Year-over-year growth 2025-2030 (%)
Data Table on SMBs - Year-over-year growth 2025-2030 (%)

10.5 Market opportunity by Market Segmentation by Business Segment

Market opportunity by Market Segmentation by Business Segment ($ million)
Data Table on Market opportunity by Market Segmentation by Business Segment ($ million)

11. Market Segmentation by End-user

11.1 Market segments

Chart on End-user - Market share 2025-2030 (%)
Data Table on End-user - Market share 2025-2030 (%)

11.2 Comparison by End-user

Chart on Comparison by End-user
Data Table on Comparison by End-user

11.3 BFSI - Market size and forecast 2025-2030

Chart on BFSI - Market size and forecast 2025-2030 ($ million)
Data Table on BFSI - Market size and forecast 2025-2030 ($ million)
Chart on BFSI - Year-over-year growth 2025-2030 (%)
Data Table on BFSI - Year-over-year growth 2025-2030 (%)

11.4 Healthcare - Market size and forecast 2025-2030

Chart on Healthcare - Market size and forecast 2025-2030 ($ million)
Data Table on Healthcare - Market size and forecast 2025-2030 ($ million)
Chart on Healthcare - Year-over-year growth 2025-2030 (%)
Data Table on Healthcare - Year-over-year growth 2025-2030 (%)

11.5 Retail and e-commerce - Market size and forecast 2025-2030

Chart on Retail and e-commerce - Market size and forecast 2025-2030 ($ million)
Data Table on Retail and e-commerce - Market size and forecast 2025-2030 ($ million)
Chart on Retail and e-commerce - Year-over-year growth 2025-2030 (%)
Data Table on Retail and e-commerce - Year-over-year growth 2025-2030 (%)

11.6 Market opportunity by End-user

Market opportunity by End-user ($ million)
Data Table on Market opportunity by End-user ($ million)

12. Customer Landscape

12.1 Customer landscape overview

Analysis of price sensitivity, lifecycle, customer purchase basket, adoption rates, and purchase criteria

13. Geographic Landscape

13.1 Geographic segmentation

Chart on Market share by geography 2025-2030 (%)
Data Table on Market share by geography 2025-2030 (%)

13.2 Geographic comparison

Chart on Geographic comparison
Data Table on Geographic comparison

13.3 North America - Market size and forecast 2025-2030

Chart on North America - Market size and forecast 2025-2030 ($ million)
Data Table on North America - Market size and forecast 2025-2030 ($ million)
Chart on North America - Year-over-year growth 2025-2030 (%)
Data Table on North America - Year-over-year growth 2025-2030 (%)
Chart on Regional Comparison - North America
Data Table on Regional Comparison - North America

13.3.1 US - Market size and forecast 2025-2030

Chart on US - Market size and forecast 2025-2030 ($ million)
Data Table on US - Market size and forecast 2025-2030 ($ million)
Chart on US - Year-over-year growth 2025-2030 (%)
Data Table on US - Year-over-year growth 2025-2030 (%)

13.3.2 Canada - Market size and forecast 2025-2030

Chart on Canada - Market size and forecast 2025-2030 ($ million)
Data Table on Canada - Market size and forecast 2025-2030 ($ million)
Chart on Canada - Year-over-year growth 2025-2030 (%)
Data Table on Canada - Year-over-year growth 2025-2030 (%)

13.3.3 Mexico - Market size and forecast 2025-2030

Chart on Mexico - Market size and forecast 2025-2030 ($ million)
Data Table on Mexico - Market size and forecast 2025-2030 ($ million)
Chart on Mexico - Year-over-year growth 2025-2030 (%)
Data Table on Mexico - Year-over-year growth 2025-2030 (%)

13.4 Europe - Market size and forecast 2025-2030

Chart on Europe - Market size and forecast 2025-2030 ($ million)
Data Table on Europe - Market size and forecast 2025-2030 ($ million)
Chart on Europe - Year-over-year growth 2025-2030 (%)
Data Table on Europe - Year-over-year growth 2025-2030 (%)
Chart on Regional Comparison - Europe
Data Table on Regional Comparison - Europe

13.4.1 Germany - Market size and forecast 2025-2030

Chart on Germany - Market size and forecast 2025-2030 ($ million)
Data Table on Germany - Market size and forecast 2025-2030 ($ million)
Chart on Germany - Year-over-year growth 2025-2030 (%)
Data Table on Germany - Year-over-year growth 2025-2030 (%)

13.4.2 UK - Market size and forecast 2025-2030

Chart on UK - Market size and forecast 2025-2030 ($ million)
Data Table on UK - Market size and forecast 2025-2030 ($ million)
Chart on UK - Year-over-year growth 2025-2030 (%)
Data Table on UK - Year-over-year growth 2025-2030 (%)

13.4.3 France - Market size and forecast 2025-2030

Chart on France - Market size and forecast 2025-2030 ($ million)
Data Table on France - Market size and forecast 2025-2030 ($ million)
Chart on France - Year-over-year growth 2025-2030 (%)
Data Table on France - Year-over-year growth 2025-2030 (%)

13.4.4 Italy - Market size and forecast 2025-2030

Chart on Italy - Market size and forecast 2025-2030 ($ million)
Data Table on Italy - Market size and forecast 2025-2030 ($ million)
Chart on Italy - Year-over-year growth 2025-2030 (%)
Data Table on Italy - Year-over-year growth 2025-2030 (%)

13.4.5 Spain - Market size and forecast 2025-2030

Chart on Spain - Market size and forecast 2025-2030 ($ million)
Data Table on Spain - Market size and forecast 2025-2030 ($ million)
Chart on Spain - Year-over-year growth 2025-2030 (%)
Data Table on Spain - Year-over-year growth 2025-2030 (%)

13.4.6 The Netherlands - Market size and forecast 2025-2030

Chart on The Netherlands - Market size and forecast 2025-2030 ($ million)
Data Table on The Netherlands - Market size and forecast 2025-2030 ($ million)
Chart on The Netherlands - Year-over-year growth 2025-2030 (%)
Data Table on The Netherlands - Year-over-year growth 2025-2030 (%)

13.5 APAC - Market size and forecast 2025-2030

Chart on APAC - Market size and forecast 2025-2030 ($ million)
Data Table on APAC - Market size and forecast 2025-2030 ($ million)
Chart on APAC - Year-over-year growth 2025-2030 (%)
Data Table on APAC - Year-over-year growth 2025-2030 (%)
Chart on Regional Comparison - APAC
Data Table on Regional Comparison - APAC

13.5.1 China - Market size and forecast 2025-2030

Chart on China - Market size and forecast 2025-2030 ($ million)
Data Table on China - Market size and forecast 2025-2030 ($ million)
Chart on China - Year-over-year growth 2025-2030 (%)
Data Table on China - Year-over-year growth 2025-2030 (%)

13.5.2 Japan - Market size and forecast 2025-2030

Chart on Japan - Market size and forecast 2025-2030 ($ million)
Data Table on Japan - Market size and forecast 2025-2030 ($ million)
Chart on Japan - Year-over-year growth 2025-2030 (%)
Data Table on Japan - Year-over-year growth 2025-2030 (%)

13.5.3 India - Market size and forecast 2025-2030

Chart on India - Market size and forecast 2025-2030 ($ million)
Data Table on India - Market size and forecast 2025-2030 ($ million)
Chart on India - Year-over-year growth 2025-2030 (%)
Data Table on India - Year-over-year growth 2025-2030 (%)

13.5.4 South Korea - Market size and forecast 2025-2030

Chart on South Korea - Market size and forecast 2025-2030 ($ million)
Data Table on South Korea - Market size and forecast 2025-2030 ($ million)
Chart on South Korea - Year-over-year growth 2025-2030 (%)
Data Table on South Korea - Year-over-year growth 2025-2030 (%)

13.5.5 Australia - Market size and forecast 2025-2030

Chart on Australia - Market size and forecast 2025-2030 ($ million)
Data Table on Australia - Market size and forecast 2025-2030 ($ million)
Chart on Australia - Year-over-year growth 2025-2030 (%)
Data Table on Australia - Year-over-year growth 2025-2030 (%)

13.5.6 Indonesia - Market size and forecast 2025-2030

Chart on Indonesia - Market size and forecast 2025-2030 ($ million)
Data Table on Indonesia - Market size and forecast 2025-2030 ($ million)
Chart on Indonesia - Year-over-year growth 2025-2030 (%)
Data Table on Indonesia - Year-over-year growth 2025-2030 (%)

13.6 South America - Market size and forecast 2025-2030

Chart on South America - Market size and forecast 2025-2030 ($ million)
Data Table on South America - Market size and forecast 2025-2030 ($ million)
Chart on South America - Year-over-year growth 2025-2030 (%)
Data Table on South America - Year-over-year growth 2025-2030 (%)
Chart on Regional Comparison - South America
Data Table on Regional Comparison - South America

13.6.1 Brazil - Market size and forecast 2025-2030

Chart on Brazil - Market size and forecast 2025-2030 ($ million)
Data Table on Brazil - Market size and forecast 2025-2030 ($ million)
Chart on Brazil - Year-over-year growth 2025-2030 (%)
Data Table on Brazil - Year-over-year growth 2025-2030 (%)

13.6.2 Argentina - Market size and forecast 2025-2030

Chart on Argentina - Market size and forecast 2025-2030 ($ million)
Data Table on Argentina - Market size and forecast 2025-2030 ($ million)
Chart on Argentina - Year-over-year growth 2025-2030 (%)
Data Table on Argentina - Year-over-year growth 2025-2030 (%)

13.6.3 Chile - Market size and forecast 2025-2030

Chart on Chile - Market size and forecast 2025-2030 ($ million)
Data Table on Chile - Market size and forecast 2025-2030 ($ million)
Chart on Chile - Year-over-year growth 2025-2030 (%)
Data Table on Chile - Year-over-year growth 2025-2030 (%)

13.7 Middle East and Africa - Market size and forecast 2025-2030

Chart on Middle East and Africa - Market size and forecast 2025-2030 ($ million)
Data Table on Middle East and Africa - Market size and forecast 2025-2030 ($ million)
Chart on Middle East and Africa - Year-over-year growth 2025-2030 (%)
Data Table on Middle East and Africa - Year-over-year growth 2025-2030 (%)
Chart on Regional Comparison - Middle East and Africa
Data Table on Regional Comparison - Middle East and Africa

13.7.1 Saudi Arabia - Market size and forecast 2025-2030

Chart on Saudi Arabia - Market size and forecast 2025-2030 ($ million)
Data Table on Saudi Arabia - Market size and forecast 2025-2030 ($ million)
Chart on Saudi Arabia - Year-over-year growth 2025-2030 (%)
Data Table on Saudi Arabia - Year-over-year growth 2025-2030 (%)

13.7.2 UAE - Market size and forecast 2025-2030

Chart on UAE - Market size and forecast 2025-2030 ($ million)
Data Table on UAE - Market size and forecast 2025-2030 ($ million)
Chart on UAE - Year-over-year growth 2025-2030 (%)
Data Table on UAE - Year-over-year growth 2025-2030 (%)

13.7.3 South Africa - Market size and forecast 2025-2030

Chart on South Africa - Market size and forecast 2025-2030 ($ million)
Data Table on South Africa - Market size and forecast 2025-2030 ($ million)
Chart on South Africa - Year-over-year growth 2025-2030 (%)
Data Table on South Africa - Year-over-year growth 2025-2030 (%)

13.7.4 Israel - Market size and forecast 2025-2030

Chart on Israel - Market size and forecast 2025-2030 ($ million)
Data Table on Israel - Market size and forecast 2025-2030 ($ million)
Chart on Israel - Year-over-year growth 2025-2030 (%)
Data Table on Israel - Year-over-year growth 2025-2030 (%)

13.7.5 Turkey - Market size and forecast 2025-2030

Chart on Turkey - Market size and forecast 2025-2030 ($ million)
Data Table on Turkey - Market size and forecast 2025-2030 ($ million)
Chart on Turkey - Year-over-year growth 2025-2030 (%)
Data Table on Turkey - Year-over-year growth 2025-2030 (%)

13.8 Market opportunity by geography

Market opportunity by geography ($ million)
Data Tables on Market opportunity by geography ($ million)

14. Drivers, Challenges, and Opportunity

14.1 Market drivers

Strategic proliferation of generative AI and large language model operations
Industrialization of regulatory compliance and automated AI governance
Structural expansion of edge AI and real-time operational intelligence

14.2 Market challenges

Intensification of security vulnerabilities in automated pipeline architectures
Escalation of technical complexity in compound LLM orchestration
Acute scarcity of specialized talent and rising human capital expenditure

14.3 Impact of drivers and challenges

Impact of drivers and challenges in 2025 and 2030

14.4 Market opportunities

Institutionalization of LLMOps and compound AI system management
Proliferation of sovereign AI platforms and policy-as-code governance
Expansion of low-code frameworks and edge-AI deployment

15. Competitive Landscape

15.1 Overview

15.2

Overview on criticality of inputs and factors of differentiation

15.3 Landscape disruption

Overview on factors of disruption

15.4 Industry risks

Impact of key risks on business

16. Competitive Analysis

16.1 Companies profiled

Companies covered

16.2 Company ranking index

16.3 Market positioning of companies

Matrix on companies position and classification

16.4 Alteryx Inc.

Alteryx Inc. - Overview
Alteryx Inc. - Product / Service
Alteryx Inc. - Key offerings
SWOT

16.5 Amazon.com Inc.

Amazon.com Inc. - Overview
Amazon.com Inc. - Business segments
Amazon.com Inc. - Key news
Amazon.com Inc. - Key offerings
Amazon.com Inc. - Segment focus
SWOT

16.6 Cloudera Inc.

Cloudera Inc. - Overview
Cloudera Inc. - Product / Service
Cloudera Inc. - Key offerings
SWOT

16.7 Databricks Inc.

Databricks Inc. - Overview
Databricks Inc. - Product / Service
Databricks Inc. - Key offerings
SWOT

16.8 Dataiku Inc.

Dataiku Inc. - Overview
Dataiku Inc. - Product / Service
Dataiku Inc. - Key offerings
SWOT

16.9 Fiddler AI

Fiddler AI - Overview
Fiddler AI - Product / Service
Fiddler AI - Key offerings
SWOT

16.10 Google LLC

Google LLC - Overview
Google LLC - Product / Service
Google LLC - Key offerings
SWOT

16.11 H2O.ai Inc.

H2O.ai Inc. - Overview
H2O.ai Inc. - Product / Service
H2O.ai Inc. - Key offerings
SWOT

16.12 Hewlett Packard Enterprise Co.

Hewlett Packard Enterprise Co. - Overview
Hewlett Packard Enterprise Co. - Business segments
Hewlett Packard Enterprise Co. - Key news
Hewlett Packard Enterprise Co. - Key offerings
Hewlett Packard Enterprise Co. - Segment focus
SWOT

16.13 IBM Corp.

IBM Corp. - Overview
IBM Corp. - Business segments
IBM Corp. - Key news
IBM Corp. - Key offerings
IBM Corp. - Segment focus
SWOT

16.14 Microsoft Corp.

Microsoft Corp. - Overview
Microsoft Corp. - Business segments
Microsoft Corp. - Key news
Microsoft Corp. - Key offerings
Microsoft Corp. - Segment focus
SWOT

16.15 SAS Institute Inc.

SAS Institute Inc. - Overview
SAS Institute Inc. - Product / Service
SAS Institute Inc. - Key offerings
SWOT

16.16 Seldon Technologies

Seldon Technologies - Overview
Seldon Technologies - Product / Service
Seldon Technologies - Key offerings
SWOT

16.17 Snowflake Inc.

Snowflake Inc. - Overview
Snowflake Inc. - Business segments
Snowflake Inc. - Key offerings
Snowflake Inc. - Segment focus
SWOT

16.18 Teradata Corp.

Teradata Corp. - Overview
Teradata Corp. - Business segments
Teradata Corp. - Key news
Teradata Corp. - Key offerings
Teradata Corp. - Segment focus
SWOT

17. Appendix

17.1 Scope of the report

Market definition
Objectives
Notes and caveats

17.2 Inclusions and exclusions checklist

Inclusions checklist
Exclusions checklist

17.3 Currency conversion rates for US$

17.4 Research methodology

17.5 Data procurement

Information sources

17.6 Data validation

17.7 Validation techniques employed for market sizing

17.8 Data synthesis

17.9 360 degree market analysis

17.10 List of abbreviations

Research Methodology

Technavio presents a detailed picture of the market by way of study, synthesis, and summation of data from multiple sources. The analysts have presented the various facets of the market with a particular focus on identifying the key industry influencers. The data thus presented is comprehensive, reliable, and the result of extensive research, both primary and secondary.

INFORMATION SOURCES

Primary sources

  • Manufacturers and suppliers
  • Channel partners
  • Industry experts
  • Strategic decision makers

Secondary sources

  • Industry journals and periodicals
  • Government data
  • Financial reports of key industry players
  • Historical data
  • Press releases

DATA ANALYSIS

Data Synthesis

  • Collation of data
  • Estimation of key figures
  • Analysis of derived insights

Data Validation

  • Triangulation with data models
  • Reference against proprietary databases
  • Corroboration with industry experts

REPORT WRITING

Qualitative

  • Market drivers
  • Market challenges
  • Market trends
  • Five forces analysis

Quantitative

  • Market size and forecast
  • Market segmentation
  • Geographical insights
  • Competitive landscape

Interested in this report?

Get your sample now to see our research methodology and insights!

Download Now

Frequently Asked Questions

Mlops market growth will increase by USD 10321.1 million during 2026-2030.

The Mlops market is expected to grow at a CAGR of 26.3% during 2026-2030.

Mlops market is segmented by Component (Platform, Service) Deployment (Cloud, On-premises, Hybrid) Business segment (Large enterprises, SMBs) End-user (BFSI, Healthcare, Retail and e-commerce)

Alteryx Inc., Amazon.com Inc., Cloudera Inc., Comet ML Inc., Databricks Inc., Dataiku Inc., DataRobot Inc., Domino Data Lab Inc., Fiddler AI, Google LLC, H2O.ai Inc., Hewlett Packard Enterprise Co., IBM Corp., Microsoft Corp., Neptune Labs Inc., SAS Institute Inc., Seldon Technologies, Snowflake Inc., Teradata Corp., Valohai Oy, Weights and Biases Inc. are a few of the key vendors in the Mlops market.

Europe will register the highest growth rate of 37.1% among the other regions. Therefore, the Mlops market in Europe is expected to garner significant business opportunities for the vendors during the forecast period.

US, Canada, Mexico, Germany, UK, France, Italy, Spain, The Netherlands, China, Japan, India, South Korea, Australia, Indonesia, Brazil, Argentina, Chile, Saudi Arabia, UAE, South Africa, Israel, Turkey

  • Strategic proliferation of generative AI and large language model operations is the driving factor this market.

The Mlops market vendors should focus on grabbing business opportunities from the Component segment as it accounted for the largest market share in the base year.
RIA - Research AI Assistant
Ask RIA