Medication Adherence Monitoring Systems Market Analysis, Size, and Forecast 2026-2030: North America (US, Canada, and Mexico), Europe (Germany, UK, and France), APAC (China, Japan, and India), Middle East and Africa (UAE, South Africa, and Saudi Arabia), South America (Brazil), Asia, Rest of World (ROW)

Medication Adherence Monitoring Systems Market Analysis, Size, and Forecast 2026-2030:
North America (US, Canada, and Mexico), Europe (Germany, UK, and France), APAC (China, Japan, and India), Middle East and Africa (UAE, South Africa, and Saudi Arabia), South America (Brazil), Asia, Rest of World (ROW)

Published: Mar 2026 306 Pages SKU: IRTNTR81300

Market Overview at a Glance

$1.46 B
Market Opportunity
14.9%
CAGR 2025 - 2030
39.5%
North America Growth
$819.5 Mn
Software centric segment 2024

Medication Adherence Monitoring Systems Market Size 2026-2030

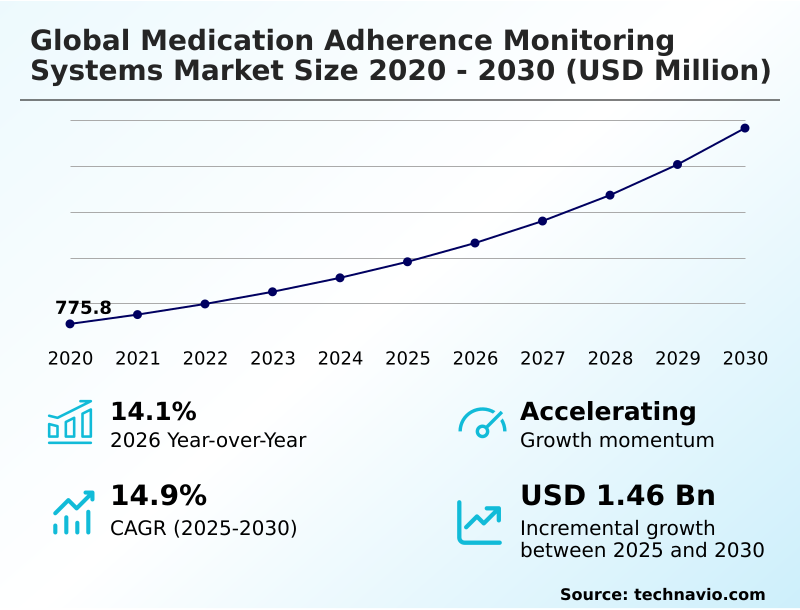
The medication adherence monitoring systems market size is valued to increase by USD 1.46 billion, at a CAGR of 14.9% from 2025 to 2030. Rising prevalence of chronic diseases and growing geriatric population will drive the medication adherence monitoring systems market.

Major Market Trends & Insights

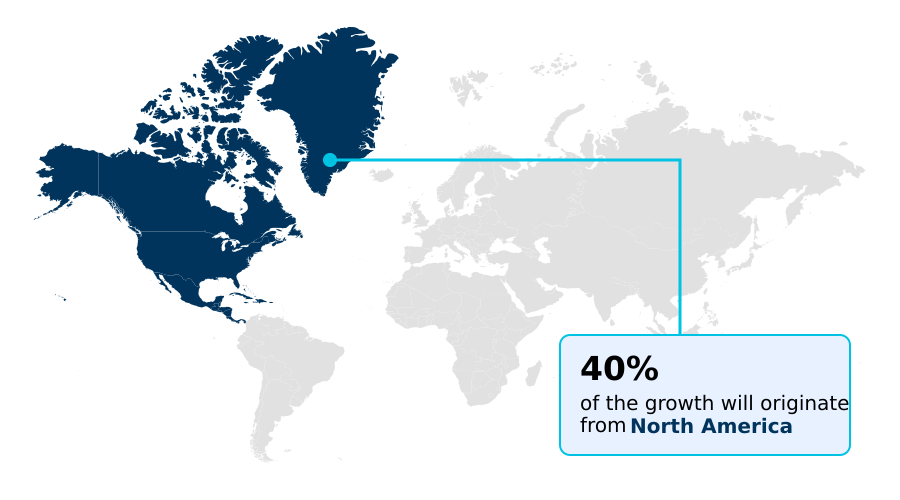
  • North America dominated the market and accounted for a 39.5% growth during the forecast period.
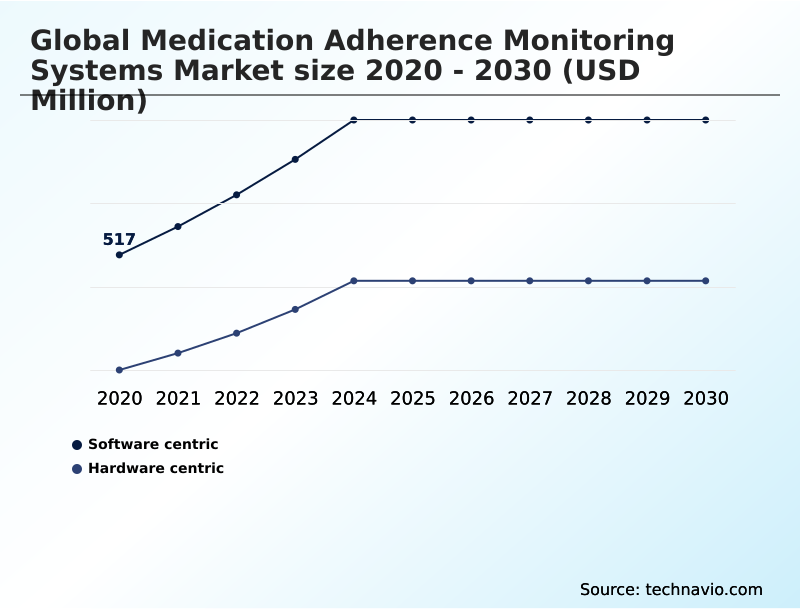
  • By Type - Software centric segment was valued at USD 819.5 million in 2024
  • By Application - Cardiovascular segment accounted for the largest market revenue share in 2024

Market Size & Forecast

  • Market Opportunities: USD 2.14 billion
  • Market Future Opportunities: USD 1.46 billion
  • CAGR from 2025 to 2030 : 14.9%

Market Summary

  • The medication adherence monitoring systems market is undergoing a significant transformation, driven by the shift toward value-based care and the need to manage chronic diseases more effectively. These systems, which range from a smart pill dispenser to advanced ingestible sensor technology, provide objective data on pharmacological regimen compliance, which is crucial for preventing adverse health events.
  • A key trend is the integration of predictive behavioral analytics, which allows healthcare providers to identify at-risk patients and intervene proactively. For instance, a health system can use a remote therapeutic monitoring platform to track discharged cardiac patients, using data from a bluetooth-enabled pill bottle to flag non-adherence and trigger a telehealth consultation, thereby reducing readmission rates.
  • However, the market faces challenges related to the high cost of implementation, data privacy concerns, and the need for seamless electronic health record integration to ensure the data is actionable within existing clinical workflows.

What will be the Size of the Medication Adherence Monitoring Systems Market during the forecast period?

Get Key Insights on Market Forecast (PDF) Request Free Sample

How is the Medication Adherence Monitoring Systems Market Segmented?

The medication adherence monitoring systems industry research report provides comprehensive data (region-wise segment analysis), with forecasts and estimates in "USD million" for the period 2026-2030, as well as historical data from 2020-2024 for the following segments.

  • Type
    • Software centric
    • Hardware centric
  • Application
    • Cardiovascular
    • Diabetes
    • Oncology
    • Central nervous system
    • Others
  • End-user
    • Hospitals and health systems
    • Home care settings
    • Retail pharmacies
    • Others
  • Geography
    • North America
      • US
      • Canada
      • Mexico
    • Europe
      • Germany
      • UK
      • France
    • Asia
    • Rest of World (ROW)

By Type Insights

The software centric segment is estimated to witness significant growth during the forecast period.

The software-centric segment is defined by a move toward digitalization in patient care, focusing on the use of a digital companion platform and mobile health application to connect providers and patients.

The goal of such a patient engagement platform is to provide a seamless environment for tracking and automated notifications. Core to this segment is the aggregation of patient-generated health data to identify non-adherence, enabling personalized intervention strategies.

These platforms integrate medication therapy management software and medication reconciliation software, enhancing evidence-based care delivery.

By prioritizing a user-centric interface design and digital health accessibility, these systems function as vital patient self-management tools, facilitating proactive patient engagement and improving data logging accuracy by over 15% compared to manual methods.

Request Free Sample

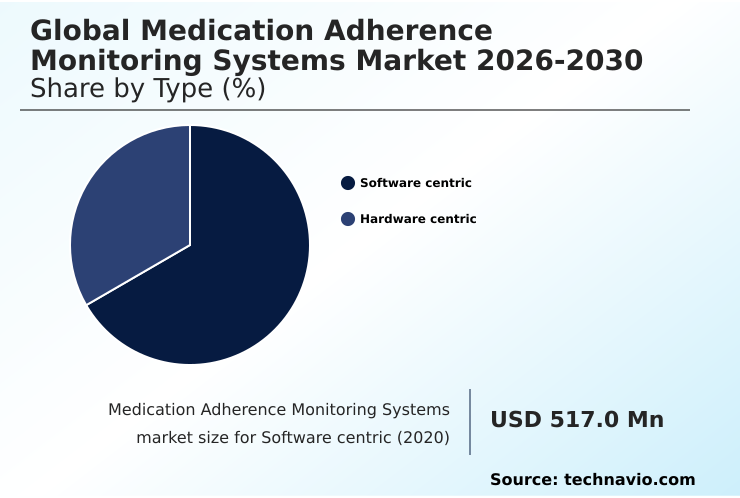
The Software centric segment was valued at USD 819.5 million in 2024 and showed a gradual increase during the forecast period.

Request Free Sample

Regional Analysis

North America is estimated to contribute 39.5% to the growth of the global market during the forecast period.Technavio’s analysts have elaborately explained the regional trends and drivers that shape the market during the forecast period.

See How Medication Adherence Monitoring Systems Market Demand is Rising in North America Request Free Sample

The global landscape is led by North America, which accounts for approximately 39.5% of the market's incremental growth, driven by advanced healthcare infrastructure and strong reimbursement frameworks for automated dispensing systems.

In this region, the focus is on sophisticated smart pill dispenser technology and medication synchronization programs to address complex care needs.

Concurrently, the market in Asia is expanding rapidly, with a focus on scalable and cost-effective solutions like smart medication packaging and electronic blister packs to manage large patient populations.

Deployments of automated home dispensing units in rural Asian communities have improved data collection efficiency by over 20%. Across all regions, systems are evolving to address medication non-compliance patterns and provide drug-to-drug interaction alerts.

This focus on non-adherence risk profiling is essential for improving outcomes and enabling real-time adherence data collection through biometric sensor technology and effective patient support programs.

Market Dynamics

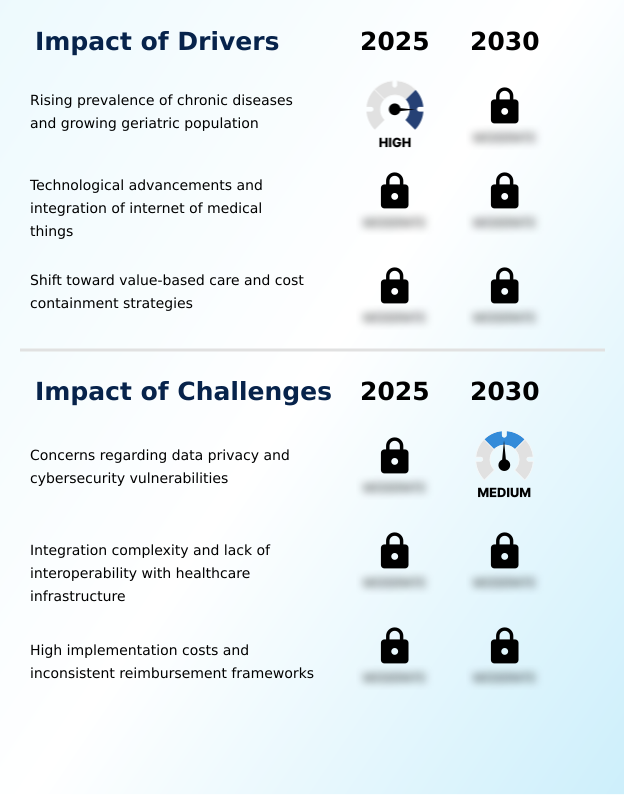
Our researchers analyzed the data with 2025 as the base year, along with the key drivers, trends, and challenges. A holistic analysis of drivers will help companies refine their marketing strategies to gain a competitive advantage.

  • The evolution of the global medication adherence monitoring systems market 2026-2030 is increasingly shaped by specific, high-value applications. The drive for improving adherence in decentralized clinical trials is paramount, as it ensures data integrity and accelerates drug development timelines.
  • Concurrently, the cost-effectiveness of remote therapeutic monitoring is being scrutinized by payers, who demand clear evidence of reduced hospitalizations and better outcomes. A significant focus is on managing polypharmacy in elderly populations, where automated systems can mitigate risks associated with complex regimens.
  • A key technical hurdle is integrating adherence data with EHR systems, with successful integrations showing a twofold increase in the speed of clinical interventions compared to siloed platforms. This effort is complicated by challenges in interoperability for adherence platforms and persistent concerns over data privacy and security in medication tracking.
  • The role of mobile apps in chronic disease management continues to expand, often featuring gamification to enhance patient engagement. Discussions around software-centric vs hardware-centric adherence systems are ongoing, with hybrid models gaining traction. The market is also addressing adherence monitoring for high-cost specialty drugs, particularly in oncology oral therapies, where compliance is critical.
  • The use of biometric sensors for verifying medication intake and visual confirmation technologies in psychiatric care are becoming industry standards. As the value-based care impact on adherence technology intensifies, new reimbursement models for digital adherence solutions are essential for sustainable growth.
  • Innovations like smart inhaler data for respiratory disease management and medication synchronization benefits for pharmacies are creating new efficiencies, while the ethical considerations of ingestible sensor use remain a critical topic of debate. The application of AI in predictive adherence analytics represents the next frontier, promising to shift the paradigm from reactive to proactive care.

What are the key market drivers leading to the rise in the adoption of Medication Adherence Monitoring Systems Industry?

  • The rising prevalence of chronic diseases, coupled with a growing geriatric population, serves as a key driver for the medication adherence monitoring systems market growth.

  • Key market drivers are centered on improving outcomes and achieving cost efficiencies within modern healthcare frameworks.
  • The adoption of value-based care models is a primary catalyst, as they incentivize providers to use remote therapeutic monitoring to ensure pharmacological regimen compliance and achieve avoidable cost reduction.
  • Deploying these systems can decrease hospital readmission rates by over 18% for certain chronic conditions.
  • The expansion of chronic disease management tools and polypharmacy management tools addresses the needs of an aging population, with a connected medication dispenser offering critical long-term therapy support.
  • The trend toward digital therapeutic expansion is also significant, with new digital health reimbursement codes accelerating the uptake of devices like the smart pill cap.
  • These home-based care solutions are becoming standard, improving quality of life and facilitating high-risk patient identification for targeted support.

What are the market trends shaping the Medication Adherence Monitoring Systems Industry?

  • The proliferation of artificial intelligence and predictive behavioral analytics is a significant upcoming trend. These technologies are poised to transform medication adherence monitoring by enabling proactive and personalized patient interventions.

  • Market trends are shifting toward proactive and precise interventions, driven by innovations in ingestible sensor technology and ingestible event marker systems that offer objective proof of ingestion. This capability significantly improves biometric data accuracy, with some clinical studies reporting a 99% success rate in verifying consumption.
  • The use of predictive behavioral analytics is also growing, allowing platforms to generate an adherence probability score that helps clinicians prioritize interventions. In clinical research, decentralized clinical trial technology combined with vision-based adherence confirmation is revolutionizing data collection. This approach enhances clinical trial data integrity by providing visual confirmation of ingestion, reducing study-related deviations by up to 25%.
  • Furthermore, smart inhaler technology provides seamless data transmission for respiratory care, optimizing therapeutic efficacy by correlating usage patterns with patient outcomes.

What challenges does the Medication Adherence Monitoring Systems Industry face during its growth?

  • Significant challenges affecting industry growth include persistent concerns over data privacy and the increasing threat of cybersecurity vulnerabilities associated with connected health devices.

  • A primary market challenge is achieving seamless electronic health record integration, as the lack of health data interoperability standards creates data silos and hinders clinical utility. Systems unable to integrate with existing hospital platforms see adoption rates up to 50% lower than fully integrated solutions.
  • This fragmentation complicates the use of a remote patient monitoring platform and a cloud-based adherence analytics dashboard. Another significant hurdle involves cybersecurity for medical devices, particularly for a bluetooth-enabled pill bottle or any device with a wireless connectivity module. A single security breach can compromise patient trust and lead to regulatory action.
  • Ensuring robust biometric security verification without complicating the user experience is a delicate balance. These issues can delay medication non-adherence intervention and limit the potential for data-driven treatment adjustments and effective pharmacist-led intervention, impacting caregiver monitoring features and overall system reliability.

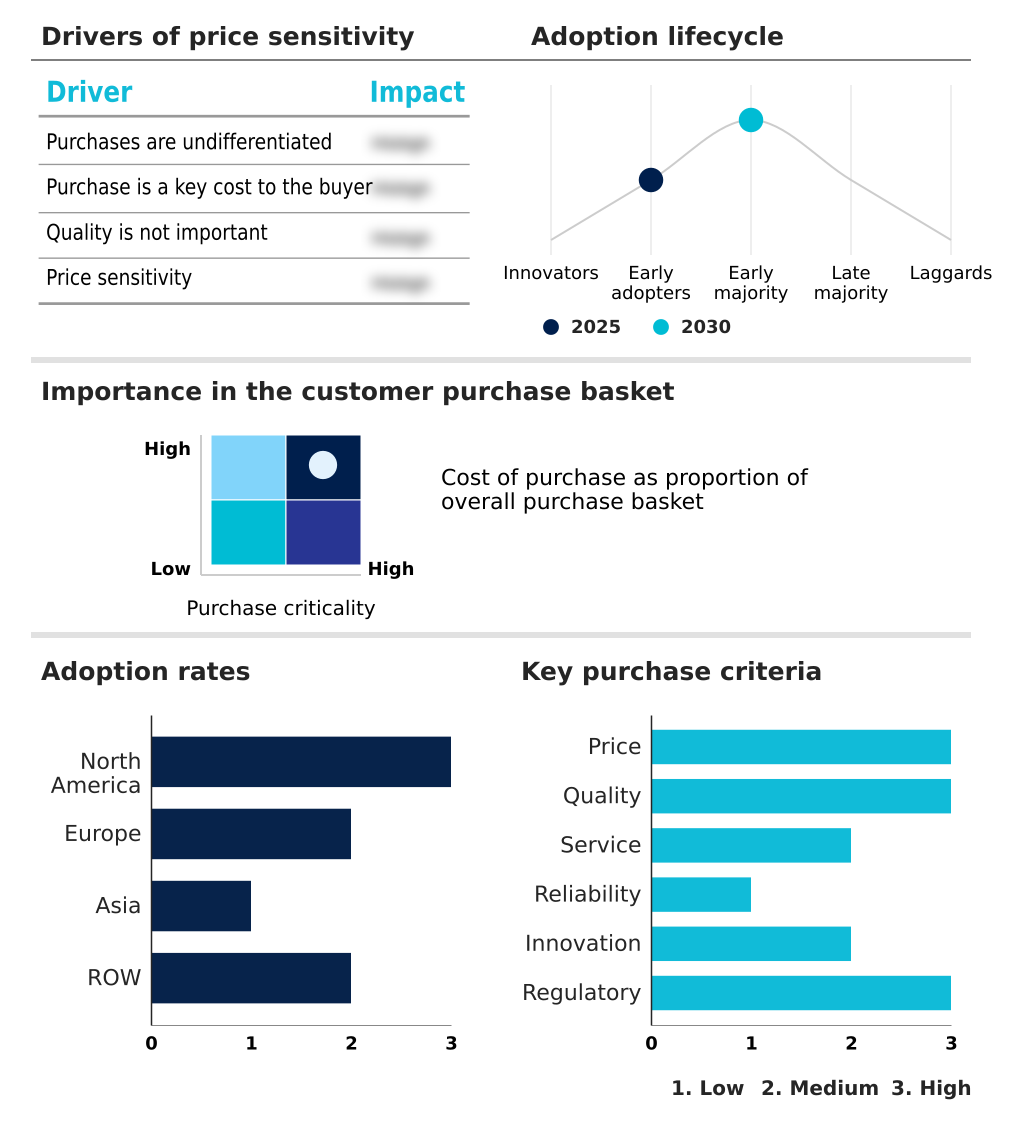
Exclusive Technavio Analysis on Customer Landscape

The medication adherence monitoring systems market forecasting report includes the adoption lifecycle of the market, covering from the innovator’s stage to the laggard’s stage. It focuses on adoption rates in different regions based on penetration. Furthermore, the medication adherence monitoring systems market report also includes key purchase criteria and drivers of price sensitivity to help companies evaluate and develop their market growth analysis strategies.

Customer Landscape of Medication Adherence Monitoring Systems Industry

Competitive Landscape

Companies are implementing various strategies, such as strategic alliances, medication adherence monitoring systems market forecast, partnerships, mergers and acquisitions, geographical expansion, and product/service launches, to enhance their presence in the industry.

AARDEX Group S.A. - Delivers comprehensive platforms featuring predictive analytics and pharmacist-led interventions to improve medication adherence and reduce healthcare costs for high-risk populations.

The industry research and growth report includes detailed analyses of the competitive landscape of the market and information about key companies, including:

  • AARDEX Group S.A.
  • AbbVie Inc.
  • AdhereHealth LLC
  • AiCure
  • Cardinal Health Inc.
  • DrFirst Inc
  • EveryDose Inc.
  • Hero Health Inc.
  • Information Mediary Corp.
  • Johnson and Johnson Services
  • Koninklijke Philips N.V.
  • McKesson Corp.
  • Medisafe
  • Medminder Systems Inc.
  • Medtronic Plc
  • Omnicell Inc.
  • Otsuka Holdings Co. Ltd.
  • PillPack LLC
  • ResMed Inc.
  • Vaica Medical Ltd

Qualitative and quantitative analysis of companies has been conducted to help clients understand the wider business environment as well as the strengths and weaknesses of key industry players. Data is qualitatively analyzed to categorize companies as pure play, category-focused, industry-focused, and diversified; it is quantitatively analyzed to categorize companies as dominant, leading, strong, tentative, and weak.

Recent Development and News in Medication adherence monitoring systems market

  • In January 2025, Medisafe introduced an advanced digital companion platform that utilizes a proprietary AI engine to generate an adherence probability score, enabling proactive interventions by healthcare teams.
  • In April 2025, the European Data Protection Board issued new guidelines for mobile health applications, mandating robust encryption and transparent data-handling protocols to protect sensitive health data.
  • In May 2025, AiCure expanded a strategic partnership to deploy its vision-based medication adherence technology across a multi-continent Phase III clinical study, aiming to ensure precise dosage compliance.
  • In August 2025, Hero Health launched an updated smart automated dispenser featuring advanced biometric security and localized cellular connectivity, ensuring medication is accessible only to the authorized patient.

Dive into Technavio’s robust research methodology, blending expert interviews, extensive data synthesis, and validated models for unparalleled Medication Adherence Monitoring Systems Market insights. See full methodology.

Market Scope
Page number 306
Base year 2025
Historic period 2020-2024
Forecast period 2026-2030
Growth momentum & CAGR Accelerate at a CAGR of 14.9%
Market growth 2026-2030 USD 1458.5 million
Market structure Fragmented
YoY growth 2025-2026(%) 14.1%
Key countries US, Canada, Mexico, Germany, UK, France, Italy, The Netherlands, Spain, Russia, China, Japan, India, South Korea, Indonesia, Thailand, Singapore, Australia, UAE, Brazil, South Africa, Saudi Arabia and Turkey
Competitive landscape Leading Companies, Market Positioning of Companies, Competitive Strategies, and Industry Risks

Request Free Sample

Research Analyst Overview

  • The medication adherence monitoring systems market is advancing beyond simple reminders, now functioning as a critical component of data-driven healthcare. This evolution is centered on sophisticated hardware like the connected medication dispenser and smart pill cap, which work in tandem with a patient engagement platform.
  • The integration of a wireless connectivity module in devices like a bluetooth-enabled pill bottle enables a continuous flow of patient-generated health data to a remote patient monitoring platform. This data is vital for medication therapy management software and medication reconciliation software, with systems demonstrating a 40% reduction in reconciliation errors upon hospital discharge.
  • For boardroom decisions, the adoption of a medication event monitoring system directly impacts financial planning, as it supports value-based care models by providing verifiable proof of pharmacological regimen compliance. The trend toward digital therapeutic expansion underscores a strategic shift where manufacturers are embedding monitoring capabilities directly into treatment protocols to secure favorable digital health reimbursement.

What are the Key Data Covered in this Medication Adherence Monitoring Systems Market Research and Growth Report?

  • What is the expected growth of the Medication Adherence Monitoring Systems Market between 2026 and 2030?

    • USD 1.46 billion, at a CAGR of 14.9%

  • What segmentation does the market report cover?

    • The report is segmented by Type (Software centric, and Hardware centric), Application (Cardiovascular, Diabetes, Oncology, Central nervous system, and Others), End-user (Hospitals and health systems, Home care settings, Retail pharmacies, and Others) and Geography (North America, Europe, Asia, Rest of World (ROW))

  • Which regions are analyzed in the report?

    • North America, Europe, Asia and Rest of World (ROW)

  • What are the key growth drivers and market challenges?

    • Rising prevalence of chronic diseases and growing geriatric population, Concerns regarding data privacy and cybersecurity vulnerabilities

  • Who are the major players in the Medication Adherence Monitoring Systems Market?

    • AARDEX Group S.A., AbbVie Inc., AdhereHealth LLC, AiCure, Cardinal Health Inc., DrFirst Inc, EveryDose Inc., Hero Health Inc., Information Mediary Corp., Johnson and Johnson Services, Koninklijke Philips N.V., McKesson Corp., Medisafe, Medminder Systems Inc., Medtronic Plc, Omnicell Inc., Otsuka Holdings Co. Ltd., PillPack LLC, ResMed Inc. and Vaica Medical Ltd

Market Research Insights

  • The market's dynamism is driven by a clear link between technology adoption and improved outcomes. Systems that provide real-time adherence data achieve up to 30% better patient compliance compared to self-reporting methods. The use of automated dispensing systems is rising, particularly as they contribute to a 20% reduction in medication errors in home-care settings.
  • Personalized intervention strategies, guided by insights from chronic disease management tools, are a focal point for value-based care. The effectiveness of these systems hinges on proactive patient engagement and pharmacist-led intervention, with platforms showing high user adoption demonstrating a twofold increase in long-term therapy support.
  • Clinical workflow automation is a key benefit, streamlining processes and allowing providers to focus on high-risk patient identification and data-driven treatment adjustments.

We can help! Our analysts can customize this medication adherence monitoring systems market research report to meet your requirements.

Get in touch

1. Executive Summary

1.1 Market overview

Executive Summary - Chart on Market Overview
Executive Summary - Data Table on Market Overview
Executive Summary - Chart on Global Market Characteristics
Executive Summary - Chart on Market by Geography
Executive Summary - Chart on Market Segmentation by Type
Executive Summary - Chart on Market Segmentation by Application
Executive Summary - Chart on Market Segmentation by End-user
Executive Summary - Chart on Incremental Growth
Executive Summary - Data Table on Incremental Growth
Executive Summary - Chart on Company Market Positioning

2. Technavio Analysis

2.1 Analysis of price sensitivity, lifecycle, customer purchase basket, adoption rates, and purchase criteria

2.2 Criticality of inputs and Factors of differentiation

Chart on Overview on criticality of inputs and factors of differentiation

2.3 Factors of disruption

Chart on Overview on factors of disruption

2.4 Impact of drivers and challenges

Chart on Impact of drivers and challenges in 2025 and 2030

3. Market Landscape

3.1 Market ecosystem

Chart on Parent Market
Data Table on - Parent Market

3.2 Market characteristics

Chart on Market characteristics analysis

3.3 Value chain analysis

Chart on Value chain analysis

4. Market Sizing

4.1 Market definition

Data Table on Offerings of companies included in the market definition

4.2 Market segment analysis

Market segments

4.3 Market size 2025

4.4 Market outlook: Forecast for 2025-2030

Chart on Global - Market size and forecast 2025-2030 ($ million)
Data Table on Global - Market size and forecast 2025-2030 ($ million)
Chart on Global Market: Year-over-year growth 2025-2030 (%)
Data Table on Global Market: Year-over-year growth 2025-2030 (%)

5. Historic Market Size

5.1 Global Medication Adherence Monitoring Systems Market 2020 - 2024

Historic Market Size - Data Table on Global Medication Adherence Monitoring Systems Market 2020 - 2024 ($ million)

5.2 Type segment analysis 2020 - 2024

Historic Market Size - Type Segment 2020 - 2024 ($ million)

5.3 Application segment analysis 2020 - 2024

Historic Market Size - Application Segment 2020 - 2024 ($ million)

5.4 End-user segment analysis 2020 - 2024

Historic Market Size - End-user Segment 2020 - 2024 ($ million)

5.5 Geography segment analysis 2020 - 2024

Historic Market Size - Geography Segment 2020 - 2024 ($ million)

5.6 Country segment analysis 2020 - 2024

Historic Market Size - Country Segment 2020 - 2024 ($ million)

6. Qualitative Analysis

6.1 The AI impact on Global Medication Adherence Monitoring Systems Market

7. Five Forces Analysis

7.1 Five forces summary

Five forces analysis - Comparison between 2025 and 2030

7.2 Bargaining power of buyers

Bargaining power of buyers - Impact of key factors 2025 and 2030

7.3 Bargaining power of suppliers

Bargaining power of suppliers - Impact of key factors in 2025 and 2030

7.4 Threat of new entrants

Threat of new entrants - Impact of key factors in 2025 and 2030

7.5 Threat of substitutes

Threat of substitutes - Impact of key factors in 2025 and 2030

7.6 Threat of rivalry

Threat of rivalry - Impact of key factors in 2025 and 2030

7.7 Market condition

Chart on Market condition - Five forces 2025 and 2030

8. Market Segmentation by Type

8.1 Market segments

Chart on Type - Market share 2025-2030 (%)
Data Table on Type - Market share 2025-2030 (%)

8.2 Comparison by Type

Chart on Comparison by Type
Data Table on Comparison by Type

8.3 Software centric - Market size and forecast 2025-2030

Chart on Software centric - Market size and forecast 2025-2030 ($ million)
Data Table on Software centric - Market size and forecast 2025-2030 ($ million)
Chart on Software centric - Year-over-year growth 2025-2030 (%)
Data Table on Software centric - Year-over-year growth 2025-2030 (%)

8.4 Hardware centric - Market size and forecast 2025-2030

Chart on Hardware centric - Market size and forecast 2025-2030 ($ million)
Data Table on Hardware centric - Market size and forecast 2025-2030 ($ million)
Chart on Hardware centric - Year-over-year growth 2025-2030 (%)
Data Table on Hardware centric - Year-over-year growth 2025-2030 (%)

8.5 Market opportunity by Type

Market opportunity by Type ($ million)
Data Table on Market opportunity by Type ($ million)

9. Market Segmentation by Application

9.1 Market segments

Chart on Application - Market share 2025-2030 (%)
Data Table on Application - Market share 2025-2030 (%)

9.2 Comparison by Application

Chart on Comparison by Application
Data Table on Comparison by Application

9.3 Cardiovascular - Market size and forecast 2025-2030

Chart on Cardiovascular - Market size and forecast 2025-2030 ($ million)
Data Table on Cardiovascular - Market size and forecast 2025-2030 ($ million)
Chart on Cardiovascular - Year-over-year growth 2025-2030 (%)
Data Table on Cardiovascular - Year-over-year growth 2025-2030 (%)

9.4 Diabetes - Market size and forecast 2025-2030

Chart on Diabetes - Market size and forecast 2025-2030 ($ million)
Data Table on Diabetes - Market size and forecast 2025-2030 ($ million)
Chart on Diabetes - Year-over-year growth 2025-2030 (%)
Data Table on Diabetes - Year-over-year growth 2025-2030 (%)

9.5 Oncology - Market size and forecast 2025-2030

Chart on Oncology - Market size and forecast 2025-2030 ($ million)
Data Table on Oncology - Market size and forecast 2025-2030 ($ million)
Chart on Oncology - Year-over-year growth 2025-2030 (%)
Data Table on Oncology - Year-over-year growth 2025-2030 (%)

9.6 Central nervous system - Market size and forecast 2025-2030

Chart on Central nervous system - Market size and forecast 2025-2030 ($ million)
Data Table on Central nervous system - Market size and forecast 2025-2030 ($ million)
Chart on Central nervous system - Year-over-year growth 2025-2030 (%)
Data Table on Central nervous system - Year-over-year growth 2025-2030 (%)

9.7 Others - Market size and forecast 2025-2030

Chart on Others - Market size and forecast 2025-2030 ($ million)
Data Table on Others - Market size and forecast 2025-2030 ($ million)
Chart on Others - Year-over-year growth 2025-2030 (%)
Data Table on Others - Year-over-year growth 2025-2030 (%)

9.8 Market opportunity by Application

Market opportunity by Application ($ million)
Data Table on Market opportunity by Application ($ million)

10. Market Segmentation by End-user

10.1 Market segments

Chart on End-user - Market share 2025-2030 (%)
Data Table on End-user - Market share 2025-2030 (%)

10.2 Comparison by End-user

Chart on Comparison by End-user
Data Table on Comparison by End-user

10.3 Hospitals and health systems - Market size and forecast 2025-2030

Chart on Hospitals and health systems - Market size and forecast 2025-2030 ($ million)
Data Table on Hospitals and health systems - Market size and forecast 2025-2030 ($ million)
Chart on Hospitals and health systems - Year-over-year growth 2025-2030 (%)
Data Table on Hospitals and health systems - Year-over-year growth 2025-2030 (%)

10.4 Home care settings - Market size and forecast 2025-2030

Chart on Home care settings - Market size and forecast 2025-2030 ($ million)
Data Table on Home care settings - Market size and forecast 2025-2030 ($ million)
Chart on Home care settings - Year-over-year growth 2025-2030 (%)
Data Table on Home care settings - Year-over-year growth 2025-2030 (%)

10.5 Retail pharmacies - Market size and forecast 2025-2030

Chart on Retail pharmacies - Market size and forecast 2025-2030 ($ million)
Data Table on Retail pharmacies - Market size and forecast 2025-2030 ($ million)
Chart on Retail pharmacies - Year-over-year growth 2025-2030 (%)
Data Table on Retail pharmacies - Year-over-year growth 2025-2030 (%)

10.6 Others - Market size and forecast 2025-2030

Chart on Others - Market size and forecast 2025-2030 ($ million)
Data Table on Others - Market size and forecast 2025-2030 ($ million)
Chart on Others - Year-over-year growth 2025-2030 (%)
Data Table on Others - Year-over-year growth 2025-2030 (%)

10.7 Market opportunity by End-user

Market opportunity by End-user ($ million)
Data Table on Market opportunity by End-user ($ million)

11. Customer Landscape

11.1 Customer landscape overview

Analysis of price sensitivity, lifecycle, customer purchase basket, adoption rates, and purchase criteria

12. Geographic Landscape

12.1 Geographic segmentation

Chart on Market share by geography 2025-2030 (%)
Data Table on Market share by geography 2025-2030 (%)

12.2 Geographic comparison

Chart on Geographic comparison
Data Table on Geographic comparison

12.3 North America - Market size and forecast 2025-2030

Chart on North America - Market size and forecast 2025-2030 ($ million)
Data Table on North America - Market size and forecast 2025-2030 ($ million)
Chart on North America - Year-over-year growth 2025-2030 (%)
Data Table on North America - Year-over-year growth 2025-2030 (%)
Chart on Regional Comparison - North America
Data Table on Regional Comparison - North America

12.3.1 US - Market size and forecast 2025-2030

Chart on US - Market size and forecast 2025-2030 ($ million)
Data Table on US - Market size and forecast 2025-2030 ($ million)
Chart on US - Year-over-year growth 2025-2030 (%)
Data Table on US - Year-over-year growth 2025-2030 (%)

12.3.2 Canada - Market size and forecast 2025-2030

Chart on Canada - Market size and forecast 2025-2030 ($ million)
Data Table on Canada - Market size and forecast 2025-2030 ($ million)
Chart on Canada - Year-over-year growth 2025-2030 (%)
Data Table on Canada - Year-over-year growth 2025-2030 (%)

12.3.3 Mexico - Market size and forecast 2025-2030

Chart on Mexico - Market size and forecast 2025-2030 ($ million)
Data Table on Mexico - Market size and forecast 2025-2030 ($ million)
Chart on Mexico - Year-over-year growth 2025-2030 (%)
Data Table on Mexico - Year-over-year growth 2025-2030 (%)

12.4 Europe - Market size and forecast 2025-2030

Chart on Europe - Market size and forecast 2025-2030 ($ million)
Data Table on Europe - Market size and forecast 2025-2030 ($ million)
Chart on Europe - Year-over-year growth 2025-2030 (%)
Data Table on Europe - Year-over-year growth 2025-2030 (%)
Chart on Regional Comparison - Europe
Data Table on Regional Comparison - Europe

12.4.1 Germany - Market size and forecast 2025-2030

Chart on Germany - Market size and forecast 2025-2030 ($ million)
Data Table on Germany - Market size and forecast 2025-2030 ($ million)
Chart on Germany - Year-over-year growth 2025-2030 (%)
Data Table on Germany - Year-over-year growth 2025-2030 (%)

12.4.2 UK - Market size and forecast 2025-2030

Chart on UK - Market size and forecast 2025-2030 ($ million)
Data Table on UK - Market size and forecast 2025-2030 ($ million)
Chart on UK - Year-over-year growth 2025-2030 (%)
Data Table on UK - Year-over-year growth 2025-2030 (%)

12.4.3 France - Market size and forecast 2025-2030

Chart on France - Market size and forecast 2025-2030 ($ million)
Data Table on France - Market size and forecast 2025-2030 ($ million)
Chart on France - Year-over-year growth 2025-2030 (%)
Data Table on France - Year-over-year growth 2025-2030 (%)

12.4.4 Italy - Market size and forecast 2025-2030

Chart on Italy - Market size and forecast 2025-2030 ($ million)
Data Table on Italy - Market size and forecast 2025-2030 ($ million)
Chart on Italy - Year-over-year growth 2025-2030 (%)
Data Table on Italy - Year-over-year growth 2025-2030 (%)

12.4.5 The Netherlands - Market size and forecast 2025-2030

Chart on The Netherlands - Market size and forecast 2025-2030 ($ million)
Data Table on The Netherlands - Market size and forecast 2025-2030 ($ million)
Chart on The Netherlands - Year-over-year growth 2025-2030 (%)
Data Table on The Netherlands - Year-over-year growth 2025-2030 (%)

12.4.6 Spain - Market size and forecast 2025-2030

Chart on Spain - Market size and forecast 2025-2030 ($ million)
Data Table on Spain - Market size and forecast 2025-2030 ($ million)
Chart on Spain - Year-over-year growth 2025-2030 (%)
Data Table on Spain - Year-over-year growth 2025-2030 (%)

12.4.7 Russia - Market size and forecast 2025-2030

Chart on Russia - Market size and forecast 2025-2030 ($ million)
Data Table on Russia - Market size and forecast 2025-2030 ($ million)
Chart on Russia - Year-over-year growth 2025-2030 (%)
Data Table on Russia - Year-over-year growth 2025-2030 (%)

12.5 Asia - Market size and forecast 2025-2030

Chart on Asia - Market size and forecast 2025-2030 ($ million)
Data Table on Asia - Market size and forecast 2025-2030 ($ million)
Chart on Asia - Year-over-year growth 2025-2030 (%)
Data Table on Asia - Year-over-year growth 2025-2030 (%)
Chart on Regional Comparison - Asia
Data Table on Regional Comparison - Asia

12.5.1 China - Market size and forecast 2025-2030

Chart on China - Market size and forecast 2025-2030 ($ million)
Data Table on China - Market size and forecast 2025-2030 ($ million)
Chart on China - Year-over-year growth 2025-2030 (%)
Data Table on China - Year-over-year growth 2025-2030 (%)

12.5.2 Japan - Market size and forecast 2025-2030

Chart on Japan - Market size and forecast 2025-2030 ($ million)
Data Table on Japan - Market size and forecast 2025-2030 ($ million)
Chart on Japan - Year-over-year growth 2025-2030 (%)
Data Table on Japan - Year-over-year growth 2025-2030 (%)

12.5.3 India - Market size and forecast 2025-2030

Chart on India - Market size and forecast 2025-2030 ($ million)
Data Table on India - Market size and forecast 2025-2030 ($ million)
Chart on India - Year-over-year growth 2025-2030 (%)
Data Table on India - Year-over-year growth 2025-2030 (%)

12.5.4 South Korea - Market size and forecast 2025-2030

Chart on South Korea - Market size and forecast 2025-2030 ($ million)
Data Table on South Korea - Market size and forecast 2025-2030 ($ million)
Chart on South Korea - Year-over-year growth 2025-2030 (%)
Data Table on South Korea - Year-over-year growth 2025-2030 (%)

12.5.5 Indonesia - Market size and forecast 2025-2030

Chart on Indonesia - Market size and forecast 2025-2030 ($ million)
Data Table on Indonesia - Market size and forecast 2025-2030 ($ million)
Chart on Indonesia - Year-over-year growth 2025-2030 (%)
Data Table on Indonesia - Year-over-year growth 2025-2030 (%)

12.5.6 Thailand - Market size and forecast 2025-2030

Chart on Thailand - Market size and forecast 2025-2030 ($ million)
Data Table on Thailand - Market size and forecast 2025-2030 ($ million)
Chart on Thailand - Year-over-year growth 2025-2030 (%)
Data Table on Thailand - Year-over-year growth 2025-2030 (%)

12.5.7 Singapore - Market size and forecast 2025-2030

Chart on Singapore - Market size and forecast 2025-2030 ($ million)
Data Table on Singapore - Market size and forecast 2025-2030 ($ million)
Chart on Singapore - Year-over-year growth 2025-2030 (%)
Data Table on Singapore - Year-over-year growth 2025-2030 (%)

12.6 Rest of World (ROW) - Market size and forecast 2025-2030

Chart on Rest of World (ROW) - Market size and forecast 2025-2030 ($ million)
Data Table on Rest of World (ROW) - Market size and forecast 2025-2030 ($ million)
Chart on Rest of World (ROW) - Year-over-year growth 2025-2030 (%)
Data Table on Rest of World (ROW) - Year-over-year growth 2025-2030 (%)
Chart on Regional Comparison - Rest of World (ROW)
Data Table on Regional Comparison - Rest of World (ROW)

12.6.1 Australia - Market size and forecast 2025-2030

Chart on Australia - Market size and forecast 2025-2030 ($ million)
Data Table on Australia - Market size and forecast 2025-2030 ($ million)
Chart on Australia - Year-over-year growth 2025-2030 (%)
Data Table on Australia - Year-over-year growth 2025-2030 (%)

12.6.2 UAE - Market size and forecast 2025-2030

Chart on UAE - Market size and forecast 2025-2030 ($ million)
Data Table on UAE - Market size and forecast 2025-2030 ($ million)
Chart on UAE - Year-over-year growth 2025-2030 (%)
Data Table on UAE - Year-over-year growth 2025-2030 (%)

12.6.3 Brazil - Market size and forecast 2025-2030

Chart on Brazil - Market size and forecast 2025-2030 ($ million)
Data Table on Brazil - Market size and forecast 2025-2030 ($ million)
Chart on Brazil - Year-over-year growth 2025-2030 (%)
Data Table on Brazil - Year-over-year growth 2025-2030 (%)

12.6.4 South Africa - Market size and forecast 2025-2030

Chart on South Africa - Market size and forecast 2025-2030 ($ million)
Data Table on South Africa - Market size and forecast 2025-2030 ($ million)
Chart on South Africa - Year-over-year growth 2025-2030 (%)
Data Table on South Africa - Year-over-year growth 2025-2030 (%)

12.6.5 Saudi Arabia - Market size and forecast 2025-2030

Chart on Saudi Arabia - Market size and forecast 2025-2030 ($ million)
Data Table on Saudi Arabia - Market size and forecast 2025-2030 ($ million)
Chart on Saudi Arabia - Year-over-year growth 2025-2030 (%)
Data Table on Saudi Arabia - Year-over-year growth 2025-2030 (%)

12.6.6 Turkey - Market size and forecast 2025-2030

Chart on Turkey - Market size and forecast 2025-2030 ($ million)
Data Table on Turkey - Market size and forecast 2025-2030 ($ million)
Chart on Turkey - Year-over-year growth 2025-2030 (%)
Data Table on Turkey - Year-over-year growth 2025-2030 (%)

12.7 Market opportunity by geography

Market opportunity by geography ($ million)
Data Tables on Market opportunity by geography ($ million)

13. Drivers, Challenges, and Opportunity

13.1 Market drivers

Rising prevalence of chronic diseases and growing geriatric population
Technological advancements and integration of internet of medical things
Shift toward value-based care and cost containment strategies

13.2 Market challenges

Concerns regarding data privacy and cybersecurity vulnerabilities
Integration complexity and lack of interoperability with healthcare infrastructure
High implementation costs and inconsistent reimbursement frameworks

13.3 Impact of drivers and challenges

Impact of drivers and challenges in 2025 and 2030

13.4 Market opportunities

Proliferation of AI and predictive behavioral analytics
Increasing adoption of monitoring systems in decentralized clinical trials
Evolution of smart packaging and biometric ingestible sensors

14. Competitive Landscape

14.1 Overview

14.2

Overview on criticality of inputs and factors of differentiation

14.3 Landscape disruption

Overview on factors of disruption

14.4 Industry risks

Impact of key risks on business

15. Competitive Analysis

15.1 Companies profiled

Companies covered

15.2 Company ranking index

15.3 Market positioning of companies

Matrix on companies position and classification

15.4 AARDEX Group S.A.

AARDEX Group S.A. - Overview
AARDEX Group S.A. - Product / Service
AARDEX Group S.A. - Key offerings
SWOT

15.5 AbbVie Inc.

AbbVie Inc. - Overview
AbbVie Inc. - Business segments
AbbVie Inc. - Key news
AbbVie Inc. - Key offerings
AbbVie Inc. - Segment focus
SWOT

15.6 AdhereHealth LLC

AdhereHealth LLC - Overview
AdhereHealth LLC - Product / Service
AdhereHealth LLC - Key offerings
SWOT

15.7 AiCure

AiCure - Overview
AiCure - Product / Service
AiCure - Key offerings
SWOT

15.8 Cardinal Health Inc.

Cardinal Health Inc. - Overview
Cardinal Health Inc. - Business segments
Cardinal Health Inc. - Key news
Cardinal Health Inc. - Key offerings
Cardinal Health Inc. - Segment focus
SWOT

15.9 DrFirst Inc

DrFirst Inc - Overview
DrFirst Inc - Product / Service
DrFirst Inc - Key offerings
SWOT

15.10 EveryDose Inc.

EveryDose Inc. - Overview
EveryDose Inc. - Product / Service
EveryDose Inc. - Key offerings
SWOT

15.11 Hero Health Inc.

Hero Health Inc. - Overview
Hero Health Inc. - Product / Service
Hero Health Inc. - Key offerings
SWOT

15.12 Information Mediary Corp.

Information Mediary Corp. - Overview
Information Mediary Corp. - Product / Service
Information Mediary Corp. - Key offerings
SWOT

15.13 Johnson and Johnson Services

Johnson and Johnson Services - Overview
Johnson and Johnson Services - Business segments
Johnson and Johnson Services - Key news
Johnson and Johnson Services - Key offerings
Johnson and Johnson Services - Segment focus
SWOT

15.14 Koninklijke Philips N.V.

Koninklijke Philips N.V. - Overview
Koninklijke Philips N.V. - Business segments
Koninklijke Philips N.V. - Key news
Koninklijke Philips N.V. - Key offerings
Koninklijke Philips N.V. - Segment focus
SWOT

15.15 McKesson Corp.

McKesson Corp. - Overview
McKesson Corp. - Business segments
McKesson Corp. - Key news
McKesson Corp. - Key offerings
McKesson Corp. - Segment focus
SWOT

15.16 Medisafe

Medisafe - Overview
Medisafe - Product / Service
Medisafe - Key offerings
SWOT

15.17 Medminder Systems Inc.

Medminder Systems Inc. - Overview
Medminder Systems Inc. - Product / Service
Medminder Systems Inc. - Key offerings
SWOT

15.18 Medtronic Plc

Medtronic Plc - Overview
Medtronic Plc - Business segments
Medtronic Plc - Key news
Medtronic Plc - Key offerings
Medtronic Plc - Segment focus
SWOT

16. Appendix

16.1 Scope of the report

Market definition
Objectives
Notes and caveats

16.2 Inclusions and exclusions checklist

Inclusions checklist
Exclusions checklist

16.3 Currency conversion rates for US$

16.4 Research methodology

16.5 Data procurement

Information sources

16.6 Data validation

16.7 Validation techniques employed for market sizing

16.8 Data synthesis

16.9 360 degree market analysis

16.10 List of abbreviations

Research Methodology

Technavio presents a detailed picture of the market by way of study, synthesis, and summation of data from multiple sources. The analysts have presented the various facets of the market with a particular focus on identifying the key industry influencers. The data thus presented is comprehensive, reliable, and the result of extensive research, both primary and secondary.

INFORMATION SOURCES

Primary sources

  • Manufacturers and suppliers
  • Channel partners
  • Industry experts
  • Strategic decision makers

Secondary sources

  • Industry journals and periodicals
  • Government data
  • Financial reports of key industry players
  • Historical data
  • Press releases

DATA ANALYSIS

Data Synthesis

  • Collation of data
  • Estimation of key figures
  • Analysis of derived insights

Data Validation

  • Triangulation with data models
  • Reference against proprietary databases
  • Corroboration with industry experts

REPORT WRITING

Qualitative

  • Market drivers
  • Market challenges
  • Market trends
  • Five forces analysis

Quantitative

  • Market size and forecast
  • Market segmentation
  • Geographical insights
  • Competitive landscape

Interested in this report?

Get your sample now to see our research methodology and insights!

Download Now

Frequently Asked Questions

Medication Adherence Monitoring Systems market growth will increase by USD 1458.5 million during 2026-2030.

The Medication Adherence Monitoring Systems market is expected to grow at a CAGR of 14.9% during 2026-2030.

Medication Adherence Monitoring Systems market is segmented by Type (Software centric, Hardware centric) Application (Cardiovascular, Diabetes, Oncology, Central nervous system, Others) End-user (Hospitals and health systems, Home care settings, Retail pharmacies, Others)

AARDEX Group S.A., AbbVie Inc., AdhereHealth LLC, AiCure, Cardinal Health Inc., DrFirst Inc, EveryDose Inc., Hero Health Inc., Information Mediary Corp., Johnson and Johnson Services, Koninklijke Philips N.V., McKesson Corp., Medisafe, Medminder Systems Inc., Medtronic Plc, Omnicell Inc., Otsuka Holdings Co. Ltd., PillPack LLC, ResMed Inc., Vaica Medical Ltd are a few of the key vendors in the Medication Adherence Monitoring Systems market.

North America will register the highest growth rate of 39.5% among the other regions. Therefore, the Medication Adherence Monitoring Systems market in North America is expected to garner significant business opportunities for the vendors during the forecast period.

US, Canada, Mexico, Germany, UK, France, Italy, The Netherlands, Spain, Russia, China, Japan, India, South Korea, Indonesia, Thailand, Singapore, Australia, UAE, Brazil, South Africa, Saudi Arabia, Turkey

  • Rising prevalence of chronic diseases and growing geriatric population is the driving factor this market.

The Medication Adherence Monitoring Systems market vendors should focus on grabbing business opportunities from the Type segment as it accounted for the largest market share in the base year.
RIA - Research AI Assistant
Ask RIA