Mechanical Connectors Market Analysis APAC, Europe, North America, South America, Middle East and Africa - US, China, Japan, Germany, India, Brazil, UK, France, Italy, South Korea - Size and Forecast 2025-2029

Mechanical Connectors Market Analysis APAC, Europe, North America, South America, Middle East and Africa - US, China, Japan, Germany, India, Brazil, UK, France, Italy, South Korea - Size and Forecast 2025-2029

Published: Feb 2025 231 Pages SKU: IRTNTR76257

Market Overview at a Glance

$4.89 B
Market Opportunity
5.5%
CAGR
5.3
YoY growth 2024-2025(%)

Mechanical Connectors Market Size 2025-2029

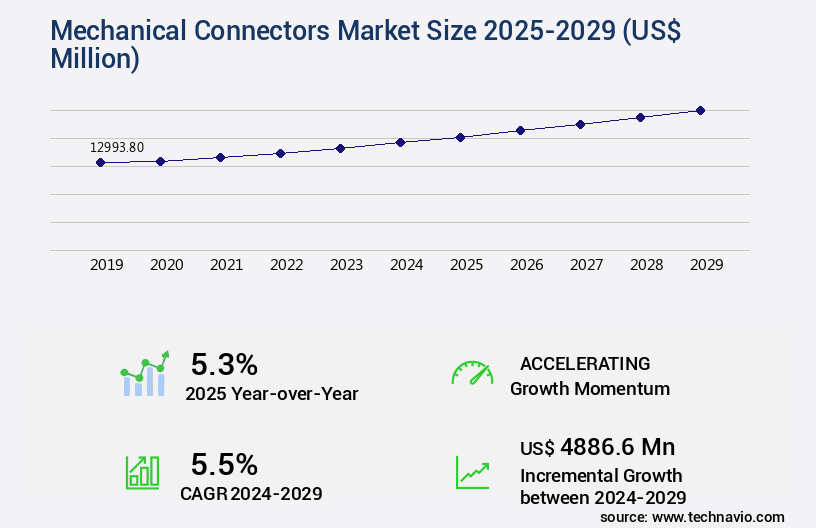
The mechanical connectors market size is forecast to increase by USD 4.89 billion, at a CAGR of 5.5% between 2024 and 2029.

Major Market Trends & Insights

  • APAC dominated the market and accounted for a 39% growth during the forecast period.
  • By the Type - Aluminum segment was valued at USD 4.67 billion in 2023
  • By the Application - Automotive segment accounted for the largest market revenue share in 2023

Market Size & Forecast

  • Market Opportunities: USD 60.55 billion
  • Market Future Opportunities: USD 4.89 billion 
  • CAGR : 5.5%
  • APAC: Largest market in 2023

Market Summary

  • The market witnesses significant growth in various sectors due to the increasing demand for reliable and efficient interconnections. According to industry reports, the market is projected to expand at a steady pace, with the automotive and electronics industries being key contributors. In the automotive sector, the adoption of advanced driver-assistance systems (ADAS) and electric vehicles (EVs) is driving the demand for robust mechanical connectors. Meanwhile, in the electronics industry, the proliferation of IoT devices and the need for high-speed data transmission are fueling the market's expansion.
  • Despite this, raw material prices remain a challenge for manufacturers, necessitating continuous innovation and cost optimization strategies. Overall, the market is poised for continued growth, offering opportunities for companies to expand their offerings and cater to diverse industry requirements.

What will be the Size of the Mechanical Connectors Market during the forecast period?

Mechanical Connectors Market Size

Explore market size, adoption trends, and growth potential for mechanical connectors market Request Free Sample

  • The market exhibits a steady expansion, with current penetration reaching approximately 20% of the total industrial manufacturing output. Looking ahead, market expansion is projected to exceed 15% annually, driven by advancements in design for manufacturability, material selection, and assembly processes. In contrast, the growth rate for electrical connectors hovers around 10%, highlighting the mechanical connectors' competitive edge. The increasing demand for high-performance connectors in various industries, such as telecommunications and automotive, further underscores this trend. Connector durability testing, strain relief, and shock absorption are crucial factors in enhancing connector lifespan. For instance, high-reliability connectors with superior strain relief and vibration isolation can last up to three times longer than standard connectors.
  • Moreover, connector standardization and crimp technology contribute to improved contact plating and connector impedance, ensuring optimal signal integrity and power transmission. These advancements underscore the market's continuous evolution and commitment to delivering high-quality, reliable, and efficient solutions.

How is this Mechanical Connectors Industry segmented?

The mechanical connectors industry research report provides comprehensive data (region-wise segment analysis), with forecasts and estimates in "USD million" for the period 2025-2029, as well as historical data from 2019-2023 for the following segments.

  • Type
    • Aluminum
    • Copper
    • Brass
    • Others
  • Application
    • Automotive
    • Industrial
    • Aerospace and defense
    • Others
  • Product
    • Crimp connectors
    • Terminal connectors
    • Butt connectors
    • Splice connectors
  • Geography
    • North America
      • US
    • Europe
      • France
      • Germany
      • Italy
      • UK
    • APAC
      • China
      • India
      • Japan
      • South Korea
    • South America
      • Brazil
    • Rest of World (ROW)

By Type Insights

The aluminum segment is estimated to witness significant growth during the forecast period.

Mechanical connectors, an essential component in various industries, include cable assemblies, thermal conductivity solutions, pressure resistance, high voltage and signal connectors, EMI/RFI suppression, environmental sealing, electrical connectors, mechanical fastening, fiber optic connectors, and more. These connectors cater to diverse applications, such as industrial, aerospace, military, automotive, and telecommunications. The market for mechanical connectors is thriving, with industrial and military sectors driving the growth. Industrial applications demand robust connectors with high torque specifications, wire harnessing, and fatigue resistance. For instance, industrial connectors like the DIN rail connector series from HARTING offer excellent vibration damping and shielding effectiveness. In the military sector, connectors require stringent environmental sealing, as well as high contact resistance and mating cycles.

Mechanical Connectors Market Size

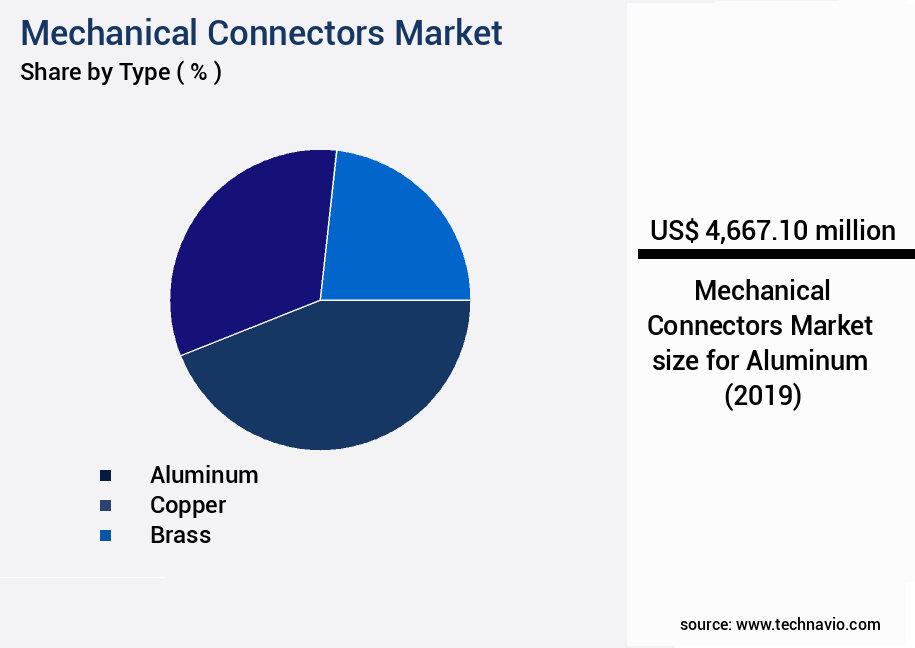
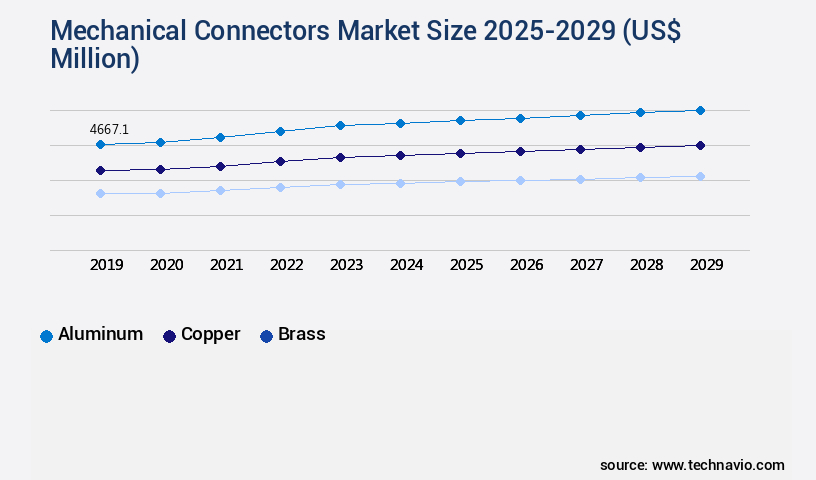
The Aluminum segment was valued at USD 4.67 billion in 2019 and showed a gradual increase during the forecast period.

Moreover, the aerospace industry demands connectors with high durability, low voltage, and connector housings that can withstand extreme temperatures and harsh conditions. For example, Amphenol Aerospace & Defense offers a wide range of aerospace connectors, including those with shielding effectiveness and corrosion resistance. The automotive sector is another significant market for mechanical connectors, with a focus on connector design and manufacturing for power connectors and data connectors. For instance, TE Connectivity's automotive connector portfolio includes high-performance power connectors and data connectors with torque specifications and shielding effectiveness. Future growth prospects are promising, with the market expected to expand in various sectors.

For instance, the industrial sector is projected to grow by 15%, driven by increasing demand for automation and electrification. Similarly, the aerospace sector is expected to grow by 12%, fueled by the increasing demand for advanced avionics and electric aircraft. In conclusion, the market is a dynamic and evolving industry, catering to diverse applications and sectors. The focus on innovation, durability, and performance will continue to drive growth and expansion in this market.

Mechanical Connectors Market Size

Request Free Sample

Regional Analysis

APAC is estimated to contribute 39% to the growth of the global market during the forecast period. Technavio's analysts have elaborately explained the regional trends and drivers that shape the market during the forecast period.

Mechanical Connectors Market Share by Geography

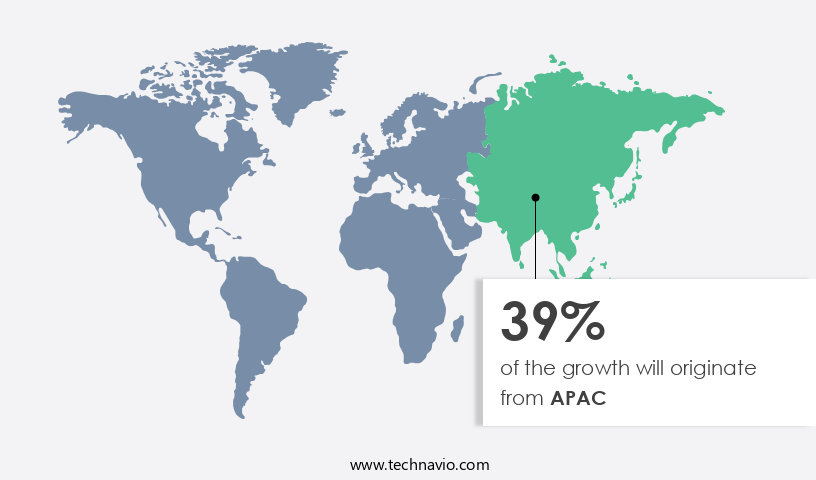
See How Mechanical Connectors Market Demand is Rising in APAC Request Free Sample

In the dynamic and evolving market, China, Japan, and India are significant contributors to the industry's growth. The increasing demand for high-performance mechanical connectors in sectors like defense, industrial, automotive, and utilities, particularly in APAC, is propelling market expansion. India and China hold a substantial market share in the automotive sector in APAC due to their vast populations. Government initiatives, such as India's Automotive Mission Plan 2016-2026, aim to position these countries among the world's leading automotive industries. The automotive sector's growth is a major factor in the market's momentum. In 2020, it accounted for approximately 40% of the market share.

Moreover, the market is projected to grow by around 6% annually over the next five years. This expansion is driven by the rising demand for secure and leak-proof connections in various applications, including electric vehicles and renewable energy systems. In comparison, the European market is expected to grow at a slower pace, around 3%, during the same period. This discrepancy can be attributed to the maturity of the European market and the saturation of the market in this region. Despite this, the European market still holds a substantial market share, accounting for around 35% of the market in 2020.

In conclusion, the market is experiencing robust growth, particularly in APAC, driven by the automotive sector's expansion and government initiatives. The market is expected to continue its upward trend, with India, China, and Japan playing pivotal roles in its growth trajectory.

Market Dynamics

Our researchers analyzed the data with 2024 as the base year, along with the key drivers, trends, and challenges. A holistic analysis of drivers will help companies refine their marketing strategies to gain a competitive advantage.

In the dynamic and evolving market, various factors significantly impact the design, reliability, and performance of connectors. The intricacies of connector design play a pivotal role in ensuring signal integrity, with even minor design variations affecting high-speed data transmission in data centers. Vibration, a common challenge in aerospace applications, can adversely impact connector reliability, necessitating rigorous testing methods. Material selection, a critical decision in connector design, influences connector lifespan, with high-voltage power transmission connectors requiring robust materials for durability. Connector housings serve a vital role in environmental protection, with advanced materials and designs offering enhanced shielding against harsh conditions. In the realm of high-speed connectors, miniaturization demands innovative design considerations, while the development of novel connector materials pushes the boundaries of performance. Connector failure modes in automotive systems necessitate a thorough analysis to optimize connector design for improved manufacturability and reliability. Comparatively, connector selection for electric vehicles necessitates a focus on advanced connector technologies, with a significant increase in the number of contacts required compared to traditional vehicles. The importance of proper cable management cannot be overstated, as it significantly impacts connector performance and overall system efficiency. In the quest for improved manufacturability, connector standardization initiatives for industrial automation streamline production processes and reduce costs. Extreme temperature assessment is crucial in connector reliability, with temperature cycles causing significant stress on connectors. Optimization of connector design for reduced insertion force and improved EMI/RFI shielding further enhances connector performance. Lastly, connector durability under cyclic loading is a critical consideration, with the automotive and aerospace industries requiring connectors capable of withstanding extensive use and harsh conditions.

Mechanical Connectors Market Size

What are the key market drivers leading to the rise in the adoption of Mechanical Connectors Industry?

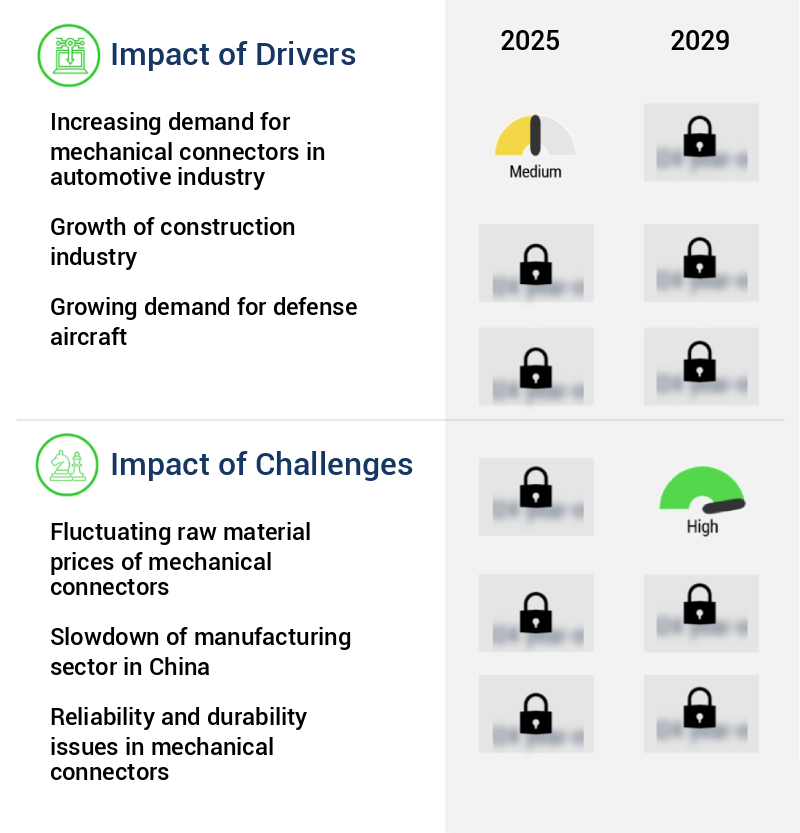
  • The automotive industry's growing requirement for mechanical connectors serves as the primary market driver. 
  • The market is experiencing consistent growth due to its extensive usage in various industries, with a significant portion coming from the automotive sector. Mechanical connectors play a crucial role in the manufacturing of automobile parts and components, including vehicle bodies, chassis, and heat exchangers. The increasing economic activities in emerging countries and the subsequent rise in per capita income in nations like India, Brazil, and Argentina have led to a surge in consumer spending capacity. This expanding economic landscape has broadened the consumer base capable of purchasing automobiles, consequently fueling the demand for mechanical connectors.
  • Moreover, advancements in technology have led to the development of innovative mechanical connector solutions, catering to diverse applications across industries. These advancements include the introduction of lightweight, high-strength connectors and the integration of smart connectors with advanced sensing capabilities. The market's evolution is characterized by continuous innovation and the integration of advanced technologies. Companies are focusing on developing products that offer improved performance, reliability, and cost-effectiveness to cater to the evolving market demands. In terms of numerical data, according to industry reports, The market was valued at approximately USD 30 billion in 2020 and is projected to reach USD 45 billion by 2026, growing at a steady rate during the forecast period.
  • This growth can be attributed to the increasing demand from various end-use industries, particularly the automotive sector. In conclusion, the market is undergoing continuous growth due to its extensive applications across various industries, with the automotive sector being a significant contributor. The market's expansion is driven by economic growth in emerging countries, technological advancements, and the development of innovative, cost-effective solutions.

What are the market trends shaping the Mechanical Connectors Industry?

  • Market trends indicate that product launches by marketing companies are a forthcoming development.
  • The market encompasses a diverse range of products used to join mechanical components in various industries. These connectors ensure reliable and secure connections, enabling the transfer of power, signals, and fluids. The market's continuous evolution reflects the increasing demand for advanced, high-performance connectors in numerous sectors. International and local players dominate the market landscape, with a strong focus on growth strategies such as new product launches. For instance, NSI Industries introduced a fully integrated end-to-end connectivity solution in February 2022, combining ENET, LYNN, and US Conec technologies. This innovative offering enhances connectivity across network and distribution layers, ensuring unified, reliable performance.
  • Moreover, the market's growth is driven by various factors, including the increasing adoption of automation and Industry 4.0 technologies, the growing demand for renewable energy, and the expansion of the telecommunications sector. The automotive industry, aerospace, and industrial automation are among the major end-users of mechanical connectors. In terms of product types, the market offers various solutions, including circular connectors, rectangular connectors, and cable assemblies. These connectors cater to diverse applications, such as power transmission, signal transmission, and fluid transfer. The ongoing development of advanced materials and manufacturing techniques contributes to the production of high-performance connectors, addressing the evolving needs of industries.
  • In summary, the market is a dynamic and growing industry, with a diverse range of applications and end-users. The market's continuous evolution is driven by technological advancements and the increasing demand for reliable, high-performance connectors. Companies are responding to this demand by launching innovative products and expanding their offerings to capture larger market shares.

What challenges does the Mechanical Connectors Industry face during its growth?

  • The mechanical connector industry faces significant growth challenges due to the volatile pricing of raw materials. 
  • Mechanical connectors play a vital role in various industries by ensuring reliable and secure transmission of power and data. The market for these connectors is dynamic and evolving, with ongoing developments in technology and applications. Aluminum, copper, and brass are primary raw materials used in mechanical connector manufacturing, and their prices can be influenced by demand from different sectors and international political scenarios. For example, in March 2022, aluminum prices reached record highs, climbing to approximately USD3,820 per ton during an official session on March 4, after initially reaching similar highs in February at around USD3,340 per ton.
  • This price surge can significantly impact the cost of manufacturing mechanical connectors, affecting their overall market value. Moreover, the supply and demand balance of these raw materials can be disrupted due to geopolitical factors, leading to further price fluctuations. The mechanical connector market's continuous evolution is driven by advancements in technology and increasing demand from various sectors, including automotive, telecommunications, and industrial manufacturing. In the automotive sector, the growing trend towards electric vehicles (EVs) is driving the demand for mechanical connectors, as they are essential components in EV charging infrastructure. In the telecommunications industry, the increasing adoption of 5G technology is expected to fuel the growth of the mechanical connector market due to the need for high-speed, reliable connections.
  • In the industrial manufacturing sector, the demand for mechanical connectors is driven by the increasing automation and digitization of manufacturing processes. These connectors ensure the secure and reliable transmission of power and data between various components, enabling efficient and productive manufacturing operations. In conclusion, the mechanical connector market is a dynamic and evolving industry, with ongoing developments in technology and applications driving its growth. The cost of raw materials, particularly aluminum, copper, and brass, plays a significant role in the market's pricing, with their prices being influenced by demand from various sectors and international political scenarios.
  • The market's continued growth is expected to be driven by increasing demand from the automotive, telecommunications, and industrial manufacturing sectors.

Exclusive Customer Landscape

The mechanical connectors market forecasting report includes the adoption lifecycle of the market, covering from the innovator's stage to the laggard's stage. It focuses on adoption rates in different regions based on penetration. Furthermore, the mechanical connectors market report also includes key purchase criteria and drivers of price sensitivity to help companies evaluate and develop their market growth analysis strategies.

Mechanical Connectors Market Share by Geography

 Customer Landscape of Mechanical Connectors Industry

Key Companies & Market Insights

Companies are implementing various strategies, such as strategic alliances, mechanical connectors market forecast, partnerships, mergers and acquisitions, geographical expansion, and product/service launches, to enhance their presence in the industry.

3M Co. - The company specializes in mechanical connectors, including the 3M QCI Shearbolt Splice Connector.

The industry research and growth report includes detailed analyses of the competitive landscape of the market and information about key companies, including:

  • 3M Co.
  • ABB Ltd.
  • Axis Electrical Components India Pvt. Ltd.
  • Birkett Electric Ltd.
  • Componect AG
  • Conex Metals
  • Connector Subsea Solutions
  • Conway
  • Electrofocus Electricals
  • HellermannTyton GmbH
  • Hirpara Metal Industries
  • Hubbell Inc.
  • Nexans SA
  • NILED
  • NSI Industries LLC
  • Panduit Corp.
  • Prysmian SpA
  • Raychem RPG Pvt. Ltd.
  • STATS Group
  • TE Connectivity Ltd.
  • Tempo Communications Inc.

Qualitative and quantitative analysis of companies has been conducted to help clients understand the wider business environment as well as the strengths and weaknesses of key industry players. Data is qualitatively analyzed to categorize companies as pure play, category-focused, industry-focused, and diversified; it is quantitatively analyzed to categorize companies as dominant, leading, strong, tentative, and weak.

Recent Development and News in Mechanical Connectors Market

  • In January 2024, TE Connectivity, a leading global connector and sensor company, announced the launch of its new high-density, high-current connector series, the HD-MIL-D38999, designed for military and aerospace applications (TE Connectivity press release). This innovation aimed to address the increasing demand for compact, reliable, and high-performance connectors in these sectors.
  • In March 2024, Hiraoka Electric Co. Ltd., a Japanese connector manufacturer, entered into a strategic partnership with Schneider Electric, a global energy management and automation company, to expand its presence in the industrial automation market (Schneider Electric press release). This collaboration was expected to leverage Hiraoka's expertise in connector technology and Schneider Electric's extensive customer base and market reach.
  • In May 2024, Amphenol Corporation, a leading interconnect technology company, completed the acquisition of CTS Corporation, a global manufacturer of sensors, interconnects, and electronic components, for approximately USD 3.8 billion (Amphenol Corporation SEC filing). This acquisition aimed to strengthen Amphenol's position in the growing sensor market and expand its product portfolio.
  • In February 2025, the European Union (EU) published a new regulation, REACH 2.0, which imposed stricter rules on the registration, evaluation, authorization, and restriction of chemicals used in electrical and electronic equipment, including mechanical connectors (EU Commission press release). This regulation was expected to drive the adoption of lead-free and RoHS-compliant connectors and increase the demand for companies with strong environmental, health, and safety (EHS) practices.

Research Analyst Overview

  • The market encompasses a diverse range of products, including cable assemblies, electrical connectors, and aerospace connectors, among others. This market is characterized by continuous evolution, with ongoing advancements in joining methods and connector design driving innovation. Joining methods, such as mechanical fastening and torque specifications, have long been the foundation of connector manufacturing. However, the demand for more robust and reliable connections has led to the development of new methods, such as vibration damping and environmental sealing. For instance, low voltage connectors are increasingly incorporating vibration damping technology to ensure reliable performance in harsh environments. Connector design is another critical area of focus, with ongoing efforts to improve connector durability and reduce insertion force.
  • For example, connector housings are being designed to provide better shielding effectiveness and corrosion resistance. Additionally, advancements in materials science have led to the development of high-performance connector materials, such as those with improved thermal conductivity and fatigue resistance. Connector testing plays a crucial role in ensuring the quality and reliability of these products. Aerospace connectors, for instance, undergo rigorous testing to meet stringent performance requirements. The industry as a whole is expected to grow at a steady pace, with a projected annual growth rate of 5% over the next decade. In the realm of manufacturing, there is a growing emphasis on automation and lean production processes to improve efficiency and reduce costs.
  • This trend is particularly evident in the production of industrial connectors and wire harnessing. Despite these advancements, the importance of human expertise in connector design and testing cannot be overstated. Overall, the market is a dynamic and evolving landscape, with ongoing innovations in joining methods, connector design, and manufacturing techniques driving growth and expansion.

Dive into Technavio's robust research methodology, blending expert interviews, extensive data synthesis, and validated models for unparalleled Mechanical Connectors Market insights. See full methodology.

Market Scope

Report Coverage

Details

Page number

231

Base year

2024

Historic period

2019-2023

Forecast period

2025-2029

Growth momentum & CAGR

Accelerate at a CAGR of 5.5%

Market growth 2025-2029

USD 4886.6 million

Market structure

Fragmented

YoY growth 2024-2025(%)

5.3

Key countries

US, China, Japan, Germany, India, Brazil, UK, France, Italy, and South Korea

Competitive landscape

Leading Companies, Market Positioning of Companies, Competitive Strategies, and Industry Risks

Request Free Sample

What are the Key Data Covered in this Mechanical Connectors Market Research and Growth Report?

  • CAGR of the Mechanical Connectors industry during the forecast period
  • Detailed information on factors that will drive the growth and forecasting between 2025 and 2029
  • Precise estimation of the size of the market and its contribution of the industry in focus to the parent market
  • Accurate predictions about upcoming growth and trends and changes in consumer behaviour
  • Growth of the market across APAC, Europe, North America, South America, and Middle East and Africa
  • Thorough analysis of the market's competitive landscape and detailed information about companies
  • Comprehensive analysis of factors that will challenge the mechanical connectors market growth of industry companies

We can help! Our analysts can customize this mechanical connectors market research report to meet your requirements.

Get in touch

1 Executive Summary

  • 1.1 Market overview
    • Executive Summary - Chart on Market Overview
    • Executive Summary - Data Table on Market Overview
    • Executive Summary - Chart on Global Market Characteristics
    • Executive Summary - Chart on Market by Geography
    • Executive Summary - Chart on Market Segmentation by Type
    • Executive Summary - Chart on Market Segmentation by Application
    • Executive Summary - Chart on Market Segmentation by Product
    • Executive Summary - Chart on Incremental Growth
    • Executive Summary - Data Table on Incremental Growth
    • Executive Summary - Chart on Company Market Positioning

2 Technavio Analysis

  • 2.1 Analysis of price sensitivity, lifecycle, customer purchase basket, adoption rates, and purchase criteria
    • Analysis of price sensitivity, lifecycle, customer purchase basket, adoption rates, and purchase criteria
  • 2.2 Criticality of inputs and Factors of differentiation
    • Overview on criticality of inputs and factors of differentiation
  • 2.3 Factors of disruption
    • Overview on factors of disruption
  • 2.4 Impact of drivers and challenges
    • Impact of drivers and challenges in 2024 and 2029

3 Market Landscape

  • 3.1 Market ecosystem
    • Parent Market
    • Data Table on - Parent Market
  • 3.2 Market characteristics
    • Market characteristics analysis
  • 3.3 Value chain analysis
    • Value chain analysis

4 Market Sizing

  • 4.1 Market definition
    • Offerings of companies included in the market definition
  • 4.2 Market segment analysis
    • Market segments
  • 4.3 Market size 2024
    • 4.4 Market outlook: Forecast for 2024-2029
      • Chart on Global - Market size and forecast 2024-2029 ($ million)
      • Data Table on Global - Market size and forecast 2024-2029 ($ million)
      • Chart on Global Market: Year-over-year growth 2024-2029 (%)
      • Data Table on Global Market: Year-over-year growth 2024-2029 (%)

    5 Historic Market Size

    • 5.1 Global Mechanical Connectors Market 2019 - 2023
      • Historic Market Size - Data Table on Global Mechanical Connectors Market 2019 - 2023 ($ million)
    • 5.2 Type segment analysis 2019 - 2023
      • Historic Market Size - Type Segment 2019 - 2023 ($ million)
    • 5.3 Application segment analysis 2019 - 2023
      • Historic Market Size - Application Segment 2019 - 2023 ($ million)
    • 5.4 Product segment analysis 2019 - 2023
      • Historic Market Size - Product Segment 2019 - 2023 ($ million)
    • 5.5 Geography segment analysis 2019 - 2023
      • Historic Market Size - Geography Segment 2019 - 2023 ($ million)
    • 5.6 Country segment analysis 2019 - 2023
      • Historic Market Size - Country Segment 2019 - 2023 ($ million)

    6 Qualitative Analysis

    • 6.1 Impact of AI on the Global Mechanical Connectors Market

      7 Five Forces Analysis

      • 7.1 Five forces summary
        • Five forces analysis - Comparison between 2024 and 2029
      • 7.2 Bargaining power of buyers
        • Bargaining power of buyers - Impact of key factors 2024 and 2029
      • 7.3 Bargaining power of suppliers
        • Bargaining power of suppliers - Impact of key factors in 2024 and 2029
      • 7.4 Threat of new entrants
        • Threat of new entrants - Impact of key factors in 2024 and 2029
      • 7.5 Threat of substitutes
        • Threat of substitutes - Impact of key factors in 2024 and 2029
      • 7.6 Threat of rivalry
        • Threat of rivalry - Impact of key factors in 2024 and 2029
      • 7.7 Market condition
        • Chart on Market condition - Five forces 2024 and 2029

      8 Market Segmentation by Type

      • 8.1 Market segments
        • Chart on Type - Market share 2024-2029 (%)
        • Data Table on Type - Market share 2024-2029 (%)
      • 8.2 Comparison by Type
        • Chart on Comparison by Type
        • Data Table on Comparison by Type
      • 8.3 Aluminum - Market size and forecast 2024-2029
        • Chart on Aluminum - Market size and forecast 2024-2029 ($ million)
        • Data Table on Aluminum - Market size and forecast 2024-2029 ($ million)
        • Chart on Aluminum - Year-over-year growth 2024-2029 (%)
        • Data Table on Aluminum - Year-over-year growth 2024-2029 (%)
      • 8.4 Copper - Market size and forecast 2024-2029
        • Chart on Copper - Market size and forecast 2024-2029 ($ million)
        • Data Table on Copper - Market size and forecast 2024-2029 ($ million)
        • Chart on Copper - Year-over-year growth 2024-2029 (%)
        • Data Table on Copper - Year-over-year growth 2024-2029 (%)
      • 8.5 Brass - Market size and forecast 2024-2029
        • Chart on Brass - Market size and forecast 2024-2029 ($ million)
        • Data Table on Brass - Market size and forecast 2024-2029 ($ million)
        • Chart on Brass - Year-over-year growth 2024-2029 (%)
        • Data Table on Brass - Year-over-year growth 2024-2029 (%)
      • 8.6 Others - Market size and forecast 2024-2029
        • Chart on Others - Market size and forecast 2024-2029 ($ million)
        • Data Table on Others - Market size and forecast 2024-2029 ($ million)
        • Chart on Others - Year-over-year growth 2024-2029 (%)
        • Data Table on Others - Year-over-year growth 2024-2029 (%)
      • 8.7 Market opportunity by Type
        • Market opportunity by Type ($ million)
        • Data Table on Market opportunity by Type ($ million)

      9 Market Segmentation by Application

      • 9.1 Market segments
        • Chart on Application - Market share 2024-2029 (%)
        • Data Table on Application - Market share 2024-2029 (%)
      • 9.2 Comparison by Application
        • Chart on Comparison by Application
        • Data Table on Comparison by Application
      • 9.3 Automotive - Market size and forecast 2024-2029
        • Chart on Automotive - Market size and forecast 2024-2029 ($ million)
        • Data Table on Automotive - Market size and forecast 2024-2029 ($ million)
        • Chart on Automotive - Year-over-year growth 2024-2029 (%)
        • Data Table on Automotive - Year-over-year growth 2024-2029 (%)
      • 9.4 Industrial - Market size and forecast 2024-2029
        • Chart on Industrial - Market size and forecast 2024-2029 ($ million)
        • Data Table on Industrial - Market size and forecast 2024-2029 ($ million)
        • Chart on Industrial - Year-over-year growth 2024-2029 (%)
        • Data Table on Industrial - Year-over-year growth 2024-2029 (%)
      • 9.5 Aerospace and defense - Market size and forecast 2024-2029
        • Chart on Aerospace and defense - Market size and forecast 2024-2029 ($ million)
        • Data Table on Aerospace and defense - Market size and forecast 2024-2029 ($ million)
        • Chart on Aerospace and defense - Year-over-year growth 2024-2029 (%)
        • Data Table on Aerospace and defense - Year-over-year growth 2024-2029 (%)
      • 9.6 Others - Market size and forecast 2024-2029
        • Chart on Others - Market size and forecast 2024-2029 ($ million)
        • Data Table on Others - Market size and forecast 2024-2029 ($ million)
        • Chart on Others - Year-over-year growth 2024-2029 (%)
        • Data Table on Others - Year-over-year growth 2024-2029 (%)
      • 9.7 Market opportunity by Application
        • Market opportunity by Application ($ million)
        • Data Table on Market opportunity by Application ($ million)

      10 Market Segmentation by Product

      • 10.1 Market segments
        • Chart on Product - Market share 2024-2029 (%)
        • Data Table on Product - Market share 2024-2029 (%)
      • 10.2 Comparison by Product
        • Chart on Comparison by Product
        • Data Table on Comparison by Product
      • 10.3 Crimp connectors - Market size and forecast 2024-2029
        • Chart on Crimp connectors - Market size and forecast 2024-2029 ($ million)
        • Data Table on Crimp connectors - Market size and forecast 2024-2029 ($ million)
        • Chart on Crimp connectors - Year-over-year growth 2024-2029 (%)
        • Data Table on Crimp connectors - Year-over-year growth 2024-2029 (%)
      • 10.4 Terminal connectors - Market size and forecast 2024-2029
        • Chart on Terminal connectors - Market size and forecast 2024-2029 ($ million)
        • Data Table on Terminal connectors - Market size and forecast 2024-2029 ($ million)
        • Chart on Terminal connectors - Year-over-year growth 2024-2029 (%)
        • Data Table on Terminal connectors - Year-over-year growth 2024-2029 (%)
      • 10.5 Butt connectors - Market size and forecast 2024-2029
        • Chart on Butt connectors - Market size and forecast 2024-2029 ($ million)
        • Data Table on Butt connectors - Market size and forecast 2024-2029 ($ million)
        • Chart on Butt connectors - Year-over-year growth 2024-2029 (%)
        • Data Table on Butt connectors - Year-over-year growth 2024-2029 (%)
      • 10.6 Splice connectors - Market size and forecast 2024-2029
        • Chart on Splice connectors - Market size and forecast 2024-2029 ($ million)
        • Data Table on Splice connectors - Market size and forecast 2024-2029 ($ million)
        • Chart on Splice connectors - Year-over-year growth 2024-2029 (%)
        • Data Table on Splice connectors - Year-over-year growth 2024-2029 (%)
      • 10.7 Market opportunity by Product
        • Market opportunity by Product ($ million)
        • Data Table on Market opportunity by Product ($ million)

      11 Customer Landscape

      • 11.1 Customer landscape overview
        • Analysis of price sensitivity, lifecycle, customer purchase basket, adoption rates, and purchase criteria

      12 Geographic Landscape

      • 12.1 Geographic segmentation
        • Chart on Market share by geography 2024-2029 (%)
        • Data Table on Market share by geography 2024-2029 (%)
      • 12.2 Geographic comparison
        • Chart on Geographic comparison
        • Data Table on Geographic comparison
      • 12.3 APAC - Market size and forecast 2024-2029
        • Chart on APAC - Market size and forecast 2024-2029 ($ million)
        • Data Table on APAC - Market size and forecast 2024-2029 ($ million)
        • Chart on APAC - Year-over-year growth 2024-2029 (%)
        • Data Table on APAC - Year-over-year growth 2024-2029 (%)
      • 12.4 Europe - Market size and forecast 2024-2029
        • Chart on Europe - Market size and forecast 2024-2029 ($ million)
        • Data Table on Europe - Market size and forecast 2024-2029 ($ million)
        • Chart on Europe - Year-over-year growth 2024-2029 (%)
        • Data Table on Europe - Year-over-year growth 2024-2029 (%)
      • 12.5 North America - Market size and forecast 2024-2029
        • Chart on North America - Market size and forecast 2024-2029 ($ million)
        • Data Table on North America - Market size and forecast 2024-2029 ($ million)
        • Chart on North America - Year-over-year growth 2024-2029 (%)
        • Data Table on North America - Year-over-year growth 2024-2029 (%)
      • 12.6 South America - Market size and forecast 2024-2029
        • Chart on South America - Market size and forecast 2024-2029 ($ million)
        • Data Table on South America - Market size and forecast 2024-2029 ($ million)
        • Chart on South America - Year-over-year growth 2024-2029 (%)
        • Data Table on South America - Year-over-year growth 2024-2029 (%)
      • 12.7 Middle East and Africa - Market size and forecast 2024-2029
        • Chart on Middle East and Africa - Market size and forecast 2024-2029 ($ million)
        • Data Table on Middle East and Africa - Market size and forecast 2024-2029 ($ million)
        • Chart on Middle East and Africa - Year-over-year growth 2024-2029 (%)
        • Data Table on Middle East and Africa - Year-over-year growth 2024-2029 (%)
      • 12.8 US - Market size and forecast 2024-2029
        • Chart on US - Market size and forecast 2024-2029 ($ million)
        • Data Table on US - Market size and forecast 2024-2029 ($ million)
        • Chart on US - Year-over-year growth 2024-2029 (%)
        • Data Table on US - Year-over-year growth 2024-2029 (%)
      • 12.9 China - Market size and forecast 2024-2029
        • Chart on China - Market size and forecast 2024-2029 ($ million)
        • Data Table on China - Market size and forecast 2024-2029 ($ million)
        • Chart on China - Year-over-year growth 2024-2029 (%)
        • Data Table on China - Year-over-year growth 2024-2029 (%)
      • 12.10 Japan - Market size and forecast 2024-2029
        • Chart on Japan - Market size and forecast 2024-2029 ($ million)
        • Data Table on Japan - Market size and forecast 2024-2029 ($ million)
        • Chart on Japan - Year-over-year growth 2024-2029 (%)
        • Data Table on Japan - Year-over-year growth 2024-2029 (%)
      • 12.11 Germany - Market size and forecast 2024-2029
        • Chart on Germany - Market size and forecast 2024-2029 ($ million)
        • Data Table on Germany - Market size and forecast 2024-2029 ($ million)
        • Chart on Germany - Year-over-year growth 2024-2029 (%)
        • Data Table on Germany - Year-over-year growth 2024-2029 (%)
      • 12.12 India - Market size and forecast 2024-2029
        • Chart on India - Market size and forecast 2024-2029 ($ million)
        • Data Table on India - Market size and forecast 2024-2029 ($ million)
        • Chart on India - Year-over-year growth 2024-2029 (%)
        • Data Table on India - Year-over-year growth 2024-2029 (%)
      • 12.13 UK - Market size and forecast 2024-2029
        • Chart on UK - Market size and forecast 2024-2029 ($ million)
        • Data Table on UK - Market size and forecast 2024-2029 ($ million)
        • Chart on UK - Year-over-year growth 2024-2029 (%)
        • Data Table on UK - Year-over-year growth 2024-2029 (%)
      • 12.14 Brazil - Market size and forecast 2024-2029
        • Chart on Brazil - Market size and forecast 2024-2029 ($ million)
        • Data Table on Brazil - Market size and forecast 2024-2029 ($ million)
        • Chart on Brazil - Year-over-year growth 2024-2029 (%)
        • Data Table on Brazil - Year-over-year growth 2024-2029 (%)
      • 12.15 France - Market size and forecast 2024-2029
        • Chart on France - Market size and forecast 2024-2029 ($ million)
        • Data Table on France - Market size and forecast 2024-2029 ($ million)
        • Chart on France - Year-over-year growth 2024-2029 (%)
        • Data Table on France - Year-over-year growth 2024-2029 (%)
      • 12.16 Italy - Market size and forecast 2024-2029
        • Chart on Italy - Market size and forecast 2024-2029 ($ million)
        • Data Table on Italy - Market size and forecast 2024-2029 ($ million)
        • Chart on Italy - Year-over-year growth 2024-2029 (%)
        • Data Table on Italy - Year-over-year growth 2024-2029 (%)
      • 12.17 South Korea - Market size and forecast 2024-2029
        • Chart on South Korea - Market size and forecast 2024-2029 ($ million)
        • Data Table on South Korea - Market size and forecast 2024-2029 ($ million)
        • Chart on South Korea - Year-over-year growth 2024-2029 (%)
        • Data Table on South Korea - Year-over-year growth 2024-2029 (%)
      • 12.18 Market opportunity by geography
        • Market opportunity by geography ($ million)
        • Data Tables on Market opportunity by geography ($ million)

      13 Drivers, Challenges, and Opportunity/Restraints

      • 13.1 Market drivers
        • 13.2 Market challenges
          • 13.3 Impact of drivers and challenges
            • Impact of drivers and challenges in 2024 and 2029
          • 13.4 Market opportunities/restraints

            14 Competitive Landscape

            • 14.1 Overview
              • 14.2 Competitive Landscape
                • Overview on criticality of inputs and factors of differentiation
              • 14.3 Landscape disruption
                • Overview on factors of disruption
              • 14.4 Industry risks
                • Impact of key risks on business

              15 Competitive Analysis

              • 15.1 Companies profiled
                • Companies covered
              • 15.2 Company ranking index
                • Company ranking index
              • 15.3 Market positioning of companies
                • Matrix on companies position and classification
              • 3M Co.
                • 3M Co. - Overview
                • 3M Co. - Business segments
                • 3M Co. - Key news
                • 3M Co. - Key offerings
                • 3M Co. - Segment focus
                • SWOT
              • 15.5 ABB Ltd.
                • ABB Ltd. - Overview
                • ABB Ltd. - Business segments
                • ABB Ltd. - Key news
                • ABB Ltd. - Key offerings
                • ABB Ltd. - Segment focus
                • SWOT
              • 15.6 Axis Electrical Components India Pvt. Ltd.
                • Axis Electrical Components India Pvt. Ltd. - Overview
                • Axis Electrical Components India Pvt. Ltd. - Product / Service
                • Axis Electrical Components India Pvt. Ltd. - Key offerings
                • SWOT
              • 15.7 Birkett Electric Ltd.
                • Birkett Electric Ltd. - Overview
                • Birkett Electric Ltd. - Product / Service
                • Birkett Electric Ltd. - Key offerings
                • SWOT
              • 15.8 Componect AG
                • Componect AG - Overview
                • Componect AG - Product / Service
                • Componect AG - Key offerings
                • SWOT
              • 15.9 HellermannTyton GmbH
                • HellermannTyton GmbH - Overview
                • HellermannTyton GmbH - Product / Service
                • HellermannTyton GmbH - Key offerings
                • SWOT
              • 15.10 Hubbell Inc.
                • Hubbell Inc. - Overview
                • Hubbell Inc. - Business segments
                • Hubbell Inc. - Key news
                • Hubbell Inc. - Key offerings
                • Hubbell Inc. - Segment focus
                • SWOT
              • 15.11 Nexans SA
                • Nexans SA - Overview
                • Nexans SA - Business segments
                • Nexans SA - Key news
                • Nexans SA - Key offerings
                • Nexans SA - Segment focus
                • SWOT
              • 15.12 NSI Industries LLC
                • NSI Industries LLC - Overview
                • NSI Industries LLC - Product / Service
                • NSI Industries LLC - Key offerings
                • SWOT
              • 15.13 Panduit Corp.
                • Panduit Corp. - Overview
                • Panduit Corp. - Product / Service
                • Panduit Corp. - Key offerings
                • SWOT
              • 15.14 Prysmian SpA
                • Prysmian SpA - Overview
                • Prysmian SpA - Business segments
                • Prysmian SpA - Key news
                • Prysmian SpA - Key offerings
                • Prysmian SpA - Segment focus
                • SWOT
              • 15.15 Raychem RPG Pvt. Ltd.
                • Raychem RPG Pvt. Ltd. - Overview
                • Raychem RPG Pvt. Ltd. - Product / Service
                • Raychem RPG Pvt. Ltd. - Key offerings
                • SWOT
              • 15.16 STATS Group
                • STATS Group - Overview
                • STATS Group - Product / Service
                • STATS Group - Key offerings
                • SWOT
              • 15.17 TE Connectivity Ltd.
                • TE Connectivity Ltd. - Overview
                • TE Connectivity Ltd. - Business segments
                • TE Connectivity Ltd. - Key news
                • TE Connectivity Ltd. - Key offerings
                • TE Connectivity Ltd. - Segment focus
                • SWOT
              • 15.18 Tempo Communications Inc.
                • Tempo Communications Inc. - Overview
                • Tempo Communications Inc. - Product / Service
                • Tempo Communications Inc. - Key offerings
                • SWOT

              16 Appendix

              • 16.1 Scope of the report
                • 16.2 Inclusions and exclusions checklist
                  • Inclusions checklist
                  • Exclusions checklist
                • 16.3 Currency conversion rates for US$
                  • Currency conversion rates for US$
                • 16.4 Research methodology
                  • Research methodology
                • 16.5 Data procurement
                  • Information sources
                • 16.6 Data validation
                  • Data validation
                • 16.7 Validation techniques employed for market sizing
                  • Validation techniques employed for market sizing
                • 16.8 Data synthesis
                  • Data synthesis
                • 16.9 360 degree market analysis
                  • 360 degree market analysis
                • 16.10 List of abbreviations
                  • List of abbreviations

                Research Methodology

                Technavio presents a detailed picture of the market by way of study, synthesis, and summation of data from multiple sources. The analysts have presented the various facets of the market with a particular focus on identifying the key industry influencers. The data thus presented is comprehensive, reliable, and the result of extensive research, both primary and secondary.

                INFORMATION SOURCES

                Primary sources

                • Manufacturers and suppliers
                • Channel partners
                • Industry experts
                • Strategic decision makers

                Secondary sources

                • Industry journals and periodicals
                • Government data
                • Financial reports of key industry players
                • Historical data
                • Press releases

                DATA ANALYSIS

                Data Synthesis

                • Collation of data
                • Estimation of key figures
                • Analysis of derived insights

                Data Validation

                • Triangulation with data models
                • Reference against proprietary databases
                • Corroboration with industry experts

                REPORT WRITING

                Qualitative

                • Market drivers
                • Market challenges
                • Market trends
                • Five forces analysis

                Quantitative

                • Market size and forecast
                • Market segmentation
                • Geographical insights
                • Competitive landscape

                Interested in this report?

                Get your sample now to see our research methodology and insights!

                Download Now

                Frequently Asked Questions

                Mechanical Connectors market growth will increase by $ 4886.6 mn during 2025-2029.

                The Mechanical Connectors market is expected to grow at a CAGR of 5.5% during 2025-2029.

                Mechanical Connectors market is segmented by Type( Aluminum, Copper, Brass, Others) Application( Automotive, Industrial, Aerospace and defense, Others) Product( Crimp connectors, Terminal connectors, Butt connectors, Splice connectors, Middle East and Africa)

                3M Co., ABB Ltd., Axis Electrical Components India Pvt. Ltd., Birkett Electric Ltd., Componect AG, Conex Metals, Connector Subsea Solutions, Conway, Electrofocus Electricals, HellermannTyton GmbH, Hirpara Metal Industries, Hubbell Inc., Nexans SA, NILED, NSI Industries LLC, Panduit Corp., Prysmian SpA, Raychem RPG Pvt. Ltd., STATS Group, TE Connectivity Ltd., Tempo Communications Inc. are a few of the key vendors in the Mechanical Connectors market.

                APAC will register the highest growth rate of 39% among the other regions. Therefore, the Mechanical Connectors market in APAC is expected to garner significant business opportunities for the vendors during the forecast period.

                US, China, Japan, Germany, India, Brazil, UK, France, Italy, South Korea

                • Increasing demand for mechanical connectors in automotive industryThe global mechanical connectors market is expected to grow at a steady rate owing to its high demand from the automotive industry. The demand for mechanical connectors has increased with the growing demand for vehicles. Mechanical connector products are predominantly used in the manufacturing of automobile parts and components such as vehicle bodies is the driving factor this market.
                • chassis is the driving factor this market.
                • and heat exchangers.Increasing economic activities in emerging countries and rising foreign investments have led to a rise in per capita income in countries such as India is the driving factor this market.
                • Brazil is the driving factor this market.
                • and Argentina. Steady economic expansion in emerging countries has increased the purchasing power of consumers is the driving factor this market.
                • which has broadened the consumer expenses bracket with the capacity to purchase cars. This will is the driving factor this market.
                • consequently is the driving factor this market.
                • drive the growth of the automotive industry during the forecast period.Mechanical connectors are primarily used connecting wires is the driving factor this market.
                • cables is the driving factor this market.
                • and harnesses is the driving factor this market.
                • ensuring a secure and reliable electrical connection between various components such as batteries and alternators. Therefore is the driving factor this market.
                • the flourishing automotive industry is likely to propel the growth of the global mechanical connectors market during the forecast period. is the driving factor this market.

                The Mechanical Connectors market vendors should focus on grabbing business opportunities from the Aluminum segment as it accounted for the largest market share in the base year.