Massage Equipment Market Analysis, Size, and Forecast 2026-2030: North America (US, Canada, and Mexico), Europe (Germany, UK, and France), APAC (China, India, and Japan), South America (Brazil, Argentina, and Colombia), Middle East and Africa (Saudi Arabia, UAE, and South Africa), and Rest of World (ROW)

Massage Equipment Market Analysis, Size, and Forecast 2026-2030:
North America (US, Canada, and Mexico), Europe (Germany, UK, and France), APAC (China, India, and Japan), South America (Brazil, Argentina, and Colombia), Middle East and Africa (Saudi Arabia, UAE, and South Africa), and Rest of World (ROW)

Published: Jan 2026 293 Pages SKU: IRTNTR45523

Market Overview at a Glance

$26.66 B
Market Opportunity
12%
CAGR 2025 - 2030
36.4%
North America Growth
$8.93 B
Massage chairs and sofas segment 2024

Massage Equipment Market Size 2026-2030

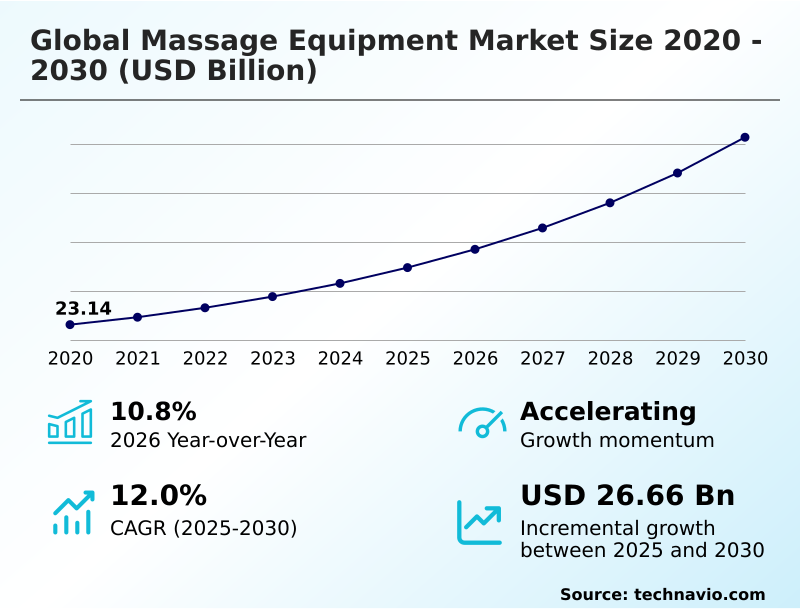
The massage equipment market size is valued to increase by USD 26.66 billion, at a CAGR of 12% from 2025 to 2030. Rising prevalence of stress and work-related musculoskeletal disorders will drive the massage equipment market.

Major Market Trends & Insights

  • North America dominated the market and accounted for a 36.4% growth during the forecast period.
  • By Product - Massage chairs and sofas segment was valued at USD 8.93 billion in 2024
  • By End-user - Commercial segment accounted for the largest market revenue share in 2024

Market Size & Forecast

  • Market Opportunities: USD 38.33 billion
  • Market Future Opportunities: USD 26.66 billion
  • CAGR from 2025 to 2030 : 12%

Market Summary

  • The massage equipment market is undergoing a significant transformation, driven by a consumer shift toward preventative healthcare and at-home wellness. Devices are evolving from simple mechanical tools to sophisticated systems featuring AI-driven massage and IoT-enabled wellness capabilities. This technological integration allows for a highly personalized wellness experience, with features like real-time body scanning and user-specific massage profiles becoming increasingly standard.
  • A key business scenario involves corporate wellness programs procuring these devices to combat employee burnout, viewing the investment in ergonomic recovery tools and stress reduction technology as a direct contribution to productivity and talent retention. While high-end systems represent a considerable investment, the proliferation of affordable, portable massagers and myofascial release tools is expanding the market's reach.
  • The industry is also contending with the need for non-invasive pain management solutions for an aging population, pushing innovation in areas like circulation improvement technology and sports medicine equipment. This creates a dynamic environment where success depends on balancing technological sophistication with accessibility and demonstrating tangible health outcomes.

What will be the Size of the Massage Equipment Market during the forecast period?

Get Key Insights on Market Forecast (PDF) Request Free Sample

How is the Massage Equipment Market Segmented?

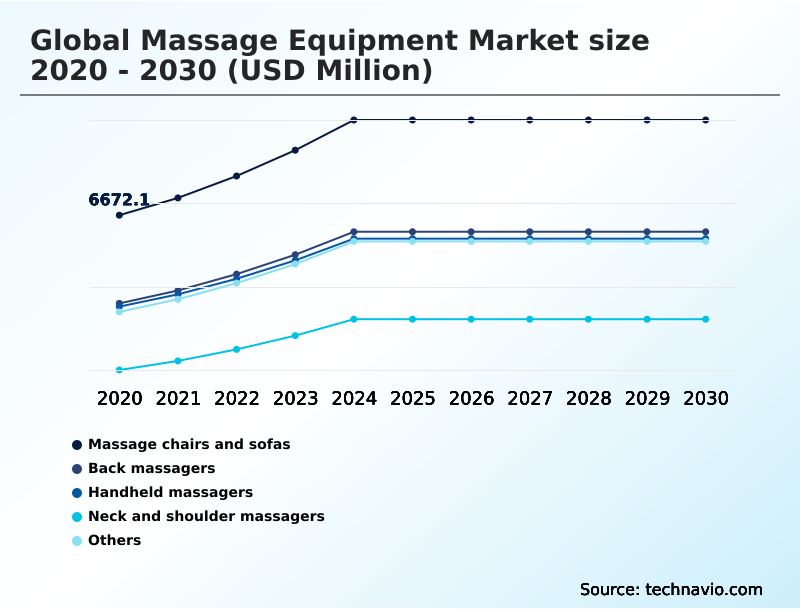
The massage equipment industry research report provides comprehensive data (region-wise segment analysis), with forecasts and estimates in "USD million" for the period 2026-2030, as well as historical data from 2020-2024 for the following segments.

  • Product
    • Massage chairs and sofas
    • Back massagers
    • Handheld massagers
    • Neck and shoulder massagers
    • Others
  • End-user
    • Commercial
    • Residential
  • Type
    • Electric massage equipment
    • Non-electric massage equipment
  • Geography
    • North America
      • US
      • Canada
      • Mexico
    • Europe
      • Germany
      • UK
      • France
    • APAC
      • China
      • India
      • Japan
    • South America
      • Brazil
      • Argentina
      • Colombia
    • Middle East and Africa
      • Saudi Arabia
      • UAE
      • South Africa
    • Rest of World (ROW)

By Product Insights

The massage chairs and sofas segment is estimated to witness significant growth during the forecast period.

The market is segmented by product, end-user, and geography. Massage chairs and sofas represent a significant category, characterized by rapid technological advancements. These are no longer just mechanical devices but sophisticated in-home therapeutic solutions.

The integration of zero-gravity recliners and biometric feedback sensors allows for a personalized wellness experience, mimicking professional techniques.

This focus on comprehensive home wellness is driving adoption, particularly as organizations recognize the value of preventative healthcare devices, with over 40% of leading corporations now mandating ergonomic recovery tools in their wellness budgets.

This trend highlights the shift from luxury items to essential corporate wellness programs and tools for stress reduction technology. AI-driven massage features are becoming a key differentiator in this evolving landscape.

Request Free Sample

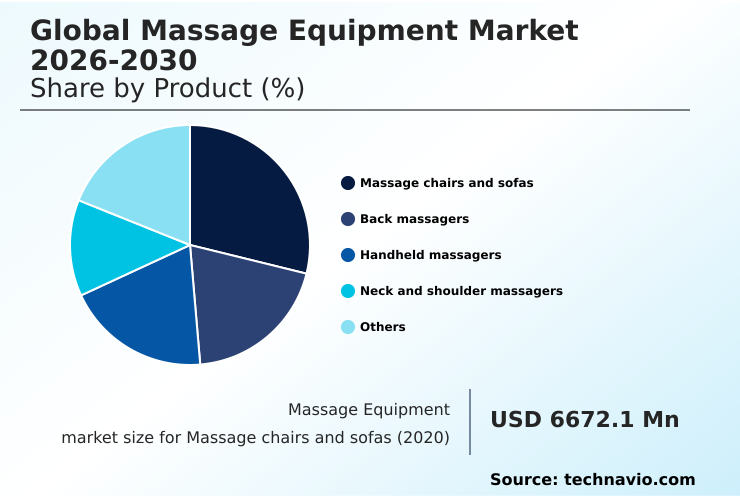
The Massage chairs and sofas segment was valued at USD 8.93 billion in 2024 and showed a gradual increase during the forecast period.

Request Free Sample

Regional Analysis

North America is estimated to contribute 36.4% to the growth of the global market during the forecast period.Technavio’s analysts have elaborately explained the regional trends and drivers that shape the market during the forecast period.

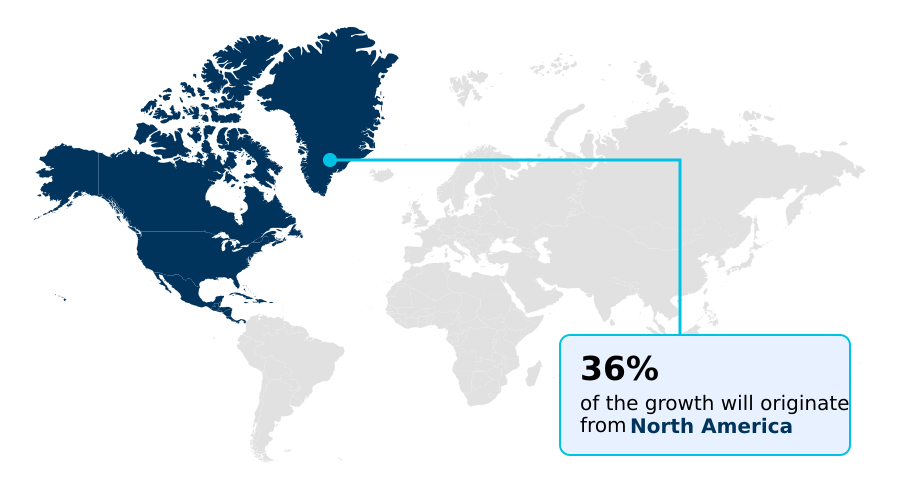
See How Massage Equipment Market Demand is Rising in North America Request Free Sample

The geographic landscape of the global massage equipment market 2026-2030 is diverse, with North America and APAC showing the most significant activity.

Firms are allocating nearly 36% of new product development resources to meet North American demand for holistic wellness solutions that address sedentary lifestyle solutions.

In APAC, the focus is on home-based elder care and luxury wellness appliances, driving a 14% regional growth rate. European markets prioritize non-invasive pain management and sports medicine equipment, aligning with stringent regulatory standards for remote firmware updates.

In the Middle East and Africa, demand is bifurcated between high-end, direct-to-consumer wellness products and basic post-workout recovery tools. South America shows growing interest in quality of life enhancement, with a focus on products supporting low-impact exercise recovery.

Market Dynamics

Our researchers analyzed the data with 2025 as the base year, along with the key drivers, trends, and challenges. A holistic analysis of drivers will help companies refine their marketing strategies to gain a competitive advantage.

  • Strategic positioning in the market increasingly depends on addressing specific consumer needs through targeted product development. Understanding the nuances between an AI massage chair for back pain and a percussive therapy gun for muscle recovery is crucial for capturing distinct market segments.
  • For instance, the demand for the best handheld massager for athletes is driven by performance optimization, while interest in a portable neck massager for travel is about convenience. The technical differences when comparing AI and non-AI massage chairs are significant, particularly in how predictive tension analysis works to deliver customized therapy.
  • Businesses must clearly articulate the benefits of lymphatic drainage massagers and the distinctions between TENS units versus percussive massagers. As consumers become more tech-savvy, integrating massage equipment with smart homes is no longer a niche feature.
  • The top features in luxury massage chairs, such as zero-gravity chair with heat therapy and smart massage chair with body scanning, set the benchmark for the premium segment. However, the total cost of ownership for massage chairs remains a key consideration for residential buyers.
  • Meanwhile, commercial applications like massage equipment for corporate wellness and medical grade massage chair benefits are expanding. Specialized products like a foot massager for circulation improvement, a full body massage mat with shiatsu, an ergonomic massage cushion for an office chair, and compression therapy for leg recovery address targeted pain points, driving incremental growth across the board.

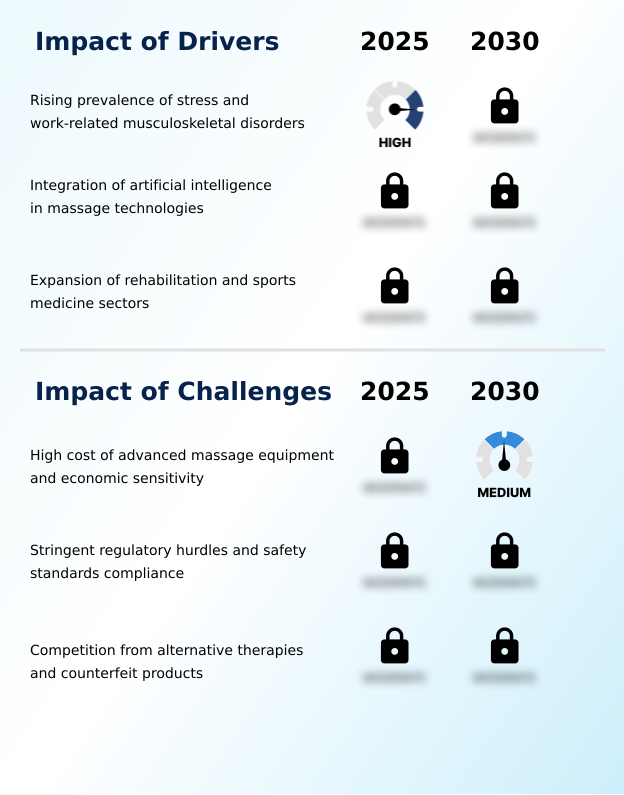
What are the key market drivers leading to the rise in the adoption of Massage Equipment Industry?

  • The rising prevalence of stress and work-related musculoskeletal disorders is a key driver fueling the growth of the massage equipment market.

  • Market expansion is significantly driven by the increasing need for in-home therapeutic solutions to manage chronic pain management and the effects of sedentary lifestyle solutions.
  • The adoption of ergonomic design principles and myofascial release tools is a direct response to rising musculoskeletal disorder aids. This has led to a 25% increase in demand from corporate wellness programs seeking to reduce employee burnout.
  • Furthermore, the market for post-operative recovery aids and sports rehabilitation tools is expanding as consumers seek alternatives to traditional medicine.
  • The focus on preventative healthcare devices and circulation improvement technology is particularly strong among the aging population, further fueling demand for accessible and effective solutions.

What are the market trends shaping the Massage Equipment Industry?

  • The integration of the Internet of Things (IoT) for personalized wellness is emerging as a significant market trend. This development is reshaping user experiences and product capabilities.

  • A key trend is the integration of advanced technology to create a hyper-personalized wellness experience. The use of air compression systems and 4D massage rollers is now enhanced by real-time body scanning and haptic feedback technology.
  • This shift toward athletic performance optimization is driving product development, with some firms reporting a 15% increase in user engagement for devices offering automated therapy sessions. As a result, IoT-enabled wellness solutions that offer customized massage intensity and integrate with connected health monitoring are becoming standard.
  • This allows for guided recovery programs that adapt to user biometrics analysis, addressing a key demand from tech-savvy consumers seeking more than just relaxation from their devices.

What challenges does the Massage Equipment Industry face during its growth?

  • The high cost of advanced massage equipment, coupled with economic sensitivity, poses a significant challenge to industry growth.

  • A primary market challenge is the competition from alternative therapy integration and the high cost of advanced reflexology foot massagers and cervical traction devices. While automated massage therapy offers convenience, many consumers still prefer manual treatments, impacting adoption rates by up to 20% in certain demographics.
  • Furthermore, ensuring compliance for lymphatic drainage devices and lumbar support massagers across different regions creates significant overhead, increasing time-to-market by an average of six months. The market must also contend with the need for sophisticated user-specific massage profiles and remote work ergonomics solutions, which require substantial R&D investment that is difficult to justify in price-sensitive segments.

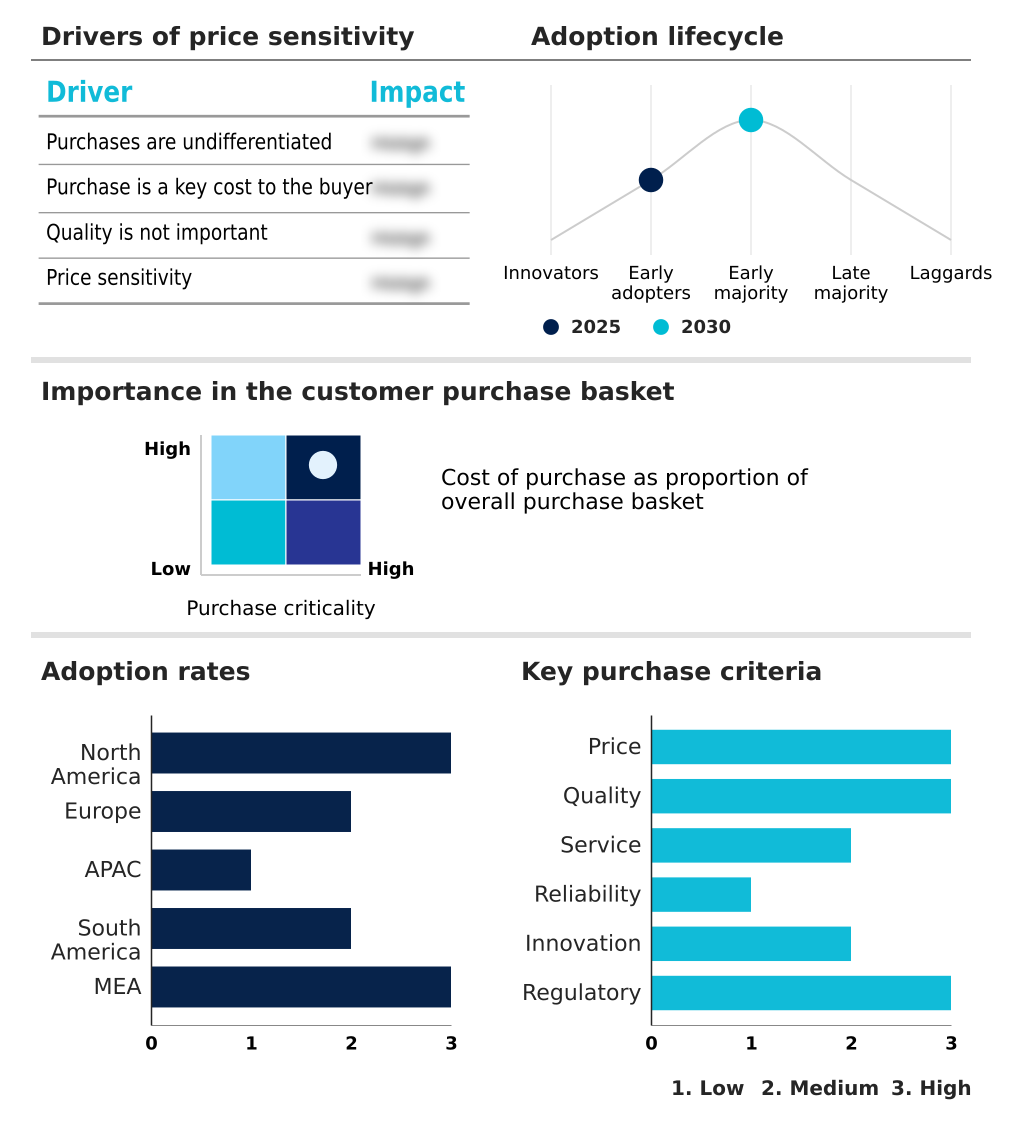
Exclusive Technavio Analysis on Customer Landscape

The massage equipment market forecasting report includes the adoption lifecycle of the market, covering from the innovator’s stage to the laggard’s stage. It focuses on adoption rates in different regions based on penetration. Furthermore, the massage equipment market report also includes key purchase criteria and drivers of price sensitivity to help companies evaluate and develop their market growth analysis strategies.

Customer Landscape of Massage Equipment Industry

Competitive Landscape

Companies are implementing various strategies, such as strategic alliances, massage equipment market forecast, partnerships, mergers and acquisitions, geographical expansion, and product/service launches, to enhance their presence in the industry.

Beurer GmbH - The company provides a range of solutions for personal care, including heated massaging seat cushions, footbaths, and other wellness devices.

The industry research and growth report includes detailed analyses of the competitive landscape of the market and information about key companies, including:

  • Beurer GmbH
  • Bodyfriend Inc.
  • Casada International GmbH
  • Conair Corp.
  • Family Inada Co. Ltd.
  • Fujita Massage Chair
  • Homedics USA
  • Human Touch LLC
  • Luraco Technologies
  • OMRON Corp.
  • OSIM International Pte. Ltd.
  • Panasonic Holdings Corp.
  • Prospera Corp.
  • Relaxonchair
  • RoboTouch
  • Thumper Massager Inc.
  • Wahl Clipper Corp.
  • WelbuTech Co. Ltd.
  • Xiaomi Inc.

Qualitative and quantitative analysis of companies has been conducted to help clients understand the wider business environment as well as the strengths and weaknesses of key industry players. Data is qualitatively analyzed to categorize companies as pure play, category-focused, industry-focused, and diversified; it is quantitatively analyzed to categorize companies as dominant, leading, strong, tentative, and weak.

Recent Development and News in Massage equipment market

  • In February 2025, Ogawa Smart Healthcare Technology announced the launch of a new flagship massage chair featuring advanced biometric feedback sensors designed to adjust massage intensity in real-time based on the user's muscle tension levels.
  • In March 2025, Human Touch LLC announced the launch of a new biometric-sensing massage chair capable of adapting pressure intensity based on user muscle tension data, marking a significant advancement in personalized home therapy.
  • In April 2025, Ogawa World Berhad announced a new line of smart massage chairs featuring predictive tension analysis, representing a significant advancement in automated and personalized care.
  • In April 2025, Therabody introduced a breakthrough in battery efficiency for its commercial line, extending the operational life of its high-powered percussive therapy devices by forty percent.

Dive into Technavio’s robust research methodology, blending expert interviews, extensive data synthesis, and validated models for unparalleled Massage Equipment Market insights. See full methodology.

Market Scope
Page number 293
Base year 2025
Historic period 2020-2024
Forecast period 2026-2030
Growth momentum & CAGR Accelerate at a CAGR of 12%
Market growth 2026-2030 USD 26659.7 million
Market structure Fragmented
YoY growth 2025-2026(%) 10.8%
Key countries US, Canada, Mexico, Germany, UK, France, Italy, The Netherlands, Spain, China, India, Japan, South Korea, Australia, Indonesia, Brazil, Argentina, Colombia, Saudi Arabia, UAE, South Africa, Israel and Turkey
Competitive landscape Leading Companies, Market Positioning of Companies, Competitive Strategies, and Industry Risks

Request Free Sample

Research Analyst Overview

  • The massage equipment market is characterized by rapid technological convergence, compelling boardroom-level strategic shifts in R&D budgeting. The market’s 10.8% year-over-year expansion is not merely a sign of growth but a reflection of a fundamental change in consumer behavior toward proactive health management. The integration of AI-driven massage and IoT-enabled wellness into devices is now a primary focus.
  • Advanced therapeutic massage equipment utilizes technologies like transcutaneous electrical nerve stimulation (TENS) and electrical muscle stimulation (EMS) alongside mechanical systems such as 4D massage rollers and air compression systems. Innovations in percussive therapy devices and cordless handheld massagers are making muscle recovery tools more accessible.
  • High-end zero-gravity recliners now incorporate biometric feedback sensors for real-time body scanning and predictive tension analysis, creating user-specific massage profiles. This move toward holistic wellness solutions is supported by features like infrared heat therapy, voice command integration, and haptic feedback technology.
  • For decision-makers, the challenge lies in navigating the complexities of developing sports medicine equipment and non-invasive pain management solutions, including cervical traction devices and lumbar support massagers, while ensuring seamless smart home ecosystem connectivity and providing remote firmware updates.
  • The use of advanced materials like bio-based polyurethane upholstery and the development of energy-efficient motors are also becoming critical differentiators for post-workout recovery and reflexology foot massagers.

What are the Key Data Covered in this Massage Equipment Market Research and Growth Report?

  • What is the expected growth of the Massage Equipment Market between 2026 and 2030?

    • USD 26.66 billion, at a CAGR of 12%

  • What segmentation does the market report cover?

    • The report is segmented by Product (Massage chairs and sofas, Back massagers, Handheld massagers, Neck and shoulder massagers, and Others), End-user (Commercial, and Residential), Type (Electric massage equipment, and Non-electric massage equipment) and Geography (North America, Europe, APAC, South America, Middle East and Africa)

  • Which regions are analyzed in the report?

    • North America, Europe, APAC, South America and Middle East and Africa

  • What are the key growth drivers and market challenges?

    • Rising prevalence of stress and work-related musculoskeletal disorders, High cost of advanced massage equipment and economic sensitivity

  • Who are the major players in the Massage Equipment Market?

    • Beurer GmbH, Bodyfriend Inc., Casada International GmbH, Conair Corp., Family Inada Co. Ltd., Fujita Massage Chair, Homedics USA, Human Touch LLC, Luraco Technologies, OMRON Corp., OSIM International Pte. Ltd., Panasonic Holdings Corp., Prospera Corp., Relaxonchair, RoboTouch, Thumper Massager Inc., Wahl Clipper Corp., WelbuTech Co. Ltd. and Xiaomi Inc.

Market Research Insights

  • The market dynamics are shaped by a blend of consumer demand for a personalized wellness experience and technological advancement. Buyers show low sensitivity to quality trade-offs in lower-end segments, but price sensitivity remains a neutral factor, influencing purchasing decisions by less than 5% compared to feature availability.
  • The adoption of smart recovery devices is a key indicator, with a 15% increase in attachment rates for connected health monitoring apps. This trend toward automated therapy sessions and guided recovery programs is compelling manufacturers to invest in developing a frictionless user interface.
  • As remote work ergonomics become a priority, sales of furniture-integrated massagers are outpacing traditional models by nearly two to one in urban markets, reflecting a focus on quality of life enhancement and self-care technology.

We can help! Our analysts can customize this massage equipment market research report to meet your requirements.

Get in touch

1. Executive Summary

1.1 Market overview

Executive Summary - Chart on Market Overview
Executive Summary - Data Table on Market Overview
Executive Summary - Chart on Global Market Characteristics
Executive Summary - Chart on Market by Geography
Executive Summary - Chart on Market Segmentation by Product
Executive Summary - Chart on Market Segmentation by End-user
Executive Summary - Chart on Market Segmentation by Type
Executive Summary - Chart on Incremental Growth
Executive Summary - Data Table on Incremental Growth
Executive Summary - Chart on Company Market Positioning

2. Technavio Analysis

2.1 Analysis of price sensitivity, lifecycle, customer purchase basket, adoption rates, and purchase criteria

2.2 Criticality of inputs and Factors of differentiation

Chart on Overview on criticality of inputs and factors of differentiation

2.3 Factors of disruption

Chart on Overview on factors of disruption

2.4 Impact of drivers and challenges

Chart on Impact of drivers and challenges in 2025 and 2030

3. Market Landscape

3.1 Market ecosystem

Chart on Parent Market
Data Table on - Parent Market

3.2 Market characteristics

Chart on Market characteristics analysis

3.3 Value chain analysis

Chart on Value chain analysis

4. Market Sizing

4.1 Market definition

Data Table on Offerings of companies included in the market definition

4.2 Market segment analysis

Market segments

4.3 Market size 2025

4.4 Market outlook: Forecast for 2025-2030

Chart on Global - Market size and forecast 2025-2030 ($ million)
Data Table on Global - Market size and forecast 2025-2030 ($ million)
Chart on Global Market: Year-over-year growth 2025-2030 (%)
Data Table on Global Market: Year-over-year growth 2025-2030 (%)

5. Historic Market Size

5.1 Global Massage Equipment Market 2020 - 2024

Historic Market Size - Data Table on Global Massage Equipment Market 2020 - 2024 ($ million)

5.2 Product segment analysis 2020 - 2024

Historic Market Size - Product Segment 2020 - 2024 ($ million)

5.3 End-user segment analysis 2020 - 2024

Historic Market Size - End-user Segment 2020 - 2024 ($ million)

5.4 Type segment analysis 2020 - 2024

Historic Market Size - Type Segment 2020 - 2024 ($ million)

5.5 Geography segment analysis 2020 - 2024

Historic Market Size - Geography Segment 2020 - 2024 ($ million)

5.6 Country segment analysis 2020 - 2024

Historic Market Size - Country Segment 2020 - 2024 ($ million)

6. Qualitative Analysis

6.1 Impact of AI on the Global Massage Equipment Market

7. Five Forces Analysis

7.1 Five forces summary

Five forces analysis - Comparison between 2025 and 2030

7.2 Bargaining power of buyers

Bargaining power of buyers - Impact of key factors 2025 and 2030

7.3 Bargaining power of suppliers

Bargaining power of suppliers - Impact of key factors in 2025 and 2030

7.4 Threat of new entrants

Threat of new entrants - Impact of key factors in 2025 and 2030

7.5 Threat of substitutes

Threat of substitutes - Impact of key factors in 2025 and 2030

7.6 Threat of rivalry

Threat of rivalry - Impact of key factors in 2025 and 2030

7.7 Market condition

Chart on Market condition - Five forces 2025 and 2030

8. Market Segmentation by Product

8.1 Market segments

Chart on Product - Market share 2025-2030 (%)
Data Table on Product - Market share 2025-2030 (%)

8.2 Comparison by Product

Chart on Comparison by Product
Data Table on Comparison by Product

8.3 Massage chairs and sofas - Market size and forecast 2025-2030

Chart on Massage chairs and sofas - Market size and forecast 2025-2030 ($ million)
Data Table on Massage chairs and sofas - Market size and forecast 2025-2030 ($ million)
Chart on Massage chairs and sofas - Year-over-year growth 2025-2030 (%)
Data Table on Massage chairs and sofas - Year-over-year growth 2025-2030 (%)

8.4 Back massagers - Market size and forecast 2025-2030

Chart on Back massagers - Market size and forecast 2025-2030 ($ million)
Data Table on Back massagers - Market size and forecast 2025-2030 ($ million)
Chart on Back massagers - Year-over-year growth 2025-2030 (%)
Data Table on Back massagers - Year-over-year growth 2025-2030 (%)

8.5 Handheld massagers - Market size and forecast 2025-2030

Chart on Handheld massagers - Market size and forecast 2025-2030 ($ million)
Data Table on Handheld massagers - Market size and forecast 2025-2030 ($ million)
Chart on Handheld massagers - Year-over-year growth 2025-2030 (%)
Data Table on Handheld massagers - Year-over-year growth 2025-2030 (%)

8.6 Neck and shoulder massagers - Market size and forecast 2025-2030

Chart on Neck and shoulder massagers - Market size and forecast 2025-2030 ($ million)
Data Table on Neck and shoulder massagers - Market size and forecast 2025-2030 ($ million)
Chart on Neck and shoulder massagers - Year-over-year growth 2025-2030 (%)
Data Table on Neck and shoulder massagers - Year-over-year growth 2025-2030 (%)

8.7 Others - Market size and forecast 2025-2030

Chart on Others - Market size and forecast 2025-2030 ($ million)
Data Table on Others - Market size and forecast 2025-2030 ($ million)
Chart on Others - Year-over-year growth 2025-2030 (%)
Data Table on Others - Year-over-year growth 2025-2030 (%)

8.8 Market opportunity by Product

Market opportunity by Product ($ million)
Data Table on Market opportunity by Product ($ million)

9. Market Segmentation by End-user

9.1 Market segments

Chart on End-user - Market share 2025-2030 (%)
Data Table on End-user - Market share 2025-2030 (%)

9.2 Comparison by End-user

Chart on Comparison by End-user
Data Table on Comparison by End-user

9.3 Commercial - Market size and forecast 2025-2030

Chart on Commercial - Market size and forecast 2025-2030 ($ million)
Data Table on Commercial - Market size and forecast 2025-2030 ($ million)
Chart on Commercial - Year-over-year growth 2025-2030 (%)
Data Table on Commercial - Year-over-year growth 2025-2030 (%)

9.4 Residential - Market size and forecast 2025-2030

Chart on Residential - Market size and forecast 2025-2030 ($ million)
Data Table on Residential - Market size and forecast 2025-2030 ($ million)
Chart on Residential - Year-over-year growth 2025-2030 (%)
Data Table on Residential - Year-over-year growth 2025-2030 (%)

9.5 Market opportunity by End-user

Market opportunity by End-user ($ million)
Data Table on Market opportunity by End-user ($ million)

10. Market Segmentation by Type

10.1 Market segments

Chart on Type - Market share 2025-2030 (%)
Data Table on Type - Market share 2025-2030 (%)

10.2 Comparison by Type

Chart on Comparison by Type
Data Table on Comparison by Type

10.3 Electric massage equipment - Market size and forecast 2025-2030

Chart on Electric massage equipment - Market size and forecast 2025-2030 ($ million)
Data Table on Electric massage equipment - Market size and forecast 2025-2030 ($ million)
Chart on Electric massage equipment - Year-over-year growth 2025-2030 (%)
Data Table on Electric massage equipment - Year-over-year growth 2025-2030 (%)

10.4 Non-electric massage equipment - Market size and forecast 2025-2030

Chart on Non-electric massage equipment - Market size and forecast 2025-2030 ($ million)
Data Table on Non-electric massage equipment - Market size and forecast 2025-2030 ($ million)
Chart on Non-electric massage equipment - Year-over-year growth 2025-2030 (%)
Data Table on Non-electric massage equipment - Year-over-year growth 2025-2030 (%)

10.5 Market opportunity by Type

Market opportunity by Type ($ million)
Data Table on Market opportunity by Type ($ million)

11. Customer Landscape

11.1 Customer landscape overview

Analysis of price sensitivity, lifecycle, customer purchase basket, adoption rates, and purchase criteria

12. Geographic Landscape

12.1 Geographic segmentation

Chart on Market share by geography 2025-2030 (%)
Data Table on Market share by geography 2025-2030 (%)

12.2 Geographic comparison

Chart on Geographic comparison
Data Table on Geographic comparison

12.3 North America - Market size and forecast 2025-2030

Chart on North America - Market size and forecast 2025-2030 ($ million)
Data Table on North America - Market size and forecast 2025-2030 ($ million)
Chart on North America - Year-over-year growth 2025-2030 (%)
Data Table on North America - Year-over-year growth 2025-2030 (%)
Chart on Regional Comparison - North America
Data Table on Regional Comparison - North America

12.3.1 US - Market size and forecast 2025-2030

Chart on US - Market size and forecast 2025-2030 ($ million)
Data Table on US - Market size and forecast 2025-2030 ($ million)
Chart on US - Year-over-year growth 2025-2030 (%)
Data Table on US - Year-over-year growth 2025-2030 (%)

12.3.2 Canada - Market size and forecast 2025-2030

Chart on Canada - Market size and forecast 2025-2030 ($ million)
Data Table on Canada - Market size and forecast 2025-2030 ($ million)
Chart on Canada - Year-over-year growth 2025-2030 (%)
Data Table on Canada - Year-over-year growth 2025-2030 (%)

12.3.3 Mexico - Market size and forecast 2025-2030

Chart on Mexico - Market size and forecast 2025-2030 ($ million)
Data Table on Mexico - Market size and forecast 2025-2030 ($ million)
Chart on Mexico - Year-over-year growth 2025-2030 (%)
Data Table on Mexico - Year-over-year growth 2025-2030 (%)

12.4 Europe - Market size and forecast 2025-2030

Chart on Europe - Market size and forecast 2025-2030 ($ million)
Data Table on Europe - Market size and forecast 2025-2030 ($ million)
Chart on Europe - Year-over-year growth 2025-2030 (%)
Data Table on Europe - Year-over-year growth 2025-2030 (%)
Chart on Regional Comparison - Europe
Data Table on Regional Comparison - Europe

12.4.1 Germany - Market size and forecast 2025-2030

Chart on Germany - Market size and forecast 2025-2030 ($ million)
Data Table on Germany - Market size and forecast 2025-2030 ($ million)
Chart on Germany - Year-over-year growth 2025-2030 (%)
Data Table on Germany - Year-over-year growth 2025-2030 (%)

12.4.2 UK - Market size and forecast 2025-2030

Chart on UK - Market size and forecast 2025-2030 ($ million)
Data Table on UK - Market size and forecast 2025-2030 ($ million)
Chart on UK - Year-over-year growth 2025-2030 (%)
Data Table on UK - Year-over-year growth 2025-2030 (%)

12.4.3 France - Market size and forecast 2025-2030

Chart on France - Market size and forecast 2025-2030 ($ million)
Data Table on France - Market size and forecast 2025-2030 ($ million)
Chart on France - Year-over-year growth 2025-2030 (%)
Data Table on France - Year-over-year growth 2025-2030 (%)

12.4.4 Italy - Market size and forecast 2025-2030

Chart on Italy - Market size and forecast 2025-2030 ($ million)
Data Table on Italy - Market size and forecast 2025-2030 ($ million)
Chart on Italy - Year-over-year growth 2025-2030 (%)
Data Table on Italy - Year-over-year growth 2025-2030 (%)

12.4.5 The Netherlands - Market size and forecast 2025-2030

Chart on The Netherlands - Market size and forecast 2025-2030 ($ million)
Data Table on The Netherlands - Market size and forecast 2025-2030 ($ million)
Chart on The Netherlands - Year-over-year growth 2025-2030 (%)
Data Table on The Netherlands - Year-over-year growth 2025-2030 (%)

12.4.6 Spain - Market size and forecast 2025-2030

Chart on Spain - Market size and forecast 2025-2030 ($ million)
Data Table on Spain - Market size and forecast 2025-2030 ($ million)
Chart on Spain - Year-over-year growth 2025-2030 (%)
Data Table on Spain - Year-over-year growth 2025-2030 (%)

12.5 APAC - Market size and forecast 2025-2030

Chart on APAC - Market size and forecast 2025-2030 ($ million)
Data Table on APAC - Market size and forecast 2025-2030 ($ million)
Chart on APAC - Year-over-year growth 2025-2030 (%)
Data Table on APAC - Year-over-year growth 2025-2030 (%)
Chart on Regional Comparison - APAC
Data Table on Regional Comparison - APAC

12.5.1 China - Market size and forecast 2025-2030

Chart on China - Market size and forecast 2025-2030 ($ million)
Data Table on China - Market size and forecast 2025-2030 ($ million)
Chart on China - Year-over-year growth 2025-2030 (%)
Data Table on China - Year-over-year growth 2025-2030 (%)

12.5.2 India - Market size and forecast 2025-2030

Chart on India - Market size and forecast 2025-2030 ($ million)
Data Table on India - Market size and forecast 2025-2030 ($ million)
Chart on India - Year-over-year growth 2025-2030 (%)
Data Table on India - Year-over-year growth 2025-2030 (%)

12.5.3 Japan - Market size and forecast 2025-2030

Chart on Japan - Market size and forecast 2025-2030 ($ million)
Data Table on Japan - Market size and forecast 2025-2030 ($ million)
Chart on Japan - Year-over-year growth 2025-2030 (%)
Data Table on Japan - Year-over-year growth 2025-2030 (%)

12.5.4 South Korea - Market size and forecast 2025-2030

Chart on South Korea - Market size and forecast 2025-2030 ($ million)
Data Table on South Korea - Market size and forecast 2025-2030 ($ million)
Chart on South Korea - Year-over-year growth 2025-2030 (%)
Data Table on South Korea - Year-over-year growth 2025-2030 (%)

12.5.5 Australia - Market size and forecast 2025-2030

Chart on Australia - Market size and forecast 2025-2030 ($ million)
Data Table on Australia - Market size and forecast 2025-2030 ($ million)
Chart on Australia - Year-over-year growth 2025-2030 (%)
Data Table on Australia - Year-over-year growth 2025-2030 (%)

12.5.6 Indonesia - Market size and forecast 2025-2030

Chart on Indonesia - Market size and forecast 2025-2030 ($ million)
Data Table on Indonesia - Market size and forecast 2025-2030 ($ million)
Chart on Indonesia - Year-over-year growth 2025-2030 (%)
Data Table on Indonesia - Year-over-year growth 2025-2030 (%)

12.6 South America - Market size and forecast 2025-2030

Chart on South America - Market size and forecast 2025-2030 ($ million)
Data Table on South America - Market size and forecast 2025-2030 ($ million)
Chart on South America - Year-over-year growth 2025-2030 (%)
Data Table on South America - Year-over-year growth 2025-2030 (%)
Chart on Regional Comparison - South America
Data Table on Regional Comparison - South America

12.6.1 Brazil - Market size and forecast 2025-2030

Chart on Brazil - Market size and forecast 2025-2030 ($ million)
Data Table on Brazil - Market size and forecast 2025-2030 ($ million)
Chart on Brazil - Year-over-year growth 2025-2030 (%)
Data Table on Brazil - Year-over-year growth 2025-2030 (%)

12.6.2 Argentina - Market size and forecast 2025-2030

Chart on Argentina - Market size and forecast 2025-2030 ($ million)
Data Table on Argentina - Market size and forecast 2025-2030 ($ million)
Chart on Argentina - Year-over-year growth 2025-2030 (%)
Data Table on Argentina - Year-over-year growth 2025-2030 (%)

12.6.3 Colombia - Market size and forecast 2025-2030

Chart on Colombia - Market size and forecast 2025-2030 ($ million)
Data Table on Colombia - Market size and forecast 2025-2030 ($ million)
Chart on Colombia - Year-over-year growth 2025-2030 (%)
Data Table on Colombia - Year-over-year growth 2025-2030 (%)

12.7 Middle East and Africa - Market size and forecast 2025-2030

Chart on Middle East and Africa - Market size and forecast 2025-2030 ($ million)
Data Table on Middle East and Africa - Market size and forecast 2025-2030 ($ million)
Chart on Middle East and Africa - Year-over-year growth 2025-2030 (%)
Data Table on Middle East and Africa - Year-over-year growth 2025-2030 (%)
Chart on Regional Comparison - Middle East and Africa
Data Table on Regional Comparison - Middle East and Africa

12.7.1 Saudi Arabia - Market size and forecast 2025-2030

Chart on Saudi Arabia - Market size and forecast 2025-2030 ($ million)
Data Table on Saudi Arabia - Market size and forecast 2025-2030 ($ million)
Chart on Saudi Arabia - Year-over-year growth 2025-2030 (%)
Data Table on Saudi Arabia - Year-over-year growth 2025-2030 (%)

12.7.2 UAE - Market size and forecast 2025-2030

Chart on UAE - Market size and forecast 2025-2030 ($ million)
Data Table on UAE - Market size and forecast 2025-2030 ($ million)
Chart on UAE - Year-over-year growth 2025-2030 (%)
Data Table on UAE - Year-over-year growth 2025-2030 (%)

12.7.3 South Africa - Market size and forecast 2025-2030

Chart on South Africa - Market size and forecast 2025-2030 ($ million)
Data Table on South Africa - Market size and forecast 2025-2030 ($ million)
Chart on South Africa - Year-over-year growth 2025-2030 (%)
Data Table on South Africa - Year-over-year growth 2025-2030 (%)

12.7.4 Israel - Market size and forecast 2025-2030

Chart on Israel - Market size and forecast 2025-2030 ($ million)
Data Table on Israel - Market size and forecast 2025-2030 ($ million)
Chart on Israel - Year-over-year growth 2025-2030 (%)
Data Table on Israel - Year-over-year growth 2025-2030 (%)

12.7.5 Turkey - Market size and forecast 2025-2030

Chart on Turkey - Market size and forecast 2025-2030 ($ million)
Data Table on Turkey - Market size and forecast 2025-2030 ($ million)
Chart on Turkey - Year-over-year growth 2025-2030 (%)
Data Table on Turkey - Year-over-year growth 2025-2030 (%)

12.8 Market opportunity by geography

Market opportunity by geography ($ million)
Data Tables on Market opportunity by geography ($ million)

13. Drivers, Challenges, and Opportunity

13.1 Market drivers

Rising prevalence of stress and work-related musculoskeletal disorders
Integration of artificial intelligence in massage technologies
Expansion of rehabilitation and sports medicine sectors

13.2 Market challenges

High cost of advanced massage equipment and economic sensitivity
Stringent regulatory hurdles and safety standards compliance
Competition from alternative therapies and counterfeit products

13.3 Impact of drivers and challenges

Impact of drivers and challenges in 2025 and 2030

13.4 Market opportunities

Integration of Internet of Things (IoT) for personalized wellness
Surge in demand for portable and ergonomic designs for corporate and home office application
Adoption of sustainable materials and energy-efficient manufacturing practices

14. Competitive Landscape

14.1 Overview

14.2

Overview on criticality of inputs and factors of differentiation

14.3 Landscape disruption

Overview on factors of disruption

14.4 Industry risks

Impact of key risks on business

15. Competitive Analysis

15.1 Companies profiled

Companies covered

15.2 Company ranking index

15.3 Market positioning of companies

Matrix on companies position and classification

15.4 Beurer GmbH

Beurer GmbH - Overview
Beurer GmbH - Product / Service
Beurer GmbH - Key offerings
SWOT

15.5 Bodyfriend Inc.

Bodyfriend Inc. - Overview
Bodyfriend Inc. - Product / Service
Bodyfriend Inc. - Key offerings
SWOT

15.6 Casada International GmbH

Casada International GmbH - Overview
Casada International GmbH - Product / Service
Casada International GmbH - Key offerings
SWOT

15.7 Conair Corp.

Conair Corp. - Overview
Conair Corp. - Product / Service
Conair Corp. - Key offerings
SWOT

15.8 Family Inada Co. Ltd.

Family Inada Co. Ltd. - Overview
Family Inada Co. Ltd. - Product / Service
Family Inada Co. Ltd. - Key offerings
SWOT

15.9 Fujita Massage Chair

Fujita Massage Chair - Overview
Fujita Massage Chair - Product / Service
Fujita Massage Chair - Key offerings
SWOT

15.10 Homedics USA

Homedics USA - Overview
Homedics USA - Product / Service
Homedics USA - Key offerings
SWOT

15.11 Human Touch LLC

Human Touch LLC - Overview
Human Touch LLC - Product / Service
Human Touch LLC - Key offerings
SWOT

15.12 Luraco Technologies

Luraco Technologies - Overview
Luraco Technologies - Product / Service
Luraco Technologies - Key offerings
SWOT

15.13 OMRON Corp.

OMRON Corp. - Overview
OMRON Corp. - Business segments
OMRON Corp. - Key news
OMRON Corp. - Key offerings
OMRON Corp. - Segment focus
SWOT

15.14 OSIM International Pte. Ltd.

OSIM International Pte. Ltd. - Overview
OSIM International Pte. Ltd. - Product / Service
OSIM International Pte. Ltd. - Key offerings
SWOT

15.15 Panasonic Holdings Corp.

Panasonic Holdings Corp. - Overview
Panasonic Holdings Corp. - Business segments
Panasonic Holdings Corp. - Key news
Panasonic Holdings Corp. - Key offerings
Panasonic Holdings Corp. - Segment focus
SWOT

15.16 Prospera Corp.

Prospera Corp. - Overview
Prospera Corp. - Product / Service
Prospera Corp. - Key offerings
SWOT

15.17 Wahl Clipper Corp.

Wahl Clipper Corp. - Overview
Wahl Clipper Corp. - Product / Service
Wahl Clipper Corp. - Key offerings
SWOT

15.18 Xiaomi Inc.

Xiaomi Inc. - Overview
Xiaomi Inc. - Business segments
Xiaomi Inc. - Key news
Xiaomi Inc. - Key offerings
Xiaomi Inc. - Segment focus
SWOT

16. Appendix

16.1 Scope of the report

Market definition
Objectives
Notes and caveats

16.2 Inclusions and exclusions checklist

Inclusions checklist
Exclusions checklist

16.3 Currency conversion rates for US$

16.4 Research methodology

16.5 Data procurement

Information sources

16.6 Data validation

16.7 Validation techniques employed for market sizing

16.8 Data synthesis

16.9 360 degree market analysis

16.10 List of abbreviations

Research Methodology

Technavio presents a detailed picture of the market by way of study, synthesis, and summation of data from multiple sources. The analysts have presented the various facets of the market with a particular focus on identifying the key industry influencers. The data thus presented is comprehensive, reliable, and the result of extensive research, both primary and secondary.

INFORMATION SOURCES

Primary sources

  • Manufacturers and suppliers
  • Channel partners
  • Industry experts
  • Strategic decision makers

Secondary sources

  • Industry journals and periodicals
  • Government data
  • Financial reports of key industry players
  • Historical data
  • Press releases

DATA ANALYSIS

Data Synthesis

  • Collation of data
  • Estimation of key figures
  • Analysis of derived insights

Data Validation

  • Triangulation with data models
  • Reference against proprietary databases
  • Corroboration with industry experts

REPORT WRITING

Qualitative

  • Market drivers
  • Market challenges
  • Market trends
  • Five forces analysis

Quantitative

  • Market size and forecast
  • Market segmentation
  • Geographical insights
  • Competitive landscape

Interested in this report?

Get your sample now to see our research methodology and insights!

Download Now

Frequently Asked Questions

Massage Equipment market growth will increase by USD 26659.7 million during 2026-2030.

The Massage Equipment market is expected to grow at a CAGR of 12% during 2026-2030.

Massage Equipment market is segmented by Product (Massage chairs and sofas, Back massagers, Handheld massagers, Neck and shoulder massagers, Others) End-user (Commercial, Residential) Type (Electric massage equipment, Non-electric massage equipment)

Beurer GmbH, Bodyfriend Inc., Casada International GmbH, Conair Corp., Family Inada Co. Ltd., Fujita Massage Chair, Homedics USA, Human Touch LLC, Luraco Technologies, OMRON Corp., OSIM International Pte. Ltd., Panasonic Holdings Corp., Prospera Corp., Relaxonchair, RoboTouch, Thumper Massager Inc., Wahl Clipper Corp., WelbuTech Co. Ltd., Xiaomi Inc. are a few of the key vendors in the Massage Equipment market.

North America will register the highest growth rate of 36.4% among the other regions. Therefore, the Massage Equipment market in North America is expected to garner significant business opportunities for the vendors during the forecast period.

US, Canada, Mexico, Germany, UK, France, Italy, The Netherlands, Spain, China, India, Japan, South Korea, Australia, Indonesia, Brazil, Argentina, Colombia, Saudi Arabia, UAE, South Africa, Israel, Turkey

  • Rising prevalence of stress and work-related musculoskeletal disorders is the driving factor this market.

The Massage Equipment market vendors should focus on grabbing business opportunities from the Product segment as it accounted for the largest market share in the base year.