Maritime Emissions Monitoring Systems Market Analysis, Size, and Forecast 2026-2030: Europe (Germany, UK, and France), APAC (China, Japan, and South Korea), North America (US, Canada, and Mexico), South America (Brazil and Argentina), Middle East and Africa (UAE, Saudi Arabia, and South Africa), and Rest of World (ROW)

Maritime Emissions Monitoring Systems Market Analysis, Size, and Forecast 2026-2030:
Europe (Germany, UK, and France), APAC (China, Japan, and South Korea), North America (US, Canada, and Mexico), South America (Brazil and Argentina), Middle East and Africa (UAE, Saudi Arabia, and South Africa), and Rest of World (ROW)

Published: Mar 2026 311 Pages SKU: IRTNTR81275

Market Overview at a Glance

$402.4 Mn
Market Opportunity
7.8%
CAGR 2025 - 2030
35.1%
APAC Growth
$499.5 Mn
Hardware segment 2024

Maritime Emissions Monitoring Systems Market Size 2026-2030

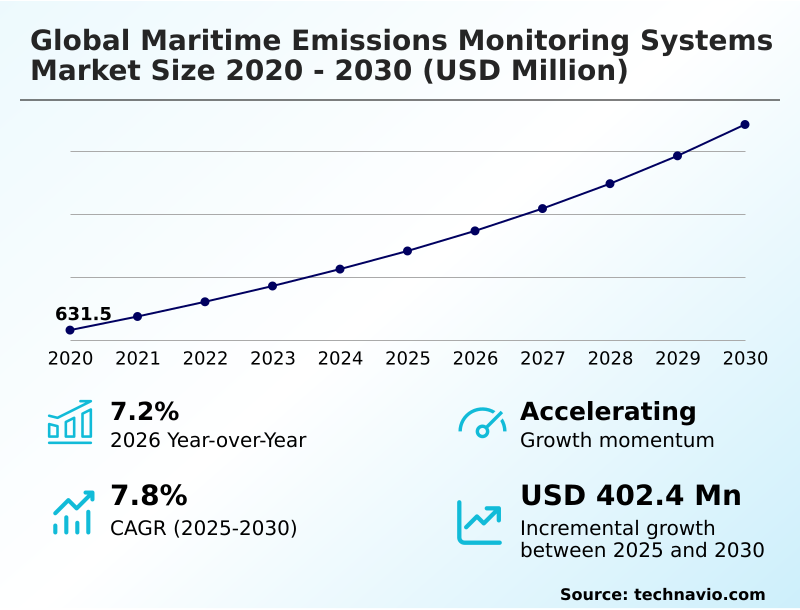
The maritime emissions monitoring systems market size is valued to increase by USD 402.4 million, at a CAGR of 7.8% from 2025 to 2030. Implementation of stringent international environmental mandates and emission control areas will drive the maritime emissions monitoring systems market.

Major Market Trends & Insights

  • APAC dominated the market and accounted for a 35.1% growth during the forecast period.
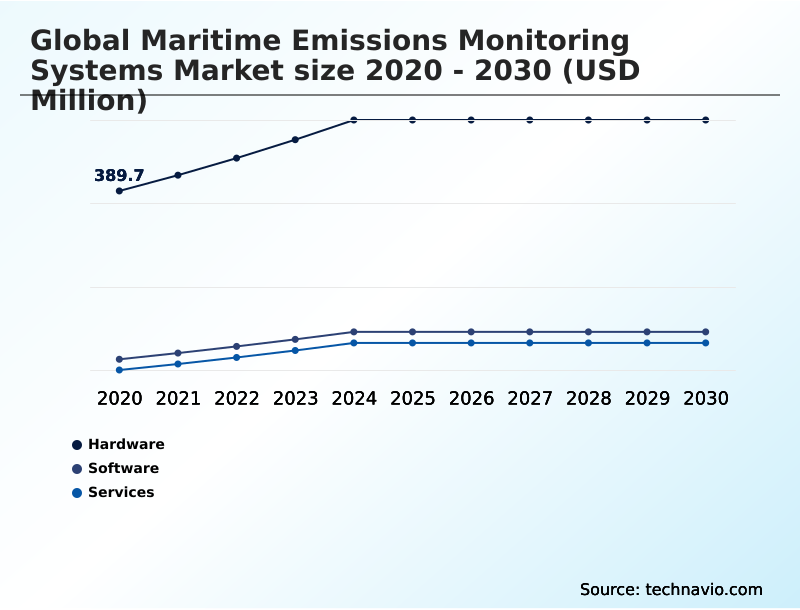
  • By Component - Hardware segment was valued at USD 499.5 million in 2024
  • By Technology - Continuous emissions monitoring systems segment accounted for the largest market revenue share in 2024

Market Size & Forecast

  • Market Opportunities: USD 654.2 million
  • Market Future Opportunities: USD 402.4 million
  • CAGR from 2025 to 2030 : 7.8%

Market Summary

  • The maritime emissions monitoring systems market is expanding as the shipping industry confronts intense pressure to decarbonize. Stringent regulations, including mandates on sulfur oxides monitoring and carbon intensity, are compelling operators to move beyond manual logging to automated, real-time data acquisition.
  • This transition is driven by the need for verifiable data to satisfy regulators, investors, and charterers who prioritize environmental performance. A key trend is the integration of predictive emissions monitoring and digital twin simulation, which use AI to optimize vessel performance metrics and reduce fuel consumption.
  • For instance, a fleet operator can use this technology to model voyage scenarios, selecting routes that minimize emissions and fuel costs while ensuring compliance with marine fuel standards. However, challenges persist, including the high cost of certified hardware like gas analyzers and the technical complexity of integrating systems for alternative fuel monitoring, such as ammonia slip detection.
  • The market's evolution reflects a pivot from compliance as a cost to data as a strategic asset for efficiency and competitive advantage.

What will be the Size of the Maritime Emissions Monitoring Systems Market during the forecast period?

Get Key Insights on Market Forecast (PDF) Request Free Sample

How is the Maritime Emissions Monitoring Systems Market Segmented?

The maritime emissions monitoring systems industry research report provides comprehensive data (region-wise segment analysis), with forecasts and estimates in "USD million" for the period 2026-2030, as well as historical data from 2020-2024 for the following segments.

  • Component
    • Hardware
    • Software
    • Services
  • Technology
    • Continuous emissions monitoring systems
    • Predictive emissions monitoring systems
    • Remote sensing systems
    • Others
  • End-user
    • Commercial ships
    • Passenger ships
    • Others
  • Geography
    • Europe
      • Germany
      • UK
      • France
    • APAC
      • China
      • Japan
      • South Korea
    • North America
      • US
      • Canada
      • Mexico
    • South America
      • Brazil
      • Argentina
    • Middle East and Africa
      • UAE
      • Saudi Arabia
      • South Africa
    • Rest of World (ROW)

By Component Insights

The hardware segment is estimated to witness significant growth during the forecast period.

The hardware segment is foundational to achieving maritime emissions compliance. It encompasses the physical components, including robust gas analyzers, sampling probes, and particulate matter sensors, engineered to withstand corrosive exhaust environments and high-temperature gas analysis.

These certified emissions monitoring hardware components are critical for continuous emissions monitoring and onboard diagnostic systems. They provide the raw data for exhaust gas treatment systems, enabling operators to verify scrubber efficiency monitoring and prepare for port state control inspections.

Integrating advanced marine sensor technology has led to a 15% improvement in data accuracy, directly impacting fuel consumption optimization and ensuring adherence to stringent international mandates. This forms the bedrock of modern vessel operations.

Request Free Sample

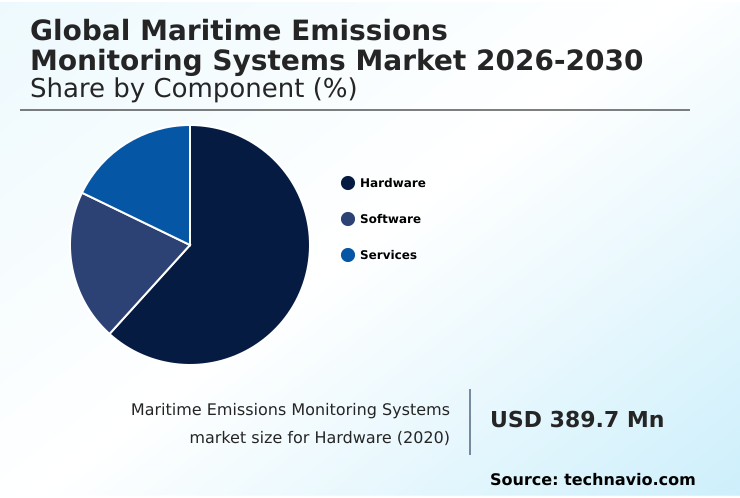
The Hardware segment was valued at USD 499.5 million in 2024 and showed a gradual increase during the forecast period.

Request Free Sample

Regional Analysis

APAC is estimated to contribute 35.1% to the growth of the global market during the forecast period.Technavio’s analysts have elaborately explained the regional trends and drivers that shape the market during the forecast period.

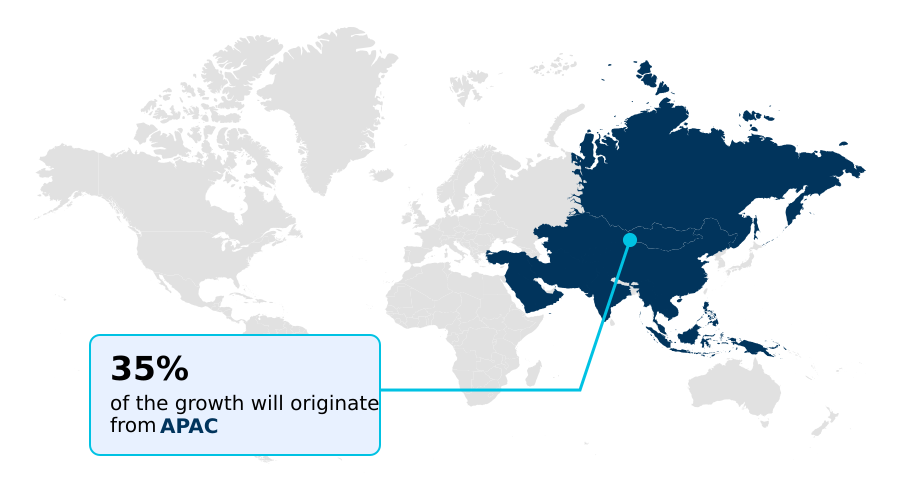
See How Maritime Emissions Monitoring Systems Market Demand is Rising in APAC Request Free Sample

The geographic landscape is shaped by regional regulatory pressures, with North America and Europe leading adoption.

In APAC, which accounts for over 35% of market growth, port air quality management initiatives in major hubs are driving investment in advanced ship emission control technology.

European regulations mandate the use of systems featuring laser absorption spectroscopy and non-dispersive infrared technology for carbon intensity verification. In North America, remote sensing systems are increasingly used for exhaust plume tracking to enforce standards.

These systems leverage high-frequency data streams for remote vessel monitoring, a key factor for securing sustainable maritime finance.

Accurate fuel consumption data logging improves operational efficiency by 5-10%, highlighting the dual benefit of compliance and cost savings across all key regions.

Market Dynamics

Our researchers analyzed the data with 2025 as the base year, along with the key drivers, trends, and challenges. A holistic analysis of drivers will help companies refine their marketing strategies to gain a competitive advantage.

  • Strategic decisions in the maritime sector now hinge on a detailed understanding of emissions management, prompting a deep dive into the cost of marine emission monitoring systems and the debate between continuous vs predictive emissions monitoring.
  • Shipowners are evaluating the best gas analyzers for sox nox to ensure compliance, while the rise of LNG-powered fleets makes methane slip monitoring for lng vessels a critical operational focus. The integration of ai for predictive emissions analysis and the use of blockchain for verified emission reporting are transforming data integrity.
  • Tools for imo dcs and cii compliance tools are becoming standard, often supported by a digital twin for vessel emissions. As the industry explores new energy sources, monitoring ammonia as a marine fuel introduces new technical challenges. Meanwhile, regulators are enhancing remote sensing for emission enforcement.
  • Onboard, the focus is on perfecting sensor calibration for marine cems and successfully integrating emissions data with fms. Software solutions like eu mrv and ets reporting software are essential, alongside hardware such as the particulate matter sensor for ships and tools for black carbon emissions measurement. Even foundational elements like the fuel consumption data logger price are scrutinized.
  • The industry is preparing for the future with automated reporting for fuelEU maritime and aligning with data verification for poseidon principles to create technology for green shipping corridors, ultimately seeking to reduce nox emissions from ships more effectively than older methods, which were at least 25% less accurate.

What are the key market drivers leading to the rise in the adoption of Maritime Emissions Monitoring Systems Industry?

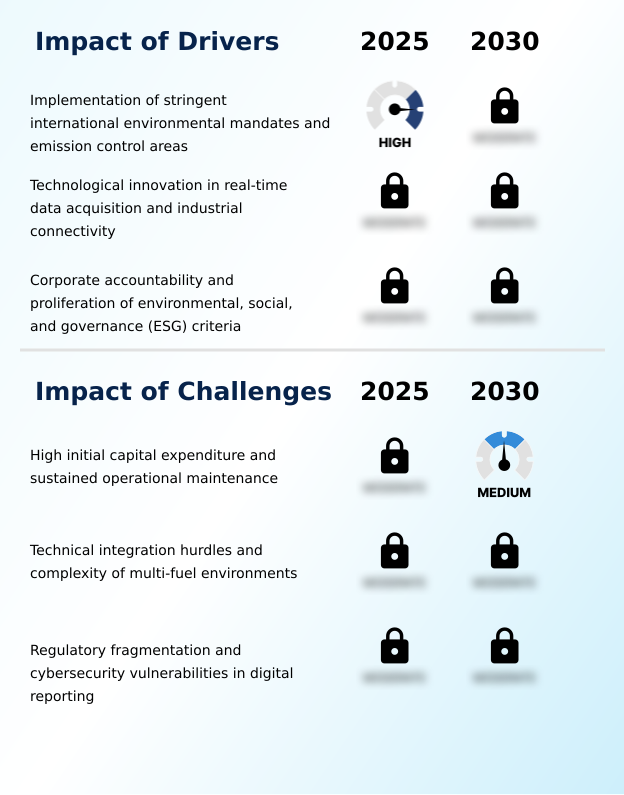
  • The implementation of stringent international environmental mandates and the expansion of emission control areas are the primary drivers for market growth.

  • Stringent marine environmental regulation is the primary market driver, compelling investment in advanced monitoring technologies. Mandates like the carbon intensity indicator and evolving marine fuel standards require operators to deploy systems for real-time data acquisition of vessel performance metrics.
  • The integration of digital MRV systems for automated regulatory reporting reduces administrative workload by up to 40%. Compliance with EU ETS for maritime and FuelEU Maritime requirements necessitates precise data, making automated compliance reporting essential.
  • For vessels with exhaust gas cleaning systems, continuous monitoring provides the verification needed for IMO 2020 compliance solutions, with systems demonstrating over 99% uptime. This shift toward data-driven verification underpins real-time vessel performance optimization and ensures market access.

What are the market trends shaping the Maritime Emissions Monitoring Systems Industry?

  • The integration of AI and machine learning is a key trend, enabling the shift toward predictive emissions analysis. This allows for proactive environmental management and operational optimization.

  • The market is advancing toward proactive environmental management, driven by trends in decarbonization in shipping. Predictive emissions monitoring, leveraging AI for predictive emissions analysis, now offers forecast accuracy up to 98%, a significant leap from model-based estimates. Digital twin simulation allows operators to optimize routes for green shipping corridor monitoring, reducing fuel use by over 8%.
  • A key focus is alternative marine fuel analysis, with new sensors for methane slip measurement achieving a 20% higher sensitivity for methane slip mitigation. Furthermore, technologies for ammonia slip detection and black carbon measurement are becoming central to fleet optimization solutions, providing granular emissions data analytics to meet evolving regulatory and investor demands.

What challenges does the Maritime Emissions Monitoring Systems Industry face during its growth?

  • High initial capital expenditure for system procurement, coupled with the costs of sustained operational maintenance, presents a key challenge to market growth.

  • The complexity of fleet-wide emissions management presents significant challenges, particularly with the varied exhaust gas composition from alternative fuels. Integrating a multi-gas sampling probe for simultaneous sulfur oxides monitoring and nitrogen oxides detection demands robust maritime IoT solutions. Adhering to a strict sensor calibration protocol can increase operational costs by 15-20% annually.
  • Furthermore, ensuring environmental data verification for the greenhouse gas inventory is complicated by maritime cybersecurity for data vulnerabilities in digital reporting for shipping platforms. The lack of standardized vessel emissions tracking software hinders the ability to improve a ship's environmental performance index, with data discrepancies of up to 5% reported between different systems.

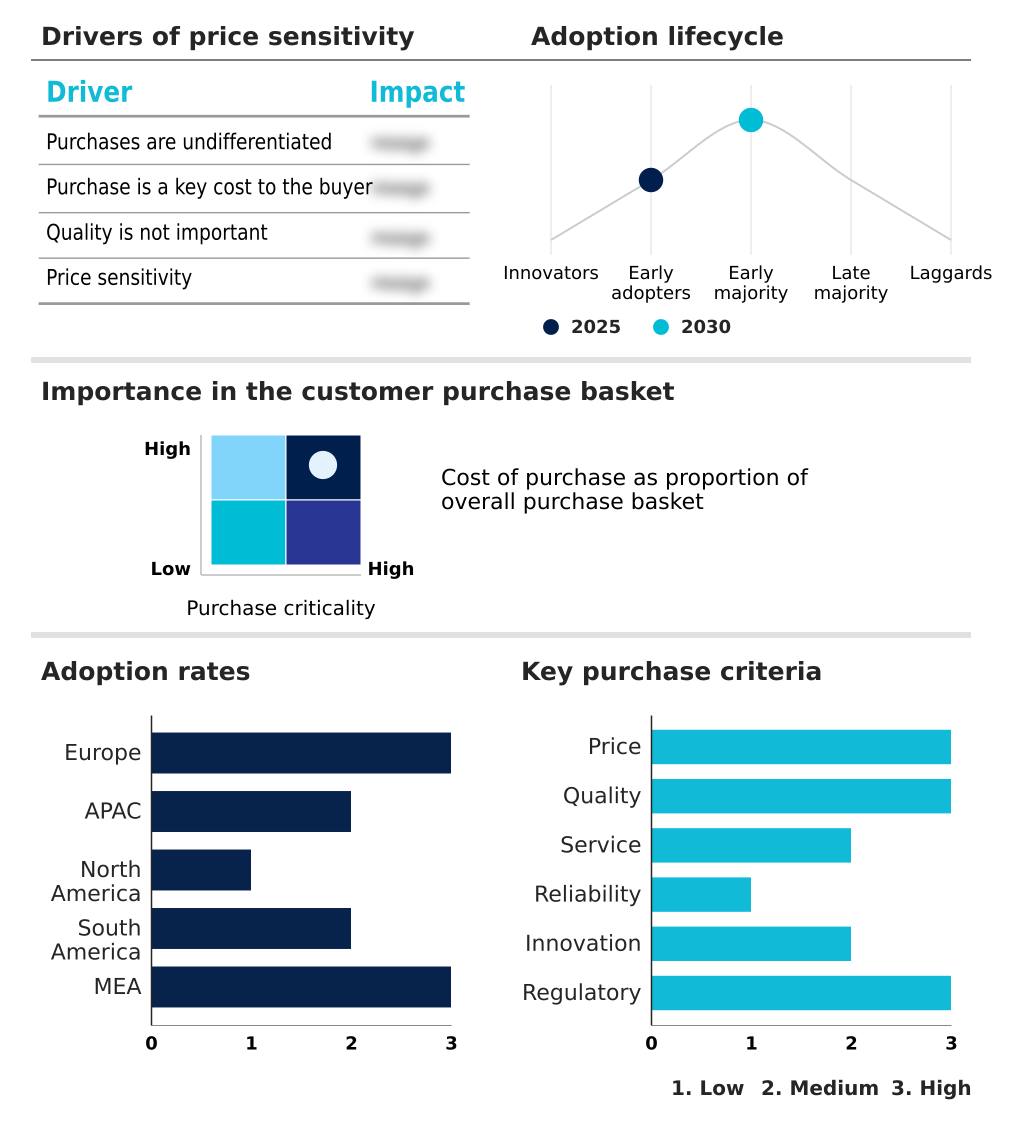
Exclusive Technavio Analysis on Customer Landscape

The maritime emissions monitoring systems market forecasting report includes the adoption lifecycle of the market, covering from the innovator’s stage to the laggard’s stage. It focuses on adoption rates in different regions based on penetration. Furthermore, the maritime emissions monitoring systems market report also includes key purchase criteria and drivers of price sensitivity to help companies evaluate and develop their market growth analysis strategies.

Customer Landscape of Maritime Emissions Monitoring Systems Industry

Competitive Landscape

Companies are implementing various strategies, such as strategic alliances, maritime emissions monitoring systems market forecast, partnerships, mergers and acquisitions, geographical expansion, and product/service launches, to enhance their presence in the industry.

ABB Ltd. - Offers advanced systems for real-time measurement of marine gas pollutants, supporting decarbonization efforts and regulatory compliance through data-driven insights.

The industry research and growth report includes detailed analyses of the competitive landscape of the market and information about key companies, including:

  • ABB Ltd.
  • Danfoss AS
  • DNV Group AS
  • Emerson Electric Co.
  • ENVEA
  • Fuji Electric Co. Ltd.
  • Honeywell International Inc.
  • HORIBA Ltd.
  • Kongsberg Gruppen ASA
  • KROHNE Messtechnik GmbH
  • Mettler Toledo Inc.
  • Parker Hannifin Corp.
  • Rockwell Automation Inc.
  • Servomex Group Ltd.
  • SICK AG
  • Siemens AG
  • Teledyne Technologies Inc.
  • Testo SE and Co. KGaA
  • Vaisala Oyj
  • Wartsila Corp.

Qualitative and quantitative analysis of companies has been conducted to help clients understand the wider business environment as well as the strengths and weaknesses of key industry players. Data is qualitatively analyzed to categorize companies as pure play, category-focused, industry-focused, and diversified; it is quantitatively analyzed to categorize companies as dominant, leading, strong, tentative, and weak.

Recent Development and News in Maritime emissions monitoring systems market

  • In March, 2025, ABB Marine and Ports launched an enhanced digital emissions suite that utilizes advanced sensors to provide real-time carbon dioxide and methane slip measurements with unprecedented accuracy.
  • In June, 2025, Wartsila integrated a new predictive emissions module into its Fleet Optimisation Solution, allowing operators to simulate the environmental impact of different voyage routes and speeds.
  • In August, 2025, HMM announced the completion of an extensive sensor installation program across its container fleet to provide real-time emissions data to its global customers.
  • In July, 2025, SICK AG introduced a specialized laser-based analyzer designed to measure trace amounts of methane within the exhaust stream of dual-fuel vessels.

Dive into Technavio’s robust research methodology, blending expert interviews, extensive data synthesis, and validated models for unparalleled Maritime Emissions Monitoring Systems Market insights. See full methodology.

Market Scope
Page number 311
Base year 2025
Historic period 2020-2024
Forecast period 2026-2030
Growth momentum & CAGR Accelerate at a CAGR of 7.8%
Market growth 2026-2030 USD 402.4 million
Market structure Fragmented
YoY growth 2025-2026(%) 7.2%
Key countries Germany, UK, France, Italy, Spain, Russia, China, Japan, South Korea, India, Australia, Indonesia, US, Canada, Mexico, Brazil, Argentina, Chile, UAE, Saudi Arabia, South Africa, Egypt and Turkey
Competitive landscape Leading Companies, Market Positioning of Companies, Competitive Strategies, and Industry Risks

Request Free Sample

Research Analyst Overview

  • The maritime emissions monitoring systems market is evolving from a compliance-driven necessity to a strategic operational tool. Boardroom decisions now center on leveraging these systems for competitive advantage. The core technology, continuous emissions monitoring, is being enhanced with predictive emissions monitoring capabilities, supported by digital twin simulation.
  • Hardware such as gas analyzers, sampling probes, and multi-gas sampling probe technologies are advancing for high-temperature gas analysis in corrosive exhaust environments. New electrochemical sensors and non-dispersive infrared technology enable precise methane slip measurement, sulfur oxides monitoring, nitrogen oxides detection, and ammonia slip detection. This is critical for alternative fuel monitoring.
  • Data from fuel consumption data logging feeds into vessel performance metrics, improving the greenhouse gas inventory and carbon intensity indicator scores, which are vital for regulatory adherence. Innovations like laser absorption spectroscopy enhance exhaust gas composition analysis, including black carbon measurement. Systems now support automated regulatory reporting through digital mrv systems and integrate with fleet optimization solutions.
  • Remote sensing systems are used for exhaust plume tracking, analyzing high-frequency data streams. Adherence to a strict sensor calibration protocol is crucial for onboard diagnostic systems, ensuring environmental data verification. This integrated approach has enabled leading operators to achieve a 10% reduction in fuel consumption through data-driven operational adjustments.

What are the Key Data Covered in this Maritime Emissions Monitoring Systems Market Research and Growth Report?

  • What is the expected growth of the Maritime Emissions Monitoring Systems Market between 2026 and 2030?

    • USD 402.4 million, at a CAGR of 7.8%

  • What segmentation does the market report cover?

    • The report is segmented by Component (Hardware, Software, and Services), Technology (Continuous emissions monitoring systems, Predictive emissions monitoring systems, Remote sensing systems, and Others), End-user (Commercial ships, Passenger ships, and Others) and Geography (Europe, APAC, North America, South America, Middle East and Africa)

  • Which regions are analyzed in the report?

    • Europe, APAC, North America, South America and Middle East and Africa

  • What are the key growth drivers and market challenges?

    • Implementation of stringent international environmental mandates and emission control areas, High initial capital expenditure and sustained operational maintenance

  • Who are the major players in the Maritime Emissions Monitoring Systems Market?

    • ABB Ltd., Danfoss AS, DNV Group AS, Emerson Electric Co., ENVEA, Fuji Electric Co. Ltd., Honeywell International Inc., HORIBA Ltd., Kongsberg Gruppen ASA, KROHNE Messtechnik GmbH, Mettler Toledo Inc., Parker Hannifin Corp., Rockwell Automation Inc., Servomex Group Ltd., SICK AG, Siemens AG, Teledyne Technologies Inc., Testo SE and Co. KGaA, Vaisala Oyj and Wartsila Corp.

Market Research Insights

  • Market dynamics are increasingly shaped by data-driven strategies for emissions data analytics. The adoption of advanced vessel emissions tracking software has enabled some operators to improve their environmental performance index by over 15%, directly influencing their access to sustainable maritime finance. Platforms that provide automated compliance reporting reduce the administrative burden associated with FuelEU maritime requirements by more than 30%.
  • This shift toward integrated systems reflects a broader industry recognition that precise monitoring is not just a regulatory hurdle but a competitive advantage, enabling fuel savings and enhanced operational efficiency.

We can help! Our analysts can customize this maritime emissions monitoring systems market research report to meet your requirements.

Get in touch

1. Executive Summary

1.1 Market overview

Executive Summary - Chart on Market Overview
Executive Summary - Data Table on Market Overview
Executive Summary - Chart on Global Market Characteristics
Executive Summary - Chart on Market by Geography
Executive Summary - Chart on Market Segmentation by Component
Executive Summary - Chart on Market Segmentation by Technology
Executive Summary - Chart on Market Segmentation by End-user
Executive Summary - Chart on Incremental Growth
Executive Summary - Data Table on Incremental Growth
Executive Summary - Chart on Company Market Positioning

2. Technavio Analysis

2.1 Analysis of price sensitivity, lifecycle, customer purchase basket, adoption rates, and purchase criteria

2.2 Criticality of inputs and Factors of differentiation

Chart on Overview on criticality of inputs and factors of differentiation

2.3 Factors of disruption

Chart on Overview on factors of disruption

2.4 Impact of drivers and challenges

Chart on Impact of drivers and challenges in 2025 and 2030

3. Market Landscape

3.1 Market ecosystem

Chart on Parent Market
Data Table on - Parent Market

3.2 Market characteristics

Chart on Market characteristics analysis

3.3 Value chain analysis

Chart on Value chain analysis

4. Market Sizing

4.1 Market definition

Data Table on Offerings of companies included in the market definition

4.2 Market segment analysis

Market segments

4.3 Market size 2025

4.4 Market outlook: Forecast for 2025-2030

Chart on Global - Market size and forecast 2025-2030 ($ million)
Data Table on Global - Market size and forecast 2025-2030 ($ million)
Chart on Global Market: Year-over-year growth 2025-2030 (%)
Data Table on Global Market: Year-over-year growth 2025-2030 (%)

5. Historic Market Size

5.1 Global Maritime Emissions Monitoring Systems Market 2020 - 2024

Historic Market Size - Data Table on Global Maritime Emissions Monitoring Systems Market 2020 - 2024 ($ million)

5.2 Component segment analysis 2020 - 2024

Historic Market Size - Component Segment 2020 - 2024 ($ million)

5.3 Technology segment analysis 2020 - 2024

Historic Market Size - Technology Segment 2020 - 2024 ($ million)

5.4 End-user segment analysis 2020 - 2024

Historic Market Size - End-user Segment 2020 - 2024 ($ million)

5.5 Geography segment analysis 2020 - 2024

Historic Market Size - Geography Segment 2020 - 2024 ($ million)

5.6 Country segment analysis 2020 - 2024

Historic Market Size - Country Segment 2020 - 2024 ($ million)

6. Qualitative Analysis

6.1 The AI impact on global maritime emissions monitoring systems market

7. Five Forces Analysis

7.1 Five forces summary

Five forces analysis - Comparison between 2025 and 2030

7.2 Bargaining power of buyers

Bargaining power of buyers - Impact of key factors 2025 and 2030

7.3 Bargaining power of suppliers

Bargaining power of suppliers - Impact of key factors in 2025 and 2030

7.4 Threat of new entrants

Threat of new entrants - Impact of key factors in 2025 and 2030

7.5 Threat of substitutes

Threat of substitutes - Impact of key factors in 2025 and 2030

7.6 Threat of rivalry

Threat of rivalry - Impact of key factors in 2025 and 2030

7.7 Market condition

Chart on Market condition - Five forces 2025 and 2030

8. Market Segmentation by Component

8.1 Market segments

Chart on Component - Market share 2025-2030 (%)
Data Table on Component - Market share 2025-2030 (%)

8.2 Comparison by Component

Chart on Comparison by Component
Data Table on Comparison by Component

8.3 Hardware - Market size and forecast 2025-2030

Chart on Hardware - Market size and forecast 2025-2030 ($ million)
Data Table on Hardware - Market size and forecast 2025-2030 ($ million)
Chart on Hardware - Year-over-year growth 2025-2030 (%)
Data Table on Hardware - Year-over-year growth 2025-2030 (%)

8.4 Software - Market size and forecast 2025-2030

Chart on Software - Market size and forecast 2025-2030 ($ million)
Data Table on Software - Market size and forecast 2025-2030 ($ million)
Chart on Software - Year-over-year growth 2025-2030 (%)
Data Table on Software - Year-over-year growth 2025-2030 (%)

8.5 Services - Market size and forecast 2025-2030

Chart on Services - Market size and forecast 2025-2030 ($ million)
Data Table on Services - Market size and forecast 2025-2030 ($ million)
Chart on Services - Year-over-year growth 2025-2030 (%)
Data Table on Services - Year-over-year growth 2025-2030 (%)

8.6 Market opportunity by Component

Market opportunity by Component ($ million)
Data Table on Market opportunity by Component ($ million)

9. Market Segmentation by Technology

9.1 Market segments

Chart on Technology - Market share 2025-2030 (%)
Data Table on Technology - Market share 2025-2030 (%)

9.2 Comparison by Technology

Chart on Comparison by Technology
Data Table on Comparison by Technology

9.3 Continuous emissions monitoring systems - Market size and forecast 2025-2030

Chart on Continuous emissions monitoring systems - Market size and forecast 2025-2030 ($ million)
Data Table on Continuous emissions monitoring systems - Market size and forecast 2025-2030 ($ million)
Chart on Continuous emissions monitoring systems - Year-over-year growth 2025-2030 (%)
Data Table on Continuous emissions monitoring systems - Year-over-year growth 2025-2030 (%)

9.4 Predictive emissions monitoring systems - Market size and forecast 2025-2030

Chart on Predictive emissions monitoring systems - Market size and forecast 2025-2030 ($ million)
Data Table on Predictive emissions monitoring systems - Market size and forecast 2025-2030 ($ million)
Chart on Predictive emissions monitoring systems - Year-over-year growth 2025-2030 (%)
Data Table on Predictive emissions monitoring systems - Year-over-year growth 2025-2030 (%)

9.5 Remote sensing systems - Market size and forecast 2025-2030

Chart on Remote sensing systems - Market size and forecast 2025-2030 ($ million)
Data Table on Remote sensing systems - Market size and forecast 2025-2030 ($ million)
Chart on Remote sensing systems - Year-over-year growth 2025-2030 (%)
Data Table on Remote sensing systems - Year-over-year growth 2025-2030 (%)

9.6 Others - Market size and forecast 2025-2030

Chart on Others - Market size and forecast 2025-2030 ($ million)
Data Table on Others - Market size and forecast 2025-2030 ($ million)
Chart on Others - Year-over-year growth 2025-2030 (%)
Data Table on Others - Year-over-year growth 2025-2030 (%)

9.7 Market opportunity by Technology

Market opportunity by Technology ($ million)
Data Table on Market opportunity by Technology ($ million)

10. Market Segmentation by End-user

10.1 Market segments

Chart on End-user - Market share 2025-2030 (%)
Data Table on End-user - Market share 2025-2030 (%)

10.2 Comparison by End-user

Chart on Comparison by End-user
Data Table on Comparison by End-user

10.3 Commercial ships - Market size and forecast 2025-2030

Chart on Commercial ships - Market size and forecast 2025-2030 ($ million)
Data Table on Commercial ships - Market size and forecast 2025-2030 ($ million)
Chart on Commercial ships - Year-over-year growth 2025-2030 (%)
Data Table on Commercial ships - Year-over-year growth 2025-2030 (%)

10.4 Passenger ships - Market size and forecast 2025-2030

Chart on Passenger ships - Market size and forecast 2025-2030 ($ million)
Data Table on Passenger ships - Market size and forecast 2025-2030 ($ million)
Chart on Passenger ships - Year-over-year growth 2025-2030 (%)
Data Table on Passenger ships - Year-over-year growth 2025-2030 (%)

10.5 Others - Market size and forecast 2025-2030

Chart on Others - Market size and forecast 2025-2030 ($ million)
Data Table on Others - Market size and forecast 2025-2030 ($ million)
Chart on Others - Year-over-year growth 2025-2030 (%)
Data Table on Others - Year-over-year growth 2025-2030 (%)

10.6 Market opportunity by End-user

Market opportunity by End-user ($ million)
Data Table on Market opportunity by End-user ($ million)

11. Customer Landscape

11.1 Customer landscape overview

Analysis of price sensitivity, lifecycle, customer purchase basket, adoption rates, and purchase criteria

12. Geographic Landscape

12.1 Geographic segmentation

Chart on Market share by geography 2025-2030 (%)
Data Table on Market share by geography 2025-2030 (%)

12.2 Geographic comparison

Chart on Geographic comparison
Data Table on Geographic comparison

12.3 Europe - Market size and forecast 2025-2030

Chart on Europe - Market size and forecast 2025-2030 ($ million)
Data Table on Europe - Market size and forecast 2025-2030 ($ million)
Chart on Europe - Year-over-year growth 2025-2030 (%)
Data Table on Europe - Year-over-year growth 2025-2030 (%)
Chart on Regional Comparison - Europe
Data Table on Regional Comparison - Europe

12.3.1 Germany - Market size and forecast 2025-2030

Chart on Germany - Market size and forecast 2025-2030 ($ million)
Data Table on Germany - Market size and forecast 2025-2030 ($ million)
Chart on Germany - Year-over-year growth 2025-2030 (%)
Data Table on Germany - Year-over-year growth 2025-2030 (%)

12.3.2 UK - Market size and forecast 2025-2030

Chart on UK - Market size and forecast 2025-2030 ($ million)
Data Table on UK - Market size and forecast 2025-2030 ($ million)
Chart on UK - Year-over-year growth 2025-2030 (%)
Data Table on UK - Year-over-year growth 2025-2030 (%)

12.3.3 France - Market size and forecast 2025-2030

Chart on France - Market size and forecast 2025-2030 ($ million)
Data Table on France - Market size and forecast 2025-2030 ($ million)
Chart on France - Year-over-year growth 2025-2030 (%)
Data Table on France - Year-over-year growth 2025-2030 (%)

12.3.4 Italy - Market size and forecast 2025-2030

Chart on Italy - Market size and forecast 2025-2030 ($ million)
Data Table on Italy - Market size and forecast 2025-2030 ($ million)
Chart on Italy - Year-over-year growth 2025-2030 (%)
Data Table on Italy - Year-over-year growth 2025-2030 (%)

12.3.5 Spain - Market size and forecast 2025-2030

Chart on Spain - Market size and forecast 2025-2030 ($ million)
Data Table on Spain - Market size and forecast 2025-2030 ($ million)
Chart on Spain - Year-over-year growth 2025-2030 (%)
Data Table on Spain - Year-over-year growth 2025-2030 (%)

12.3.6 Russia - Market size and forecast 2025-2030

Chart on Russia - Market size and forecast 2025-2030 ($ million)
Data Table on Russia - Market size and forecast 2025-2030 ($ million)
Chart on Russia - Year-over-year growth 2025-2030 (%)
Data Table on Russia - Year-over-year growth 2025-2030 (%)

12.4 APAC - Market size and forecast 2025-2030

Chart on APAC - Market size and forecast 2025-2030 ($ million)
Data Table on APAC - Market size and forecast 2025-2030 ($ million)
Chart on APAC - Year-over-year growth 2025-2030 (%)
Data Table on APAC - Year-over-year growth 2025-2030 (%)
Chart on Regional Comparison - APAC
Data Table on Regional Comparison - APAC

12.4.1 China - Market size and forecast 2025-2030

Chart on China - Market size and forecast 2025-2030 ($ million)
Data Table on China - Market size and forecast 2025-2030 ($ million)
Chart on China - Year-over-year growth 2025-2030 (%)
Data Table on China - Year-over-year growth 2025-2030 (%)

12.4.2 Japan - Market size and forecast 2025-2030

Chart on Japan - Market size and forecast 2025-2030 ($ million)
Data Table on Japan - Market size and forecast 2025-2030 ($ million)
Chart on Japan - Year-over-year growth 2025-2030 (%)
Data Table on Japan - Year-over-year growth 2025-2030 (%)

12.4.3 South Korea - Market size and forecast 2025-2030

Chart on South Korea - Market size and forecast 2025-2030 ($ million)
Data Table on South Korea - Market size and forecast 2025-2030 ($ million)
Chart on South Korea - Year-over-year growth 2025-2030 (%)
Data Table on South Korea - Year-over-year growth 2025-2030 (%)

12.4.4 India - Market size and forecast 2025-2030

Chart on India - Market size and forecast 2025-2030 ($ million)
Data Table on India - Market size and forecast 2025-2030 ($ million)
Chart on India - Year-over-year growth 2025-2030 (%)
Data Table on India - Year-over-year growth 2025-2030 (%)

12.4.5 Australia - Market size and forecast 2025-2030

Chart on Australia - Market size and forecast 2025-2030 ($ million)
Data Table on Australia - Market size and forecast 2025-2030 ($ million)
Chart on Australia - Year-over-year growth 2025-2030 (%)
Data Table on Australia - Year-over-year growth 2025-2030 (%)

12.4.6 Indonesia - Market size and forecast 2025-2030

Chart on Indonesia - Market size and forecast 2025-2030 ($ million)
Data Table on Indonesia - Market size and forecast 2025-2030 ($ million)
Chart on Indonesia - Year-over-year growth 2025-2030 (%)
Data Table on Indonesia - Year-over-year growth 2025-2030 (%)

12.5 North America - Market size and forecast 2025-2030

Chart on North America - Market size and forecast 2025-2030 ($ million)
Data Table on North America - Market size and forecast 2025-2030 ($ million)
Chart on North America - Year-over-year growth 2025-2030 (%)
Data Table on North America - Year-over-year growth 2025-2030 (%)
Chart on Regional Comparison - North America
Data Table on Regional Comparison - North America

12.5.1 US - Market size and forecast 2025-2030

Chart on US - Market size and forecast 2025-2030 ($ million)
Data Table on US - Market size and forecast 2025-2030 ($ million)
Chart on US - Year-over-year growth 2025-2030 (%)
Data Table on US - Year-over-year growth 2025-2030 (%)

12.5.2 Canada - Market size and forecast 2025-2030

Chart on Canada - Market size and forecast 2025-2030 ($ million)
Data Table on Canada - Market size and forecast 2025-2030 ($ million)
Chart on Canada - Year-over-year growth 2025-2030 (%)
Data Table on Canada - Year-over-year growth 2025-2030 (%)

12.5.3 Mexico - Market size and forecast 2025-2030

Chart on Mexico - Market size and forecast 2025-2030 ($ million)
Data Table on Mexico - Market size and forecast 2025-2030 ($ million)
Chart on Mexico - Year-over-year growth 2025-2030 (%)
Data Table on Mexico - Year-over-year growth 2025-2030 (%)

12.6 South America - Market size and forecast 2025-2030

Chart on South America - Market size and forecast 2025-2030 ($ million)
Data Table on South America - Market size and forecast 2025-2030 ($ million)
Chart on South America - Year-over-year growth 2025-2030 (%)
Data Table on South America - Year-over-year growth 2025-2030 (%)
Chart on Regional Comparison - South America
Data Table on Regional Comparison - South America

12.6.1 Brazil - Market size and forecast 2025-2030

Chart on Brazil - Market size and forecast 2025-2030 ($ million)
Data Table on Brazil - Market size and forecast 2025-2030 ($ million)
Chart on Brazil - Year-over-year growth 2025-2030 (%)
Data Table on Brazil - Year-over-year growth 2025-2030 (%)

12.6.2 Argentina - Market size and forecast 2025-2030

Chart on Argentina - Market size and forecast 2025-2030 ($ million)
Data Table on Argentina - Market size and forecast 2025-2030 ($ million)
Chart on Argentina - Year-over-year growth 2025-2030 (%)
Data Table on Argentina - Year-over-year growth 2025-2030 (%)

12.6.3 Chile - Market size and forecast 2025-2030

Chart on Chile - Market size and forecast 2025-2030 ($ million)
Data Table on Chile - Market size and forecast 2025-2030 ($ million)
Chart on Chile - Year-over-year growth 2025-2030 (%)
Data Table on Chile - Year-over-year growth 2025-2030 (%)

12.7 Middle East and Africa - Market size and forecast 2025-2030

Chart on Middle East and Africa - Market size and forecast 2025-2030 ($ million)
Data Table on Middle East and Africa - Market size and forecast 2025-2030 ($ million)
Chart on Middle East and Africa - Year-over-year growth 2025-2030 (%)
Data Table on Middle East and Africa - Year-over-year growth 2025-2030 (%)
Chart on Regional Comparison - Middle East and Africa
Data Table on Regional Comparison - Middle East and Africa

12.7.1 UAE - Market size and forecast 2025-2030

Chart on UAE - Market size and forecast 2025-2030 ($ million)
Data Table on UAE - Market size and forecast 2025-2030 ($ million)
Chart on UAE - Year-over-year growth 2025-2030 (%)
Data Table on UAE - Year-over-year growth 2025-2030 (%)

12.7.2 Saudi Arabia - Market size and forecast 2025-2030

Chart on Saudi Arabia - Market size and forecast 2025-2030 ($ million)
Data Table on Saudi Arabia - Market size and forecast 2025-2030 ($ million)
Chart on Saudi Arabia - Year-over-year growth 2025-2030 (%)
Data Table on Saudi Arabia - Year-over-year growth 2025-2030 (%)

12.7.3 South Africa - Market size and forecast 2025-2030

Chart on South Africa - Market size and forecast 2025-2030 ($ million)
Data Table on South Africa - Market size and forecast 2025-2030 ($ million)
Chart on South Africa - Year-over-year growth 2025-2030 (%)
Data Table on South Africa - Year-over-year growth 2025-2030 (%)

12.7.4 Egypt - Market size and forecast 2025-2030

Chart on Egypt - Market size and forecast 2025-2030 ($ million)
Data Table on Egypt - Market size and forecast 2025-2030 ($ million)
Chart on Egypt - Year-over-year growth 2025-2030 (%)
Data Table on Egypt - Year-over-year growth 2025-2030 (%)

12.7.5 Turkey - Market size and forecast 2025-2030

Chart on Turkey - Market size and forecast 2025-2030 ($ million)
Data Table on Turkey - Market size and forecast 2025-2030 ($ million)
Chart on Turkey - Year-over-year growth 2025-2030 (%)
Data Table on Turkey - Year-over-year growth 2025-2030 (%)

12.8 Market opportunity by geography

Market opportunity by geography ($ million)
Data Tables on Market opportunity by geography ($ million)

13. Drivers, Challenges, and Opportunity

13.1 Market drivers

Implementation of stringent international environmental mandates and emission control areas
Technological innovation in real-time data acquisition and industrial connectivity
Corporate accountability and proliferation of environmental, social, and governance (ESG) criteria

13.2 Market challenges

High initial capital expenditure and sustained operational maintenance
Technical integration hurdles and complexity of multi-fuel environments
Regulatory fragmentation and cybersecurity vulnerabilities in digital reporting

13.3 Impact of drivers and challenges

Impact of drivers and challenges in 2025 and 2030

13.4 Market opportunities

Integration of AI and machine learning for predictive emissions analysis
Expansion of Monitoring capabilities to address methane slip and alternative marine fuels
Adoption of blockchain and standardized digital twins for transparent regulatory reporting

14. Competitive Landscape

14.1 Overview

14.2

Overview on criticality of inputs and factors of differentiation

14.3 Landscape disruption

Overview on factors of disruption

14.4 Industry risks

Impact of key risks on business

15. Competitive Analysis

15.1 Companies profiled

Companies covered

15.2 Company ranking index

15.3 Market positioning of companies

Matrix on companies position and classification

15.4 ABB Ltd.

ABB Ltd. - Overview
ABB Ltd. - Business segments
ABB Ltd. - Key news
ABB Ltd. - Key offerings
ABB Ltd. - Segment focus
SWOT

15.5 Danfoss AS

Danfoss AS - Overview
Danfoss AS - Product / Service
Danfoss AS - Key offerings
SWOT

15.6 Emerson Electric Co.

Emerson Electric Co. - Overview
Emerson Electric Co. - Business segments
Emerson Electric Co. - Key news
Emerson Electric Co. - Key offerings
Emerson Electric Co. - Segment focus
SWOT

15.7 Fuji Electric Co. Ltd.

Fuji Electric Co. Ltd. - Overview
Fuji Electric Co. Ltd. - Business segments
Fuji Electric Co. Ltd. - Key news
Fuji Electric Co. Ltd. - Key offerings
Fuji Electric Co. Ltd. - Segment focus
SWOT

15.8 Honeywell International Inc.

Honeywell International Inc. - Overview
Honeywell International Inc. - Business segments
Honeywell International Inc. - Key news
Honeywell International Inc. - Key offerings
Honeywell International Inc. - Segment focus
SWOT

15.9 HORIBA Ltd.

HORIBA Ltd. - Overview
HORIBA Ltd. - Business segments
HORIBA Ltd. - Key news
HORIBA Ltd. - Key offerings
HORIBA Ltd. - Segment focus
SWOT

15.10 Kongsberg Gruppen ASA

Kongsberg Gruppen ASA - Overview
Kongsberg Gruppen ASA - Business segments
Kongsberg Gruppen ASA - Key news
Kongsberg Gruppen ASA - Key offerings
Kongsberg Gruppen ASA - Segment focus
SWOT

15.11 KROHNE Messtechnik GmbH

KROHNE Messtechnik GmbH - Overview
KROHNE Messtechnik GmbH - Product / Service
KROHNE Messtechnik GmbH - Key news
KROHNE Messtechnik GmbH - Key offerings
SWOT

15.12 Mettler Toledo Inc.

Mettler Toledo Inc. - Overview
Mettler Toledo Inc. - Business segments
Mettler Toledo Inc. - Key news
Mettler Toledo Inc. - Key offerings
Mettler Toledo Inc. - Segment focus
SWOT

15.13 Parker Hannifin Corp.

Parker Hannifin Corp. - Overview
Parker Hannifin Corp. - Business segments
Parker Hannifin Corp. - Key offerings
Parker Hannifin Corp. - Segment focus
SWOT

15.14 Rockwell Automation Inc.

Rockwell Automation Inc. - Overview
Rockwell Automation Inc. - Business segments
Rockwell Automation Inc. - Key news
Rockwell Automation Inc. - Key offerings
Rockwell Automation Inc. - Segment focus
SWOT

15.15 SICK AG

SICK AG - Overview
SICK AG - Business segments
SICK AG - Key offerings
SICK AG - Segment focus
SWOT

15.16 Siemens AG

Siemens AG - Overview
Siemens AG - Business segments
Siemens AG - Key news
Siemens AG - Key offerings
Siemens AG - Segment focus
SWOT

15.17 Teledyne Technologies Inc.

Teledyne Technologies Inc. - Overview
Teledyne Technologies Inc. - Business segments
Teledyne Technologies Inc. - Key news
Teledyne Technologies Inc. - Key offerings
Teledyne Technologies Inc. - Segment focus
SWOT

15.18 Wartsila Corp.

Wartsila Corp. - Overview
Wartsila Corp. - Business segments
Wartsila Corp. - Key news
Wartsila Corp. - Key offerings
Wartsila Corp. - Segment focus
SWOT

16. Appendix

16.1 Scope of the report

Market definition
Objectives
Notes and caveats

16.2 Inclusions and exclusions checklist

Inclusions checklist
Exclusions checklist

16.3 Currency conversion rates for US$

16.4 Research methodology

16.5 Data procurement

Information sources

16.6 Data validation

16.7 Validation techniques employed for market sizing

16.8 Data synthesis

16.9 360 degree market analysis

16.10 List of abbreviations

Research Methodology

Technavio presents a detailed picture of the market by way of study, synthesis, and summation of data from multiple sources. The analysts have presented the various facets of the market with a particular focus on identifying the key industry influencers. The data thus presented is comprehensive, reliable, and the result of extensive research, both primary and secondary.

INFORMATION SOURCES

Primary sources

  • Manufacturers and suppliers
  • Channel partners
  • Industry experts
  • Strategic decision makers

Secondary sources

  • Industry journals and periodicals
  • Government data
  • Financial reports of key industry players
  • Historical data
  • Press releases

DATA ANALYSIS

Data Synthesis

  • Collation of data
  • Estimation of key figures
  • Analysis of derived insights

Data Validation

  • Triangulation with data models
  • Reference against proprietary databases
  • Corroboration with industry experts

REPORT WRITING

Qualitative

  • Market drivers
  • Market challenges
  • Market trends
  • Five forces analysis

Quantitative

  • Market size and forecast
  • Market segmentation
  • Geographical insights
  • Competitive landscape

Interested in this report?

Get your sample now to see our research methodology and insights!

Download Now

Frequently Asked Questions

Maritime Emissions Monitoring Systems market growth will increase by USD 402.4 million during 2026-2030.

The Maritime Emissions Monitoring Systems market is expected to grow at a CAGR of 7.8% during 2026-2030.

Maritime Emissions Monitoring Systems market is segmented by Component (Hardware, Software, Services) Technology (Continuous emissions monitoring systems, Predictive emissions monitoring systems, Remote sensing systems, Others) End-user (Commercial ships, Passenger ships, Others)

ABB Ltd., Danfoss AS, DNV Group AS, Emerson Electric Co., ENVEA, Fuji Electric Co. Ltd., Honeywell International Inc., HORIBA Ltd., Kongsberg Gruppen ASA, KROHNE Messtechnik GmbH, Mettler Toledo Inc., Parker Hannifin Corp., Rockwell Automation Inc., Servomex Group Ltd., SICK AG, Siemens AG, Teledyne Technologies Inc., Testo SE and Co. KGaA, Vaisala Oyj, Wartsila Corp. are a few of the key vendors in the Maritime Emissions Monitoring Systems market.

APAC will register the highest growth rate of 35.1% among the other regions. Therefore, the Maritime Emissions Monitoring Systems market in APAC is expected to garner significant business opportunities for the vendors during the forecast period.

Germany, UK, France, Italy, Spain, Russia, China, Japan, South Korea, India, Australia, Indonesia, US, Canada, Mexico, Brazil, Argentina, Chile, UAE, Saudi Arabia, South Africa, Egypt, Turkey

  • Implementation of stringent international environmental mandates and emission control areas is the driving factor this market.

The Maritime Emissions Monitoring Systems market vendors should focus on grabbing business opportunities from the Component segment as it accounted for the largest market share in the base year.
RIA - Research AI Assistant
Ask RIA