Makeup Base Market Analysis, Size, and Forecast 2026-2030: APAC (China, Japan, and India), North America (US, Canada, and Mexico), Europe (Germany, UK, and France), South America (Brazil and Argentina), Middle East and Africa (South Africa, UAE, and Saudi Arabia), and Rest of World (ROW)

Makeup Base Market Analysis, Size, and Forecast 2026-2030:
APAC (China, Japan, and India), North America (US, Canada, and Mexico), Europe (Germany, UK, and France), South America (Brazil and Argentina), Middle East and Africa (South Africa, UAE, and Saudi Arabia), and Rest of World (ROW)

Published: Jan 2026 306 Pages SKU: IRTNTR74218

Market Overview at a Glance

$7.35 B
Market Opportunity
5.3%
CAGR 2025 - 2030
51.9%
APAC Growth
$10.25 B
Foundation segment 2024

Makeup Base Market Size 2026-2030

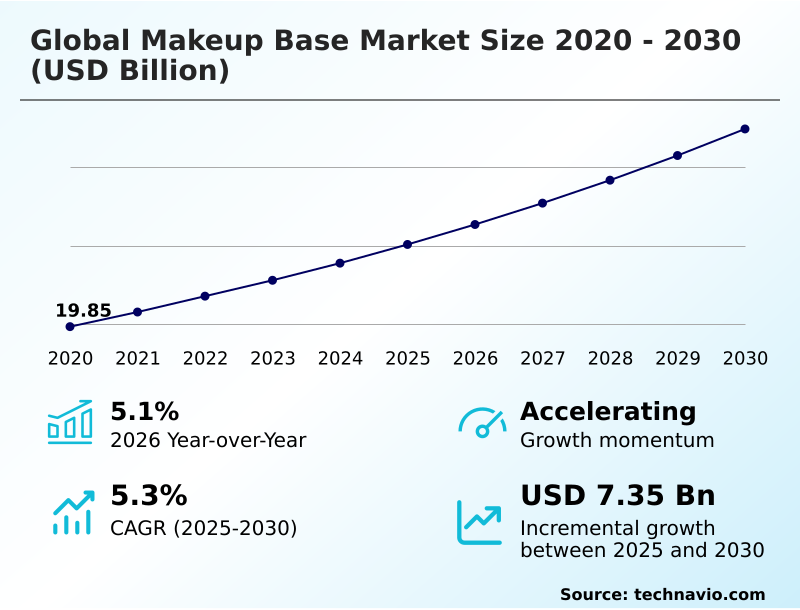
The makeup base market size is valued to increase by USD 7.35 billion, at a CAGR of 5.3% from 2025 to 2030. Rising consumer demand for multifunctional product efficacy will drive the makeup base market.

Major Market Trends & Insights

  • APAC dominated the market and accounted for a 51.9% growth during the forecast period.
  • By Product - Foundation segment was valued at USD 10.25 billion in 2024
  • By Distribution Channel - Offline segment accounted for the largest market revenue share in 2024

Market Size & Forecast

  • Market Opportunities: USD 12.58 billion
  • Market Future Opportunities: USD 7.35 billion
  • CAGR from 2025 to 2030 : 5.3%

Market Summary

  • The makeup base market is undergoing a significant evolution, driven by the convergence of cosmetics and dermatological science. This trend, often called the skinification of makeup, has shifted consumer expectations toward hybrid formulations that offer both aesthetic enhancement and tangible skincare benefits. Demand is high for products that provide long-wear technology and pore blurring while delivering hydration boosters.
  • This compels continuous innovation, with a focus on clean ingredient sourcing and the development of talc-free alternatives. However, the industry navigates challenges from stringent chemical restrictions, which necessitate costly reformulation of silicone-based formulations, and supply chain instability affecting raw material sourcing.
  • For instance, a brand aiming to launch a new line of non-comedogenic primers must balance the sourcing of high-performance, compliant ingredients with maintaining price-competitiveness, a complex operational challenge. Success hinges on agile adaptation to consumer demands for multifunctional products, such as those with a high sun protection factor (spf), and transparent, sustainable practices.

What will be the Size of the Makeup Base Market during the forecast period?

Get Key Insights on Market Forecast (PDF) Request Free Sample

How is the Makeup Base Market Segmented?

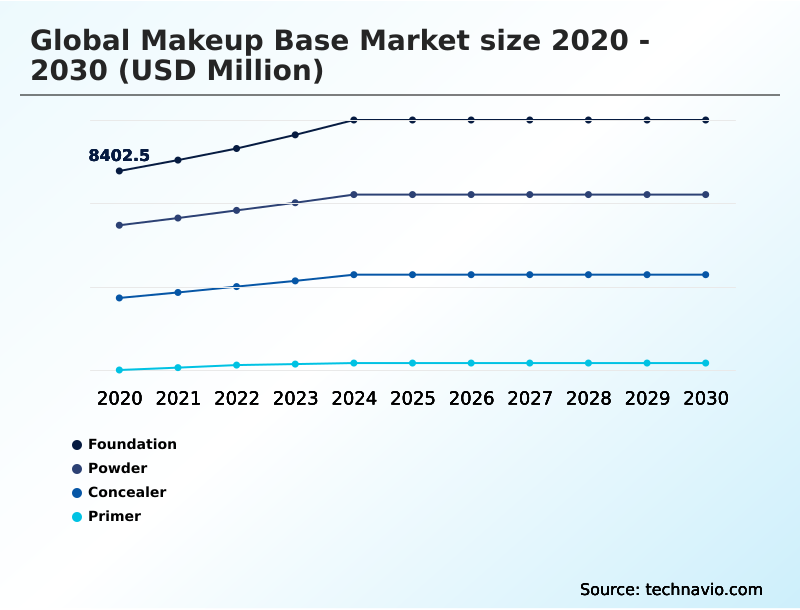
The makeup base industry research report provides comprehensive data (region-wise segment analysis), with forecasts and estimates in "USD million" for the period 2026-2030, as well as historical data from 2020-2024 for the following segments.

  • Product
    • Foundation
    • Powder
    • Concealer
    • Primer
  • Distribution channel
    • Offline
    • Online
  • Formulation
    • Silicone-based
    • Water-based
    • Oil-based
    • Others
  • Geography
    • APAC
      • China
      • Japan
      • India
    • North America
      • US
      • Canada
      • Mexico
    • Europe
      • Germany
      • UK
      • France
    • South America
      • Brazil
      • Argentina
    • Middle East and Africa
      • South Africa
      • UAE
      • Saudi Arabia
    • Rest of World (ROW)

By Product Insights

The foundation segment is estimated to witness significant growth during the forecast period.

The global makeup base market is segmented by product, distribution channel, formulation, and geography. The foundation segment is undergoing a significant transformation driven by the skinification of makeup, where hybrid formulations are paramount.

Modern consumers demand multifunctional product efficacy, seeking products that combine high-coverage targeting with dermo-cosmetics benefits. This has led to a rise in water-based formulations and oil-based formulations that offer skincare properties.

The clean beauty movement and the influence of user-generated content are compelling brands to offer inclusive shade ranges and transparent ingredient lists.

To address online purchasing hurdles, the adoption of virtual try-on tools and AI-driven shade finders has improved product matching accuracy by over 25%, enhancing consumer confidence in a market that also embraces techniques like the baked aesthetic.

Request Free Sample

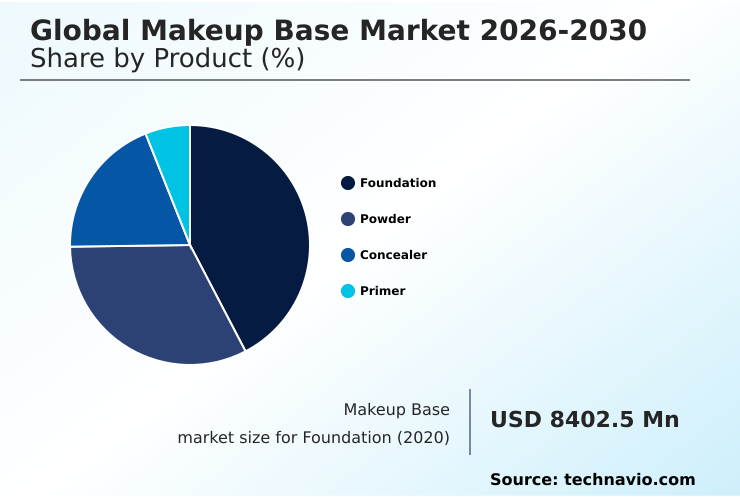
The Foundation segment was valued at USD 10.25 billion in 2024 and showed a gradual increase during the forecast period.

Request Free Sample

Regional Analysis

APAC is estimated to contribute 51.9% to the growth of the global market during the forecast period.Technavio’s analysts have elaborately explained the regional trends and drivers that shape the market during the forecast period.

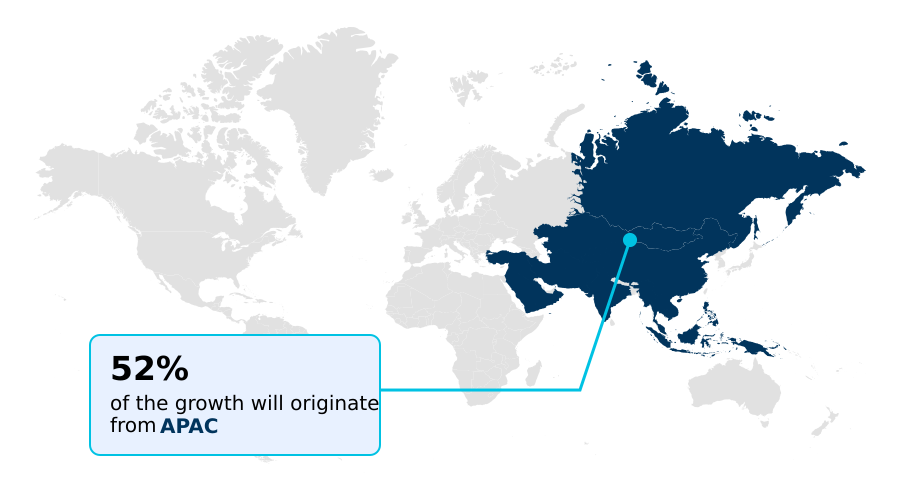
See How Makeup Base Market Demand is Rising in APAC Request Free Sample

The geographic landscape of the global makeup base market is diverse, with APAC poised to contribute over 51% of the market’s incremental growth.

In this region, demand is high for products offering photoprotection and incorporating biodiversity-focused ingredients like amazonian bio-actives, driven by the guochao trend and a preference for naturkosmetik principles.

In contrast, mature markets in North America and Europe focus on dermo-cosmetics and dermatological treatment.

Regional adaptation is crucial; formulations must account for local climate and cultural preferences, such as the need for halal-certified beauty products in the Middle East and Indonesia.

Innovations like solid balms and powder-to-cream technology are gaining traction globally, while a focus on eco-friendly packaging and refillable packaging concepts is becoming a key differentiator.

Adapting formulations with color-correcting pigments and hydration boosters for specific regions has been shown to reduce product complaints by over 15%.

Market Dynamics

Our researchers analyzed the data with 2025 as the base year, along with the key drivers, trends, and challenges. A holistic analysis of drivers will help companies refine their marketing strategies to gain a competitive advantage.

  • The modern consumer's search for the perfect complexion begins with a makeup base with skincare benefits, moving beyond simple aesthetics to demand functional, targeted solutions. This has created distinct market niches, such as the need for a long-wear primer for humid climates or a specialized concealer for hyperpigmentation coverage.
  • For those with specific sensitivities, a talc-free powder for sensitive skin or a silicone-free primer for acne-prone skin are no longer niche but essential offerings. Formulations are increasingly specialized, with a hydrating primer for dry skin offering a starkly different experience than a mattifying primer for oily skin.
  • The quest for the best primer for pore blurring has driven innovation in textures, while the oil-control setting powder benefits are a key selling point for longevity. Technology is also pivotal, with the AI tool for foundation shade matching becoming a crucial part of the online shopping experience.
  • Consumers are now more aware of ingredients, seeking out biotech ingredients in cosmetic primers and demanding vegan and cruelty-free primers. Brands focusing on sustainable packaging for makeup are seeing customer loyalty rates that are nearly double those that do not, impacting long-term brand equity.
  • Furthermore, cultural and lifestyle needs are addressed with products like a transfer-proof foundation for masks, a color-correcting base for redness, an anti-pollution makeup base formulation, a makeup base for mature skin, a primer with high spf protection, and halal-certified foundation and primer options, alongside the rise of gender-neutral makeup base products.

What are the key market drivers leading to the rise in the adoption of Makeup Base Industry?

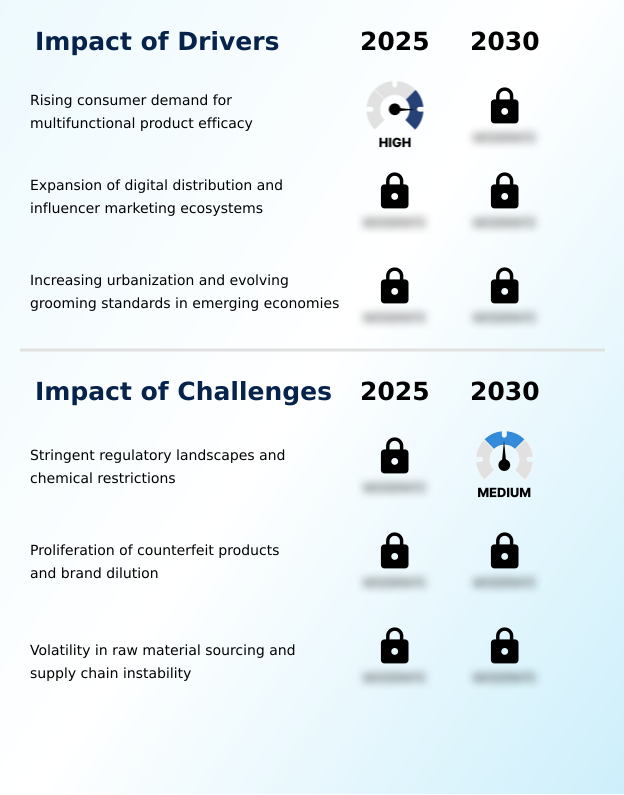
  • A key driver of the market is the rising consumer demand for products with multifunctional product efficacy.

  • Market growth is fueled by the demand for multifunctional products that combine cosmetic and skincare benefits, such as a high sun protection factor (SPF).
  • Products that offer long-wear technology and transfer-proof technologies are seeing a 25% higher adoption rate than single-function items.
  • The influence of digital distribution and influencer marketing is paramount, with social media campaigns driving sales lifts up to 40% higher than conventional advertising.
  • The visual appeal of products that offer pore blurring, sebum control, and create an illuminating creams effect makes them ideal for viral marketing. This is further amplified by celebrity endorsements and the integration of phygital retail experiences.
  • Brands are also leveraging live-stream shopping and subscription services to build customer loyalty, offering specialized formulations like mattifying gels to targeted demographics.

What are the market trends shaping the Makeup Base Industry?

  • The integration of hyper-personalization and artificial intelligence diagnostics is an upcoming trend. This is poised to reshape product recommendations and consumer engagement.

  • Key trends are reshaping the market, led by hyper-personalization through AI diagnostics. This technology improves shade matching accuracy by up to 30%, significantly reducing online return rates and enhancing the user experience. The rise of gender-neutral cosmetics is expanding the consumer base, while the shift toward biotechnology ingredients and lab-grown ingredients addresses sustainability concerns.
  • Formulations are evolving to deliver a glass skin trend or soft-focus finish, with grip technology in non-comedogenic primers ensuring longevity. These innovations, which include mineral-based primers, are also driving a 'lipstick effect' in the prestige category. The growth of C-beauty products also highlights regional innovation in achieving effects like under-eye brightening.
  • The adoption of these advanced trends is becoming a key differentiator for brands in a competitive landscape.

What challenges does the Makeup Base Industry face during its growth?

  • A key challenge affecting industry growth is the presence of stringent regulatory landscapes and restrictions on chemical use.

  • The market faces significant hurdles from an increasingly stringent regulatory environment, with chemical restrictions forcing costly reformulations of traditional silicone-based formulations. This can increase R&D costs by 15-20% per product line. The proliferation of counterfeit product risk, fueled by the demand for high-pigment formulations and full-coverage routines, threatens brand integrity.
  • Concurrently, supply chain instability and volatility in raw material sourcing have led to price increases of over 10% for key ingredients. The need for clean ingredient sourcing and the development of talc-free alternatives adds further complexity.
  • Even with a pivot to mineral-based primers and climate-resilient primers, brands must navigate logistical challenges, including the reliability of direct-selling distribution and social selling models, especially when sourcing specialized amazonian bio-actives and ensuring heat resistance testing for global markets.

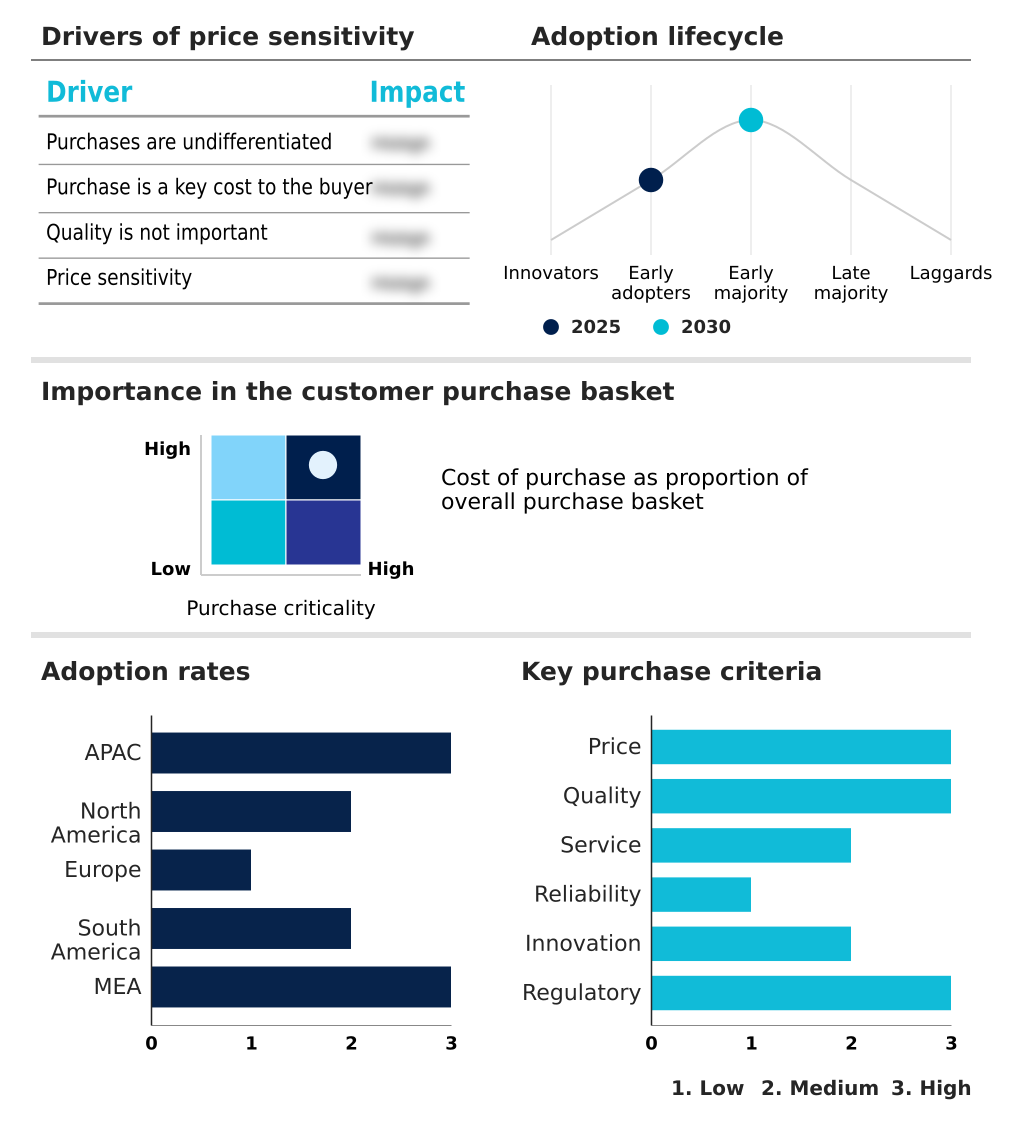
Exclusive Technavio Analysis on Customer Landscape

The makeup base market forecasting report includes the adoption lifecycle of the market, covering from the innovator’s stage to the laggard’s stage. It focuses on adoption rates in different regions based on penetration. Furthermore, the makeup base market report also includes key purchase criteria and drivers of price sensitivity to help companies evaluate and develop their market growth analysis strategies.

Customer Landscape of Makeup Base Industry

Competitive Landscape

Companies are implementing various strategies, such as strategic alliances, makeup base market forecast, partnerships, mergers and acquisitions, geographical expansion, and product/service launches, to enhance their presence in the industry.

Amorepacific Corp. - The market is defined by a comprehensive portfolio of foundations, concealers, primers, and powders, with innovative formulations addressing diverse consumer needs for complexion and skincare benefits.

The industry research and growth report includes detailed analyses of the competitive landscape of the market and information about key companies, including:

  • Amorepacific Corp.
  • Anastasia Beverly Hills LLC
  • Avon Products
  • Boohoo Group Plc
  • Chanel Ltd.
  • Coty Inc.
  • Groupe Clarins
  • Indigo Private Label
  • Kao Corp.
  • Kose Corp.
  • LADY BURD
  • LOreal SA
  • LVMH Moet Hennessy
  • Mary Kay Inc.
  • Natura and Co Holding SA
  • PINNACLE COSMETICS
  • Shiseido Co. Ltd.
  • The Estee Lauder Co. Inc.
  • Unilever PLC
  • Vellvette Lifestyle Pvt. Ltd.

Qualitative and quantitative analysis of companies has been conducted to help clients understand the wider business environment as well as the strengths and weaknesses of key industry players. Data is qualitatively analyzed to categorize companies as pure play, category-focused, industry-focused, and diversified; it is quantitatively analyzed to categorize companies as dominant, leading, strong, tentative, and weak.

Recent Development and News in Makeup base market

  • In February, 2025, e.l.f. Beauty capitalized on the viral social media success of its Power Grip Primer by purchasing a commercial spot during the Super Bowl, elevating the product to a mass-market staple.
  • In January, 2025, LOreal Groupe unveiled its Beauty Genius application at the Consumer Electronics Show (CES), a generative AI-powered personal advisor designed to provide hyper-personalized skin diagnostics and makeup base recommendations.
  • In January, 2025, Shiseido Co. Ltd. announced a strategic expansion of its Global Suncare and Makeup Base portfolio, highlighting its Sun Dual Care technology that converts UV rays into beneficial light for the skin.
  • In January, 2025, The Estee Lauder Co. Inc. joined an initiative with other luxury goods manufacturers to combat the rising threat of counterfeit cosmetics, emphasizing the need for enhanced digital intellectual property protection.

Dive into Technavio’s robust research methodology, blending expert interviews, extensive data synthesis, and validated models for unparalleled Makeup Base Market insights. See full methodology.

Market Scope
Page number 306
Base year 2025
Historic period 2020-2024
Forecast period 2026-2030
Growth momentum & CAGR Accelerate at a CAGR of 5.3%
Market growth 2026-2030 USD 7350.1 million
Market structure Fragmented
YoY growth 2025-2026(%) 5.1%
Key countries China, Japan, India, South Korea, Australia, Indonesia, US, Canada, Mexico, Germany, UK, France, Italy, Spain, The Netherlands, Brazil, Argentina, Chile, South Africa, UAE, Saudi Arabia, Egypt and Turkey
Competitive landscape Leading Companies, Market Positioning of Companies, Competitive Strategies, and Industry Risks

Request Free Sample

Research Analyst Overview

  • The global makeup base market is advancing beyond traditional cosmetics, defined by the principle of skinification of makeup, where hybrid formulations merge dermo-cosmetics with aesthetic functions. Key boardroom decisions now center on R&D investment in clean ingredient sourcing and talc-free alternatives, driven by the clean beauty movement and tightening regulations.
  • While silicone-based formulations remain popular for their performance, the strategic pivot to water-based formulations and oil-based formulations with multifunctional product efficacy is critical for long-term growth. The market sees a demand for a range of finishes, from a baked aesthetic to a soft-focus finish, and high-coverage targeting.
  • Brands are leveraging virtual try-on tools and AI-driven shade finders to create inclusive shade ranges, a non-negotiable aspect of modern branding. For example, reformulation efforts to meet new standards, while increasing initial costs, have been shown to improve brand perception and lead to a 10% increase in repeat purchases among key demographics.
  • The influence of user-generated content continues to shape demand for products that deliver on promises of performance and ingredient transparency.

What are the Key Data Covered in this Makeup Base Market Research and Growth Report?

  • What is the expected growth of the Makeup Base Market between 2026 and 2030?

    • USD 7.35 billion, at a CAGR of 5.3%

  • What segmentation does the market report cover?

    • The report is segmented by Product (Foundation, Powder, Concealer, and Primer), Distribution Channel (Offline, and Online), Formulation (Silicone-based, Water-based, Oil-based, and Others) and Geography (APAC, North America, Europe, South America, Middle East and Africa)

  • Which regions are analyzed in the report?

    • APAC, North America, Europe, South America and Middle East and Africa

  • What are the key growth drivers and market challenges?

    • Rising consumer demand for multifunctional product efficacy, Stringent regulatory landscapes and chemical restrictions

  • Who are the major players in the Makeup Base Market?

    • Amorepacific Corp., Anastasia Beverly Hills LLC, Avon Products, Boohoo Group Plc, Chanel Ltd., Coty Inc., Groupe Clarins, Indigo Private Label, Kao Corp., Kose Corp., LADY BURD, LOreal SA, LVMH Moet Hennessy, Mary Kay Inc., Natura and Co Holding SA, PINNACLE COSMETICS, Shiseido Co. Ltd., The Estee Lauder Co. Inc., Unilever PLC and Vellvette Lifestyle Pvt. Ltd.

Market Research Insights

  • The market's dynamic nature is shaped by the rapid adoption of digital technologies and shifting consumer values. The use of AI diagnostics for hyper-personalization is becoming standard, with some brands reporting a 20% improvement in customer satisfaction due to more accurate product matches.
  • This is complemented by the power of influencer marketing and celebrity endorsements, which can drive engagement rates up to three times higher than traditional digital ads. The clean beauty movement continues to gain momentum, pushing demand for biotechnology ingredients and lab-grown ingredients. This is supported by a push for eco-friendly packaging, as consumers increasingly prioritize sustainability.
  • Furthermore, the rise of gender-neutral cosmetics is expanding the addressable market, unlocking new revenue streams. These forces are creating a highly competitive environment where innovation in both formulation and marketing is critical for success.

We can help! Our analysts can customize this makeup base market research report to meet your requirements.

Get in touch

1. Executive Summary

1.1 Market overview

Executive Summary - Chart on Market Overview
Executive Summary - Data Table on Market Overview
Executive Summary - Chart on Global Market Characteristics
Executive Summary - Chart on Market by Geography
Executive Summary - Chart on Market Segmentation by Product
Executive Summary - Chart on Market Segmentation by Distribution Channel
Executive Summary - Chart on Market Segmentation by Formulation
Executive Summary - Chart on Incremental Growth
Executive Summary - Data Table on Incremental Growth
Executive Summary - Chart on Company Market Positioning

2. Technavio Analysis

2.1 Analysis of price sensitivity, lifecycle, customer purchase basket, adoption rates, and purchase criteria

2.2 Criticality of inputs and Factors of differentiation

Chart on Overview on criticality of inputs and factors of differentiation

2.3 Factors of disruption

Chart on Overview on factors of disruption

2.4 Impact of drivers and challenges

Chart on Impact of drivers and challenges in 2025 and 2030

3. Market Landscape

3.1 Market ecosystem

Chart on Parent Market
Data Table on - Parent Market

3.2 Market characteristics

Chart on Market characteristics analysis

3.3 Value chain analysis

Chart on Value chain analysis

4. Market Sizing

4.1 Market definition

Data Table on Offerings of companies included in the market definition

4.2 Market segment analysis

Market segments

4.3 Market size 2025

4.4 Market outlook: Forecast for 2025-2030

Chart on Global - Market size and forecast 2025-2030 ($ million)
Data Table on Global - Market size and forecast 2025-2030 ($ million)
Chart on Global Market: Year-over-year growth 2025-2030 (%)
Data Table on Global Market: Year-over-year growth 2025-2030 (%)

5. Historic Market Size

5.1 Global Makeup Base Market 2020 - 2024

Historic Market Size - Data Table on Global Makeup Base Market 2020 - 2024 ($ million)

5.2 Product segment analysis 2020 - 2024

Historic Market Size - Product Segment 2020 - 2024 ($ million)

5.3 Distribution Channel segment analysis 2020 - 2024

Historic Market Size - Distribution Channel Segment 2020 - 2024 ($ million)

5.4 Formulation segment analysis 2020 - 2024

Historic Market Size - Formulation Segment 2020 - 2024 ($ million)

5.5 Geography segment analysis 2020 - 2024

Historic Market Size - Geography Segment 2020 - 2024 ($ million)

5.6 Country segment analysis 2020 - 2024

Historic Market Size - Country Segment 2020 - 2024 ($ million)

6. Qualitative Analysis

6.1 Impact of AI on global makeup base market

7. Five Forces Analysis

7.1 Five forces summary

Five forces analysis - Comparison between 2025 and 2030

7.2 Bargaining power of buyers

Bargaining power of buyers - Impact of key factors 2025 and 2030

7.3 Bargaining power of suppliers

Bargaining power of suppliers - Impact of key factors in 2025 and 2030

7.4 Threat of new entrants

Threat of new entrants - Impact of key factors in 2025 and 2030

7.5 Threat of substitutes

Threat of substitutes - Impact of key factors in 2025 and 2030

7.6 Threat of rivalry

Threat of rivalry - Impact of key factors in 2025 and 2030

7.7 Market condition

Chart on Market condition - Five forces 2025 and 2030

8. Market Segmentation by Product

8.1 Market segments

Chart on Product - Market share 2025-2030 (%)
Data Table on Product - Market share 2025-2030 (%)

8.2 Comparison by Product

Chart on Comparison by Product
Data Table on Comparison by Product

8.3 Foundation - Market size and forecast 2025-2030

Chart on Foundation - Market size and forecast 2025-2030 ($ million)
Data Table on Foundation - Market size and forecast 2025-2030 ($ million)
Chart on Foundation - Year-over-year growth 2025-2030 (%)
Data Table on Foundation - Year-over-year growth 2025-2030 (%)

8.4 Powder - Market size and forecast 2025-2030

Chart on Powder - Market size and forecast 2025-2030 ($ million)
Data Table on Powder - Market size and forecast 2025-2030 ($ million)
Chart on Powder - Year-over-year growth 2025-2030 (%)
Data Table on Powder - Year-over-year growth 2025-2030 (%)

8.5 Concealer - Market size and forecast 2025-2030

Chart on Concealer - Market size and forecast 2025-2030 ($ million)
Data Table on Concealer - Market size and forecast 2025-2030 ($ million)
Chart on Concealer - Year-over-year growth 2025-2030 (%)
Data Table on Concealer - Year-over-year growth 2025-2030 (%)

8.6 Primer - Market size and forecast 2025-2030

Chart on Primer - Market size and forecast 2025-2030 ($ million)
Data Table on Primer - Market size and forecast 2025-2030 ($ million)
Chart on Primer - Year-over-year growth 2025-2030 (%)
Data Table on Primer - Year-over-year growth 2025-2030 (%)

8.7 Market opportunity by Product

Market opportunity by Product ($ million)
Data Table on Market opportunity by Product ($ million)

9. Market Segmentation by Distribution Channel

9.1 Market segments

Chart on Distribution Channel - Market share 2025-2030 (%)
Data Table on Distribution Channel - Market share 2025-2030 (%)

9.2 Comparison by Distribution Channel

Chart on Comparison by Distribution Channel
Data Table on Comparison by Distribution Channel

9.3 Offline - Market size and forecast 2025-2030

Chart on Offline - Market size and forecast 2025-2030 ($ million)
Data Table on Offline - Market size and forecast 2025-2030 ($ million)
Chart on Offline - Year-over-year growth 2025-2030 (%)
Data Table on Offline - Year-over-year growth 2025-2030 (%)

9.4 Online - Market size and forecast 2025-2030

Chart on Online - Market size and forecast 2025-2030 ($ million)
Data Table on Online - Market size and forecast 2025-2030 ($ million)
Chart on Online - Year-over-year growth 2025-2030 (%)
Data Table on Online - Year-over-year growth 2025-2030 (%)

9.5 Market opportunity by Distribution Channel

Market opportunity by Distribution Channel ($ million)
Data Table on Market opportunity by Distribution Channel ($ million)

10. Market Segmentation by Formulation

10.1 Market segments

Chart on Formulation - Market share 2025-2030 (%)
Data Table on Formulation - Market share 2025-2030 (%)

10.2 Comparison by Formulation

Chart on Comparison by Formulation
Data Table on Comparison by Formulation

10.3 Silicone-based - Market size and forecast 2025-2030

Chart on Silicone-based - Market size and forecast 2025-2030 ($ million)
Data Table on Silicone-based - Market size and forecast 2025-2030 ($ million)
Chart on Silicone-based - Year-over-year growth 2025-2030 (%)
Data Table on Silicone-based - Year-over-year growth 2025-2030 (%)

10.4 Water-based - Market size and forecast 2025-2030

Chart on Water-based - Market size and forecast 2025-2030 ($ million)
Data Table on Water-based - Market size and forecast 2025-2030 ($ million)
Chart on Water-based - Year-over-year growth 2025-2030 (%)
Data Table on Water-based - Year-over-year growth 2025-2030 (%)

10.5 Oil-based - Market size and forecast 2025-2030

Chart on Oil-based - Market size and forecast 2025-2030 ($ million)
Data Table on Oil-based - Market size and forecast 2025-2030 ($ million)
Chart on Oil-based - Year-over-year growth 2025-2030 (%)
Data Table on Oil-based - Year-over-year growth 2025-2030 (%)

10.6 Others - Market size and forecast 2025-2030

Chart on Others - Market size and forecast 2025-2030 ($ million)
Data Table on Others - Market size and forecast 2025-2030 ($ million)
Chart on Others - Year-over-year growth 2025-2030 (%)
Data Table on Others - Year-over-year growth 2025-2030 (%)

10.7 Market opportunity by Formulation

Market opportunity by Formulation ($ million)
Data Table on Market opportunity by Formulation ($ million)

11. Customer Landscape

11.1 Customer landscape overview

Analysis of price sensitivity, lifecycle, customer purchase basket, adoption rates, and purchase criteria

12. Geographic Landscape

12.1 Geographic segmentation

Chart on Market share by geography 2025-2030 (%)
Data Table on Market share by geography 2025-2030 (%)

12.2 Geographic comparison

Chart on Geographic comparison
Data Table on Geographic comparison

12.3 APAC - Market size and forecast 2025-2030

Chart on APAC - Market size and forecast 2025-2030 ($ million)
Data Table on APAC - Market size and forecast 2025-2030 ($ million)
Chart on APAC - Year-over-year growth 2025-2030 (%)
Data Table on APAC - Year-over-year growth 2025-2030 (%)
Chart on Regional Comparison - APAC
Data Table on Regional Comparison - APAC

12.3.1 China - Market size and forecast 2025-2030

Chart on China - Market size and forecast 2025-2030 ($ million)
Data Table on China - Market size and forecast 2025-2030 ($ million)
Chart on China - Year-over-year growth 2025-2030 (%)
Data Table on China - Year-over-year growth 2025-2030 (%)

12.3.2 Japan - Market size and forecast 2025-2030

Chart on Japan - Market size and forecast 2025-2030 ($ million)
Data Table on Japan - Market size and forecast 2025-2030 ($ million)
Chart on Japan - Year-over-year growth 2025-2030 (%)
Data Table on Japan - Year-over-year growth 2025-2030 (%)

12.3.3 India - Market size and forecast 2025-2030

Chart on India - Market size and forecast 2025-2030 ($ million)
Data Table on India - Market size and forecast 2025-2030 ($ million)
Chart on India - Year-over-year growth 2025-2030 (%)
Data Table on India - Year-over-year growth 2025-2030 (%)

12.3.4 South Korea - Market size and forecast 2025-2030

Chart on South Korea - Market size and forecast 2025-2030 ($ million)
Data Table on South Korea - Market size and forecast 2025-2030 ($ million)
Chart on South Korea - Year-over-year growth 2025-2030 (%)
Data Table on South Korea - Year-over-year growth 2025-2030 (%)

12.3.5 Australia - Market size and forecast 2025-2030

Chart on Australia - Market size and forecast 2025-2030 ($ million)
Data Table on Australia - Market size and forecast 2025-2030 ($ million)
Chart on Australia - Year-over-year growth 2025-2030 (%)
Data Table on Australia - Year-over-year growth 2025-2030 (%)

12.3.6 Indonesia - Market size and forecast 2025-2030

Chart on Indonesia - Market size and forecast 2025-2030 ($ million)
Data Table on Indonesia - Market size and forecast 2025-2030 ($ million)
Chart on Indonesia - Year-over-year growth 2025-2030 (%)
Data Table on Indonesia - Year-over-year growth 2025-2030 (%)

12.4 North America - Market size and forecast 2025-2030

Chart on North America - Market size and forecast 2025-2030 ($ million)
Data Table on North America - Market size and forecast 2025-2030 ($ million)
Chart on North America - Year-over-year growth 2025-2030 (%)
Data Table on North America - Year-over-year growth 2025-2030 (%)
Chart on Regional Comparison - North America
Data Table on Regional Comparison - North America

12.4.1 US - Market size and forecast 2025-2030

Chart on US - Market size and forecast 2025-2030 ($ million)
Data Table on US - Market size and forecast 2025-2030 ($ million)
Chart on US - Year-over-year growth 2025-2030 (%)
Data Table on US - Year-over-year growth 2025-2030 (%)

12.4.2 Canada - Market size and forecast 2025-2030

Chart on Canada - Market size and forecast 2025-2030 ($ million)
Data Table on Canada - Market size and forecast 2025-2030 ($ million)
Chart on Canada - Year-over-year growth 2025-2030 (%)
Data Table on Canada - Year-over-year growth 2025-2030 (%)

12.4.3 Mexico - Market size and forecast 2025-2030

Chart on Mexico - Market size and forecast 2025-2030 ($ million)
Data Table on Mexico - Market size and forecast 2025-2030 ($ million)
Chart on Mexico - Year-over-year growth 2025-2030 (%)
Data Table on Mexico - Year-over-year growth 2025-2030 (%)

12.5 Europe - Market size and forecast 2025-2030

Chart on Europe - Market size and forecast 2025-2030 ($ million)
Data Table on Europe - Market size and forecast 2025-2030 ($ million)
Chart on Europe - Year-over-year growth 2025-2030 (%)
Data Table on Europe - Year-over-year growth 2025-2030 (%)
Chart on Regional Comparison - Europe
Data Table on Regional Comparison - Europe

12.5.1 Germany - Market size and forecast 2025-2030

Chart on Germany - Market size and forecast 2025-2030 ($ million)
Data Table on Germany - Market size and forecast 2025-2030 ($ million)
Chart on Germany - Year-over-year growth 2025-2030 (%)
Data Table on Germany - Year-over-year growth 2025-2030 (%)

12.5.2 UK - Market size and forecast 2025-2030

Chart on UK - Market size and forecast 2025-2030 ($ million)
Data Table on UK - Market size and forecast 2025-2030 ($ million)
Chart on UK - Year-over-year growth 2025-2030 (%)
Data Table on UK - Year-over-year growth 2025-2030 (%)

12.5.3 France - Market size and forecast 2025-2030

Chart on France - Market size and forecast 2025-2030 ($ million)
Data Table on France - Market size and forecast 2025-2030 ($ million)
Chart on France - Year-over-year growth 2025-2030 (%)
Data Table on France - Year-over-year growth 2025-2030 (%)

12.5.4 Italy - Market size and forecast 2025-2030

Chart on Italy - Market size and forecast 2025-2030 ($ million)
Data Table on Italy - Market size and forecast 2025-2030 ($ million)
Chart on Italy - Year-over-year growth 2025-2030 (%)
Data Table on Italy - Year-over-year growth 2025-2030 (%)

12.5.5 Spain - Market size and forecast 2025-2030

Chart on Spain - Market size and forecast 2025-2030 ($ million)
Data Table on Spain - Market size and forecast 2025-2030 ($ million)
Chart on Spain - Year-over-year growth 2025-2030 (%)
Data Table on Spain - Year-over-year growth 2025-2030 (%)

12.5.6 The Netherlands - Market size and forecast 2025-2030

Chart on The Netherlands - Market size and forecast 2025-2030 ($ million)
Data Table on The Netherlands - Market size and forecast 2025-2030 ($ million)
Chart on The Netherlands - Year-over-year growth 2025-2030 (%)
Data Table on The Netherlands - Year-over-year growth 2025-2030 (%)

12.6 South America - Market size and forecast 2025-2030

Chart on South America - Market size and forecast 2025-2030 ($ million)
Data Table on South America - Market size and forecast 2025-2030 ($ million)
Chart on South America - Year-over-year growth 2025-2030 (%)
Data Table on South America - Year-over-year growth 2025-2030 (%)
Chart on Regional Comparison - South America
Data Table on Regional Comparison - South America

12.6.1 Brazil - Market size and forecast 2025-2030

Chart on Brazil - Market size and forecast 2025-2030 ($ million)
Data Table on Brazil - Market size and forecast 2025-2030 ($ million)
Chart on Brazil - Year-over-year growth 2025-2030 (%)
Data Table on Brazil - Year-over-year growth 2025-2030 (%)

12.6.2 Argentina - Market size and forecast 2025-2030

Chart on Argentina - Market size and forecast 2025-2030 ($ million)
Data Table on Argentina - Market size and forecast 2025-2030 ($ million)
Chart on Argentina - Year-over-year growth 2025-2030 (%)
Data Table on Argentina - Year-over-year growth 2025-2030 (%)

12.6.3 Chile - Market size and forecast 2025-2030

Chart on Chile - Market size and forecast 2025-2030 ($ million)
Data Table on Chile - Market size and forecast 2025-2030 ($ million)
Chart on Chile - Year-over-year growth 2025-2030 (%)
Data Table on Chile - Year-over-year growth 2025-2030 (%)

12.7 Middle East and Africa - Market size and forecast 2025-2030

Chart on Middle East and Africa - Market size and forecast 2025-2030 ($ million)
Data Table on Middle East and Africa - Market size and forecast 2025-2030 ($ million)
Chart on Middle East and Africa - Year-over-year growth 2025-2030 (%)
Data Table on Middle East and Africa - Year-over-year growth 2025-2030 (%)
Chart on Regional Comparison - Middle East and Africa
Data Table on Regional Comparison - Middle East and Africa

12.7.1 South Africa - Market size and forecast 2025-2030

Chart on South Africa - Market size and forecast 2025-2030 ($ million)
Data Table on South Africa - Market size and forecast 2025-2030 ($ million)
Chart on South Africa - Year-over-year growth 2025-2030 (%)
Data Table on South Africa - Year-over-year growth 2025-2030 (%)

12.7.2 UAE - Market size and forecast 2025-2030

Chart on UAE - Market size and forecast 2025-2030 ($ million)
Data Table on UAE - Market size and forecast 2025-2030 ($ million)
Chart on UAE - Year-over-year growth 2025-2030 (%)
Data Table on UAE - Year-over-year growth 2025-2030 (%)

12.7.3 Saudi Arabia - Market size and forecast 2025-2030

Chart on Saudi Arabia - Market size and forecast 2025-2030 ($ million)
Data Table on Saudi Arabia - Market size and forecast 2025-2030 ($ million)
Chart on Saudi Arabia - Year-over-year growth 2025-2030 (%)
Data Table on Saudi Arabia - Year-over-year growth 2025-2030 (%)

12.7.4 Egypt - Market size and forecast 2025-2030

Chart on Egypt - Market size and forecast 2025-2030 ($ million)
Data Table on Egypt - Market size and forecast 2025-2030 ($ million)
Chart on Egypt - Year-over-year growth 2025-2030 (%)
Data Table on Egypt - Year-over-year growth 2025-2030 (%)

12.7.5 Turkey - Market size and forecast 2025-2030

Chart on Turkey - Market size and forecast 2025-2030 ($ million)
Data Table on Turkey - Market size and forecast 2025-2030 ($ million)
Chart on Turkey - Year-over-year growth 2025-2030 (%)
Data Table on Turkey - Year-over-year growth 2025-2030 (%)

12.8 Market opportunity by geography

Market opportunity by geography ($ million)
Data Tables on Market opportunity by geography ($ million)

13. Drivers, Challenges, and Opportunity

13.1 Market drivers

Rising consumer demand for multifunctional product efficacy
Expansion of digital distribution and influencer marketing ecosystems
Increasing urbanization and evolving grooming standards in emerging economies

13.2 Market challenges

Stringent regulatory landscapes and chemical restrictions
Proliferation of counterfeit products and brand dilution
Volatility in raw material sourcing and supply chain instability

13.3 Impact of drivers and challenges

Impact of drivers and challenges in 2025 and 2030

13.4 Market opportunities

Integration of hyper-personalization and artificial intelligence diagnostics
Mainstreaming of gender-neutral and men cosmetic solutions
Shift toward biotechnology and lab-grown ingredients

14. Competitive Landscape

14.1 Overview

14.2

Overview on criticality of inputs and factors of differentiation

14.3 Landscape disruption

Overview on factors of disruption

14.4 Industry risks

Impact of key risks on business

15. Competitive Analysis

15.1 Companies profiled

Companies covered

15.2 Company ranking index

15.3 Market positioning of companies

Matrix on companies position and classification

15.4 Amorepacific Corp.

Amorepacific Corp. - Overview
Amorepacific Corp. - Business segments
Amorepacific Corp. - Key news
Amorepacific Corp. - Key offerings
Amorepacific Corp. - Segment focus
SWOT

15.5 Anastasia Beverly Hills LLC

Anastasia Beverly Hills LLC - Overview
Anastasia Beverly Hills LLC - Product / Service
Anastasia Beverly Hills LLC - Key offerings
SWOT

15.6 Avon Products

Avon Products - Overview
Avon Products - Product / Service
Avon Products - Key offerings
SWOT

15.7 Chanel Ltd.

Chanel Ltd. - Overview
Chanel Ltd. - Product / Service
Chanel Ltd. - Key offerings
SWOT

15.8 Coty Inc.

Coty Inc. - Overview
Coty Inc. - Business segments
Coty Inc. - Key news
Coty Inc. - Key offerings
Coty Inc. - Segment focus
SWOT

15.9 Groupe Clarins

Groupe Clarins - Overview
Groupe Clarins - Product / Service
Groupe Clarins - Key offerings
SWOT

15.10 Kao Corp.

Kao Corp. - Overview
Kao Corp. - Business segments
Kao Corp. - Key news
Kao Corp. - Key offerings
Kao Corp. - Segment focus
SWOT

15.11 Kose Corp.

Kose Corp. - Overview
Kose Corp. - Product / Service
Kose Corp. - Key offerings
SWOT

15.12 LOreal SA

LOreal SA - Overview
LOreal SA - Business segments
LOreal SA - Key news
LOreal SA - Key offerings
LOreal SA - Segment focus
SWOT

15.13 LVMH Moet Hennessy

LVMH Moet Hennessy - Overview
LVMH Moet Hennessy - Business segments
LVMH Moet Hennessy - Key news
LVMH Moet Hennessy - Key offerings
LVMH Moet Hennessy - Segment focus
SWOT

15.14 Mary Kay Inc.

Mary Kay Inc. - Overview
Mary Kay Inc. - Product / Service
Mary Kay Inc. - Key offerings
SWOT

15.15 Natura and Co Holding SA

Natura and Co Holding SA - Overview
Natura and Co Holding SA - Business segments
Natura and Co Holding SA - Key offerings
Natura and Co Holding SA - Segment focus
SWOT

15.16 Shiseido Co. Ltd.

Shiseido Co. Ltd. - Overview
Shiseido Co. Ltd. - Business segments
Shiseido Co. Ltd. - Key news
Shiseido Co. Ltd. - Key offerings
Shiseido Co. Ltd. - Segment focus
SWOT

15.17 The Estee Lauder Co. Inc.

The Estee Lauder Co. Inc. - Overview
The Estee Lauder Co. Inc. - Product / Service
The Estee Lauder Co. Inc. - Key news
The Estee Lauder Co. Inc. - Key offerings
SWOT

15.18 Unilever PLC

Unilever PLC - Overview
Unilever PLC - Business segments
Unilever PLC - Key offerings
Unilever PLC - Segment focus
SWOT

16. Appendix

16.1 Scope of the report

Market definition
Objectives
Notes and caveats

16.2 Inclusions and exclusions checklist

Inclusions checklist
Exclusions checklist

16.3 Currency conversion rates for US$

16.4 Research methodology

16.5 Data procurement

Information sources

16.6 Data validation

16.7 Validation techniques employed for market sizing

16.8 Data synthesis

16.9 360 degree market analysis

16.10 List of abbreviations

Research Methodology

Technavio presents a detailed picture of the market by way of study, synthesis, and summation of data from multiple sources. The analysts have presented the various facets of the market with a particular focus on identifying the key industry influencers. The data thus presented is comprehensive, reliable, and the result of extensive research, both primary and secondary.

INFORMATION SOURCES

Primary sources

  • Manufacturers and suppliers
  • Channel partners
  • Industry experts
  • Strategic decision makers

Secondary sources

  • Industry journals and periodicals
  • Government data
  • Financial reports of key industry players
  • Historical data
  • Press releases

DATA ANALYSIS

Data Synthesis

  • Collation of data
  • Estimation of key figures
  • Analysis of derived insights

Data Validation

  • Triangulation with data models
  • Reference against proprietary databases
  • Corroboration with industry experts

REPORT WRITING

Qualitative

  • Market drivers
  • Market challenges
  • Market trends
  • Five forces analysis

Quantitative

  • Market size and forecast
  • Market segmentation
  • Geographical insights
  • Competitive landscape

Interested in this report?

Get your sample now to see our research methodology and insights!

Download Now

Frequently Asked Questions

Makeup Base market growth will increase by USD 7350.1 million during 2026-2030.

The Makeup Base market is expected to grow at a CAGR of 5.3% during 2026-2030.

Makeup Base market is segmented by Product (Foundation, Powder, Concealer, Primer) Distribution channel (Offline, Online) Formulation (Silicone-based, Water-based, Oil-based, Others)

Amorepacific Corp., Anastasia Beverly Hills LLC, Avon Products, Boohoo Group Plc, Chanel Ltd., Coty Inc., Groupe Clarins, Indigo Private Label, Kao Corp., Kose Corp., LADY BURD, LOreal SA, LVMH Moet Hennessy, Mary Kay Inc., Natura and Co Holding SA, PINNACLE COSMETICS, Shiseido Co. Ltd., The Estee Lauder Co. Inc., Unilever PLC, Vellvette Lifestyle Pvt. Ltd. are a few of the key vendors in the Makeup Base market.

APAC will register the highest growth rate of 51.9% among the other regions. Therefore, the Makeup Base market in APAC is expected to garner significant business opportunities for the vendors during the forecast period.

China, Japan, India, South Korea, Australia, Indonesia, US, Canada, Mexico, Germany, UK, France, Italy, Spain, The Netherlands, Brazil, Argentina, Chile, South Africa, UAE, Saudi Arabia, Egypt, Turkey

  • Rising consumer demand for multifunctional product efficacy is the driving factor this market.

The Makeup Base market vendors should focus on grabbing business opportunities from the Product segment as it accounted for the largest market share in the base year.