Luxury Cosmetics Market Analysis, Size, and Forecast 2026-2030: APAC (China, Japan, and South Korea), North America (US, Canada, and Mexico), Europe (France, Italy, and Germany), Middle East and Africa (UAE, Saudi Arabia, and South Africa), South America (Brazil, Argentina, and Colombia), and Rest of World (ROW)

Luxury Cosmetics Market Analysis, Size, and Forecast 2026-2030:
APAC (China, Japan, and South Korea), North America (US, Canada, and Mexico), Europe (France, Italy, and Germany), Middle East and Africa (UAE, Saudi Arabia, and South Africa), South America (Brazil, Argentina, and Colombia), and Rest of World (ROW)

Published: Apr 2026 291 Pages SKU: IRTNTR73738

Market Overview at a Glance

$30.92 B
Market Opportunity
7.5%
CAGR 2025 - 2030
44.6%
APAC Growth
$42.93 B
Organic segment 2024

Luxury Cosmetics Market Size 2026-2030

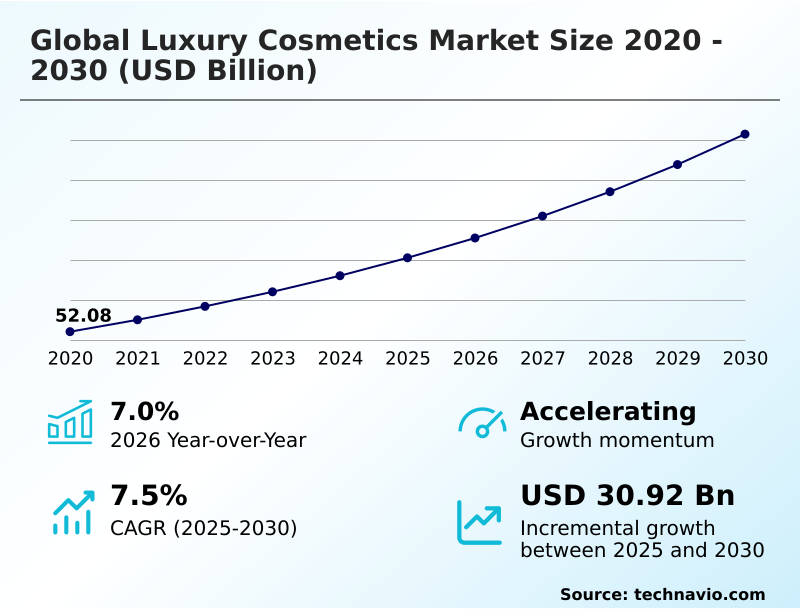
The luxury cosmetics market size is valued to increase by USD 30.92 billion, at a CAGR of 7.5% from 2025 to 2030. Increased demand for luxury skincare products will drive the luxury cosmetics market.

Major Market Trends & Insights

  • APAC dominated the market and accounted for a 44.6% growth during the forecast period.
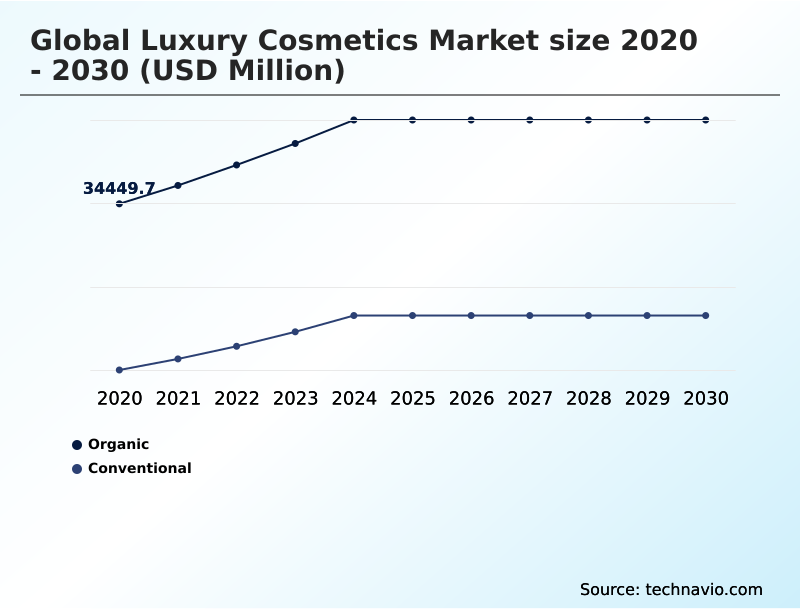
  • By Type - Organic segment was valued at USD 42.93 billion in 2024
  • By Product Type - Skincare segment accounted for the largest market revenue share in 2024

Market Size & Forecast

  • Market Opportunities: USD 49.40 billion
  • Market Future Opportunities: USD 30.92 billion
  • CAGR from 2025 to 2030 : 7.5%

Market Summary

  • The luxury cosmetics market is defined by a relentless pursuit of innovation and exclusivity. The sector thrives on advanced research, yielding products with sophisticated formulations that often incorporate bioactive peptides, nanotechnology in cosmetics, and fermented skincare ingredients.
  • A critical dynamic is the tension between heritage brand prestige and the agility required to meet modern consumer demands for transparency and sustainability, pushing for ethical sourcing of botanicals and sustainable packaging solutions.
  • For instance, a brand might leverage AI-driven supply chain platforms to ensure the traceable and ethical procurement of a rare orchid extract for a premium anti-aging serum, thereby validating its clean and ethical luxury beauty claims to consumers.
  • This marriage of science, artistry, and digital oversight allows companies to command premium prices while navigating complex challenges like ingredient stability, regulatory compliance, and the ever-present threat of counterfeit goods, ensuring high-performance skincare reaches a discerning global clientele.

What will be the Size of the Luxury Cosmetics Market during the forecast period?

Get Key Insights on Market Forecast (PDF) Request Free Sample

How is the Luxury Cosmetics Market Segmented?

The luxury cosmetics industry research report provides comprehensive data (region-wise segment analysis), with forecasts and estimates in "USD million" for the period 2026-2030, as well as historical data from 2020-2024 for the following segments.

  • Type
    • Organic
    • Conventional
  • Product type
    • Skincare
    • Makeup
    • Fragrance
    • Haircare
    • Bodycare
  • Distribution channel
    • Offline
    • Online
  • Geography
    • APAC
      • China
      • Japan
      • South Korea
    • North America
      • US
      • Canada
      • Mexico
    • Europe
      • France
      • Italy
      • Germany
    • Middle East and Africa
      • UAE
      • Saudi Arabia
      • South Africa
    • South America
      • Brazil
      • Argentina
      • Colombia
    • Rest of World (ROW)

By Type Insights

The organic segment is estimated to witness significant growth during the forecast period.

The organic segment is shifting toward online retail, driven by consumer demand for natural products and digital-first brand building. Brands are leveraging hyper-personalization in beauty, using AI to recommend products with peptide complexes and enzymatic exfoliants.

There's a growing emphasis on wellness-infused cosmetics and formulas offering blue light protection ingredients, reflecting conscious consumerism in beauty. Innovations like anhydrous formulas and bi-phase formulas are gaining traction.

Advanced delivery systems are crucial for efficacy, with some firms reporting a 20% improvement in ingredient penetration. The influence of A-beauty and J-beauty aesthetics also shapes product development, promoting transparency and minimalist, effective formulations.

Request Free Sample

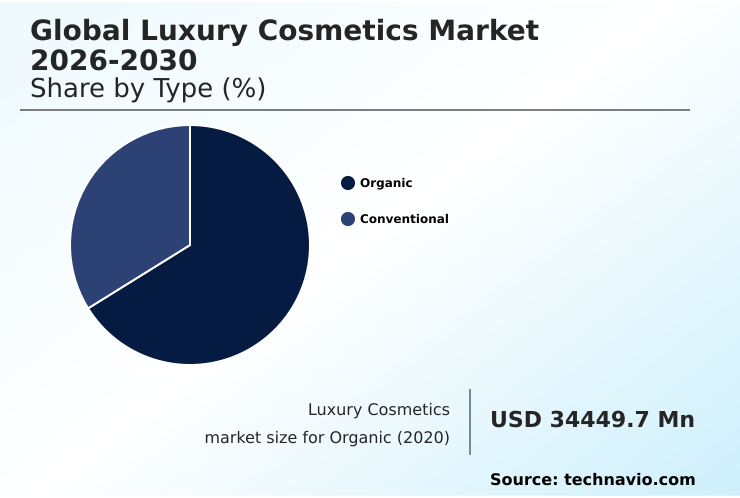
The Organic segment was valued at USD 42.93 billion in 2024 and showed a gradual increase during the forecast period.

Request Free Sample

Regional Analysis

APAC is estimated to contribute 44.6% to the growth of the global market during the forecast period.Technavio’s analysts have elaborately explained the regional trends and drivers that shape the market during the forecast period.

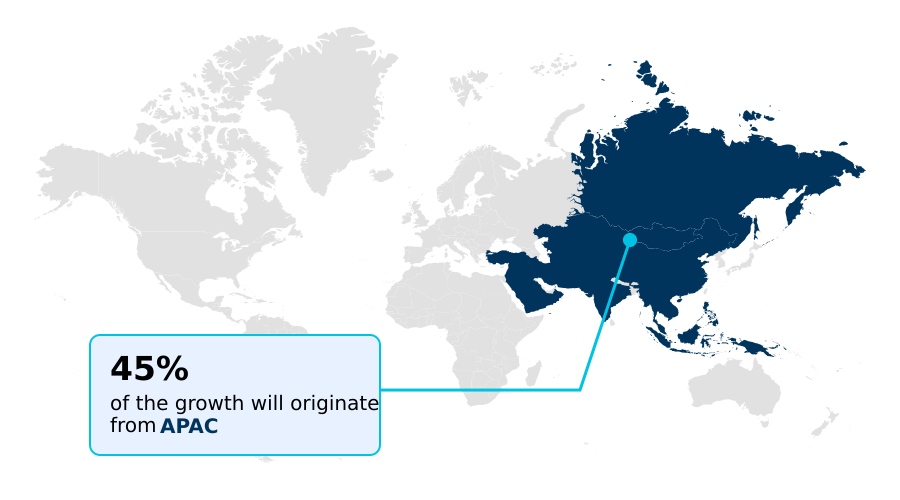
See How Luxury Cosmetics Market Demand is Rising in APAC Request Free Sample

The geographic landscape of the luxury cosmetics market is characterized by diverse regional dynamics, with APAC leading growth and contributing over 44% of the market's incremental expansion.

This region, particularly China, shows strong demand for premium anti-aging serums and prestige makeup collections, driven by a sophisticated omnichannel retail strategy.

In North America and Europe, there's a strong focus on the ethical sourcing of botanicals and sustainable innovations like waterless cosmetic formulations and upcycled cosmetic ingredients.

Brands are adapting their luxury brand positioning to meet regional preferences, such as offering personalized cosmetic solutions with silicone-free texturizers in one market while highlighting photo-stable UV filters in another.

This regional differentiation is critical for navigating exclusive distribution channels effectively.

Market Dynamics

Our researchers analyzed the data with 2025 as the base year, along with the key drivers, trends, and challenges. A holistic analysis of drivers will help companies refine their marketing strategies to gain a competitive advantage.

  • Strategic navigation of the luxury cosmetics market requires a deep understanding of evolving consumer behaviors and technological integration. The impact of social media on luxury cosmetics is undeniable, compelling brands to refine e-commerce strategies for luxury fragrance brands and other categories to foster direct engagement.
  • The rise of clean beauty in premium skincare has made supply chain transparency in luxury beauty a non-negotiable factor for building consumer trust, with brands that provide clear sourcing data seeing a 15% higher rate of repeat purchases compared to those that do not.
  • Addressing Gen Z preferences for luxury makeup involves a focus on vegan and cruelty-free luxury cosmetics growth, alongside innovations in sustainable packaging innovations in luxury beauty. Moreover, understanding the nuances of the luxury beauty market in emerging economies is key to overcoming the challenges of counterfeiting in luxury cosmetics.
  • The role of technology in luxury beauty retail, particularly through AI and AR in luxury beauty shopping, is pivotal for creating the personalized skincare in the luxury market that modern consumers demand, blending digital convenience with the exclusivity that defines the sector.

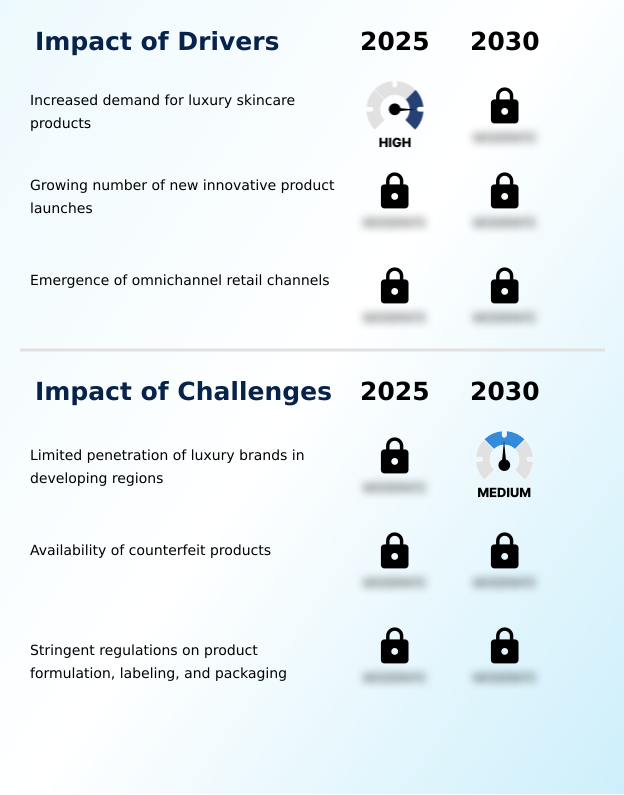
What are the key market drivers leading to the rise in the adoption of Luxury Cosmetics Industry?

  • The increasing demand for luxury skincare products, driven by consumer focus on high-quality and result-oriented solutions, serves as a key driver for market growth.

  • The increasing demand for premium skincare drives the market, fueled by the premiumization of beauty products. Consumers seek high-efficacy solutions, leading to innovations in ceramide-infused formulations and retinoid alternatives.
  • This demand supports direct-to-consumer luxury brands that showcase advanced pigment technology and fermented skincare ingredients. The men's luxury grooming products category is also expanding, with a focus on results-driven formulations.
  • The push for clean and ethical luxury beauty has made ingredient transparency a priority, with some brands achieving a 25% higher customer loyalty rate by providing clear sourcing information.
  • Custom fragrance development and travel retail exclusive cosmetics also contribute significantly to market growth by offering unique and exclusive purchasing opportunities.

What are the market trends shaping the Luxury Cosmetics Industry?

  • The expansion of online retail channels is emerging as a significant market trend, reshaping distribution strategies and consumer engagement across the industry.

  • A key trend is the rapid expansion of online retail, driven by social commerce beauty trends and the adoption of virtual try-on technology, which has improved conversion rates by over 30% in some cases. AI-powered skin diagnostics are personalizing consumer journeys, recommending products featuring bioactive peptides and encapsulated retinol.
  • This digital shift supports the growth of niche markets like vegan luxury makeup and halal-certified luxury cosmetics. Innovations in formulation, such as micellar technology and bio-fermentation processes, are highlighted through digital storytelling. Furthermore, sustainable packaging solutions are a major focus, with brands using digital platforms to communicate their eco-credentials, directly responding to consumer demand for transparency and sustainability.

What challenges does the Luxury Cosmetics Industry face during its growth?

  • The limited penetration of luxury brands in developing regions, constrained by distribution complexities and affordability, presents a key challenge to overall industry growth.

  • A primary challenge is the limited penetration of luxury brands in developing regions, which hinders access to high-performance skincare and dermatologist-recommended luxury beauty products. This is compounded by the difficulty of replicating the premium in-store experience online, impacting the appeal of niche fragrance houses and celebrity-endorsed cosmetics.
  • Furthermore, the high cost of advanced formulations using anti-glycation agents and chronobiology-based skincare principles creates affordability barriers. For instance, implementing clean beauty formulation standards can increase production costs by 15-20%. These factors, combined with complex logistics for products requiring specialized containers like airless pump packaging, restrain market expansion despite strong Gen Z luxury consumption interest.

Exclusive Technavio Analysis on Customer Landscape

The luxury cosmetics market forecasting report includes the adoption lifecycle of the market, covering from the innovator’s stage to the laggard’s stage. It focuses on adoption rates in different regions based on penetration. Furthermore, the luxury cosmetics market report also includes key purchase criteria and drivers of price sensitivity to help companies evaluate and develop their market growth analysis strategies.

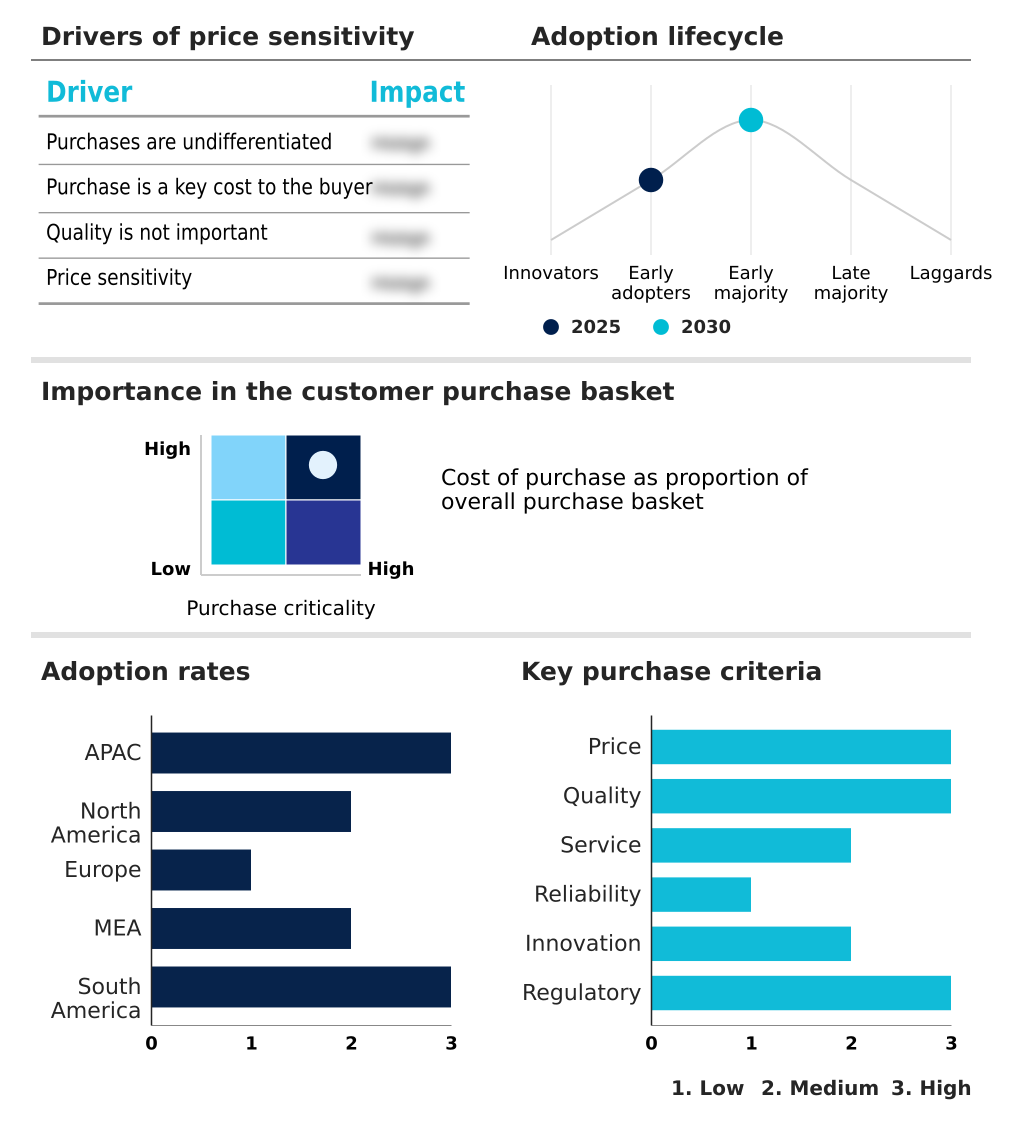
Customer Landscape of Luxury Cosmetics Industry

Competitive Landscape

Companies are implementing various strategies, such as strategic alliances, luxury cosmetics market forecast, partnerships, mergers and acquisitions, geographical expansion, and product/service launches, to enhance their presence in the industry.

Avon Products Inc. - The company's offerings span from hygiene and living care to premium cosmetics, leveraging a diversified model that balances mass-market needs with high-value beauty innovations.

The industry research and growth report includes detailed analyses of the competitive landscape of the market and information about key companies, including:

  • Avon Products Inc.
  • Chanel Ltd.
  • Christian Dior SE
  • Coty Inc.
  • Kao Corp.
  • Kose Corp.
  • La Mer Technology Inc.
  • Laura Mercier US Buyer LLC
  • Loreal SA
  • LVMH Moet Hennessy
  • Oriflame Cosmetics SA
  • Pat McGrath
  • PUIG S.L.
  • Ralph Lauren Corp.
  • Revlon Inc.
  • Shiseido Co. Ltd.
  • The Estee Lauder Co. Inc.
  • Unilever PLC

Qualitative and quantitative analysis of companies has been conducted to help clients understand the wider business environment as well as the strengths and weaknesses of key industry players. Data is qualitatively analyzed to categorize companies as pure play, category-focused, industry-focused, and diversified; it is quantitatively analyzed to categorize companies as dominant, leading, strong, tentative, and weak.

Recent Development and News in Luxury cosmetics market

  • In September 2024, Balmain Beauty launched its debut luxury fragrance collection, Les Eternels de Balmain, featuring eight all-gender eaux de parfum.
  • In November 2024, LVMH Moet Hennessy announced the strategic acquisition of a fast-growing clean-beauty startup, strengthening its portfolio in sustainable luxury skincare.
  • In February 2025, Shiseido Co. Ltd. established a premium skincare research hub in Southeast Asia to accelerate localized product development for high-growth regional markets.
  • In April 2025, The Estee Lauder Co. Inc. entered a strategic partnership with a leading AI firm to deploy advanced virtual try-on technology and personalized skin analysis tools across its global e-commerce platforms.

Dive into Technavio’s robust research methodology, blending expert interviews, extensive data synthesis, and validated models for unparalleled Luxury Cosmetics Market insights. See full methodology.

Market Scope
Page number 291
Base year 2025
Historic period 2020-2024
Forecast period 2026-2030
Growth momentum & CAGR Accelerate at a CAGR of 7.5%
Market growth 2026-2030 USD 30918.8 million
Market structure Fragmented
YoY growth 2025-2026(%) 7.0%
Key countries China, Japan, South Korea, India, Australia, Thailand, US, Canada, Mexico, France, Italy, Germany, UK, Spain, Poland, UAE, Saudi Arabia, South Africa, Turkey, Egypt, Brazil, Argentina and Colombia
Competitive landscape Leading Companies, Market Positioning of Companies, Competitive Strategies, and Industry Risks

Request Free Sample

Research Analyst Overview

  • The luxury cosmetics market is sustained by a continuous cycle of scientific advancement and strategic brand positioning. Core to this are innovations in formulation, including the use of bioactive peptides, advanced delivery systems like liposome delivery systems, and cosmetic drone technology to ensure targeted efficacy.
  • The development of retinoid alternatives and peptide complexes addresses the demand for potent anti-aging solutions without irritation. The industry is also pivoting toward sustainability through waterless cosmetic formulations, upcycled cosmetic ingredients, and biodegradable glitter alternatives.
  • For boardroom consideration, the adoption of clean beauty formulation standards, while initially increasing development costs, is directly linked to brand value and consumer trust, with firms using advanced analytics to optimize cold-process emulsification achieving a 20% reduction in energy consumption.
  • The integration of chronobiology-based skincare principles and anti-glycation agents further solidifies a brand’s scientific credibility, differentiating it in a crowded marketplace where efficacy is paramount.

What are the Key Data Covered in this Luxury Cosmetics Market Research and Growth Report?

  • What is the expected growth of the Luxury Cosmetics Market between 2026 and 2030?

    • USD 30.92 billion, at a CAGR of 7.5%

  • What segmentation does the market report cover?

    • The report is segmented by Type (Organic, and Conventional), Product Type (Skincare, Makeup, Fragrance, Haircare, and Bodycare), Distribution Channel (Offline, and Online) and Geography (APAC, North America, Europe, Middle East and Africa, South America)

  • Which regions are analyzed in the report?

    • APAC, North America, Europe, Middle East and Africa and South America

  • What are the key growth drivers and market challenges?

    • Increased demand for luxury skincare products, Limited penetration of luxury brands in developing regions

  • Who are the major players in the Luxury Cosmetics Market?

    • Avon Products Inc., Chanel Ltd., Christian Dior SE, Coty Inc., Kao Corp., Kose Corp., La Mer Technology Inc., Laura Mercier US Buyer LLC, Loreal SA, LVMH Moet Hennessy, Oriflame Cosmetics SA, Pat McGrath, PUIG S.L., Ralph Lauren Corp., Revlon Inc., Shiseido Co. Ltd., The Estee Lauder Co. Inc. and Unilever PLC

Market Research Insights

  • Market dynamics are increasingly shaped by digital transformation and a shift in consumer values. The adoption of an omnichannel retail strategy is proving critical, with integrated physical and digital touchpoints yielding customer retention rates up to 30% higher than single-channel models. Simultaneously, virtual try-on technology is revolutionizing e-commerce, boosting conversion rates by as much as 40% for prestige makeup collections.
  • This tech-driven engagement is crucial for reaching Gen Z luxury consumption segments. The focus on hyper-personalization in beauty, supported by AI-powered skin diagnostics, allows direct-to-consumer luxury brands to offer tailored regimens. This shift away from mass marketing toward individualized experiences reflects the growing influence of conscious consumerism in beauty, where product efficacy and brand ethics are paramount.

We can help! Our analysts can customize this luxury cosmetics market research report to meet your requirements.

Get in touch

1. Executive Summary

1.1 Market overview

Executive Summary - Chart on Market Overview
Executive Summary - Data Table on Market Overview
Executive Summary - Chart on Global Market Characteristics
Executive Summary - Chart on Market by Geography
Executive Summary - Chart on Market Segmentation by Type
Executive Summary - Chart on Market Segmentation by Product Type
Executive Summary - Chart on Market Segmentation by Distribution Channel
Executive Summary - Chart on Incremental Growth
Executive Summary - Data Table on Incremental Growth
Executive Summary - Chart on Company Market Positioning

2. Technavio Analysis

2.1 Analysis of price sensitivity, lifecycle, customer purchase basket, adoption rates, and purchase criteria

2.2 Criticality of inputs and Factors of differentiation

Chart on Overview on criticality of inputs and factors of differentiation

2.3 Factors of disruption

Chart on Overview on factors of disruption

2.4 Impact of drivers and challenges

Chart on Impact of drivers and challenges in 2025 and 2030

3. Market Landscape

3.1 Market ecosystem

Chart on Parent Market
Data Table on - Parent Market

3.2 Market characteristics

Chart on Market characteristics analysis

3.3 Value chain analysis

Chart on Value chain analysis

4. Market Sizing

4.1 Market definition

Data Table on Offerings of companies included in the market definition

4.2 Market segment analysis

Market segments

4.3 Market size 2025

4.4 Market outlook: Forecast for 2025-2030

Chart on Global - Market size and forecast 2025-2030 ($ million)
Data Table on Global - Market size and forecast 2025-2030 ($ million)
Chart on Global Market: Year-over-year growth 2025-2030 (%)
Data Table on Global Market: Year-over-year growth 2025-2030 (%)

5. Historic Market Size

5.1 Global Luxury Cosmetics Market 2020 - 2024

Historic Market Size - Data Table on Global Luxury Cosmetics Market 2020 - 2024 ($ million)

5.2 Type segment analysis 2020 - 2024

Historic Market Size - Type Segment 2020 - 2024 ($ million)

5.3 Product Type segment analysis 2020 - 2024

Historic Market Size - Product Type Segment 2020 - 2024 ($ million)

5.4 Distribution Channel segment analysis 2020 - 2024

Historic Market Size - Distribution Channel Segment 2020 - 2024 ($ million)

5.5 Geography segment analysis 2020 - 2024

Historic Market Size - Geography Segment 2020 - 2024 ($ million)

5.6 Country segment analysis 2020 - 2024

Historic Market Size - Country Segment 2020 - 2024 ($ million)

6. Qualitative Analysis

6.1 Impact of Geopolitical Conflicts on the Global Luxury Cosmetics Market

6.2 Impact of AI on Global Luxury Cosmetics Market

7. Five Forces Analysis

7.1 Five forces summary

Five forces analysis - Comparison between 2025 and 2030

7.2 Bargaining power of buyers

Bargaining power of buyers - Impact of key factors 2025 and 2030

7.3 Bargaining power of suppliers

Bargaining power of suppliers - Impact of key factors in 2025 and 2030

7.4 Threat of new entrants

Threat of new entrants - Impact of key factors in 2025 and 2030

7.5 Threat of substitutes

Threat of substitutes - Impact of key factors in 2025 and 2030

7.6 Threat of rivalry

Threat of rivalry - Impact of key factors in 2025 and 2030

7.7 Market condition

Chart on Market condition - Five forces 2025 and 2030

8. Market Segmentation by Type

8.1 Market segments

Chart on Type - Market share 2025-2030 (%)
Data Table on Type - Market share 2025-2030 (%)

8.2 Comparison by Type

Chart on Comparison by Type
Data Table on Comparison by Type

8.3 Organic - Market size and forecast 2025-2030

Chart on Organic - Market size and forecast 2025-2030 ($ million)
Data Table on Organic - Market size and forecast 2025-2030 ($ million)
Chart on Organic - Year-over-year growth 2025-2030 (%)
Data Table on Organic - Year-over-year growth 2025-2030 (%)

8.4 Conventional - Market size and forecast 2025-2030

Chart on Conventional - Market size and forecast 2025-2030 ($ million)
Data Table on Conventional - Market size and forecast 2025-2030 ($ million)
Chart on Conventional - Year-over-year growth 2025-2030 (%)
Data Table on Conventional - Year-over-year growth 2025-2030 (%)

8.5 Market opportunity by Type

Market opportunity by Type ($ million)
Data Table on Market opportunity by Type ($ million)

9. Market Segmentation by Product Type

9.1 Market segments

Chart on Product Type - Market share 2025-2030 (%)
Data Table on Product Type - Market share 2025-2030 (%)

9.2 Comparison by Product Type

Chart on Comparison by Product Type
Data Table on Comparison by Product Type

9.3 Skincare - Market size and forecast 2025-2030

Chart on Skincare - Market size and forecast 2025-2030 ($ million)
Data Table on Skincare - Market size and forecast 2025-2030 ($ million)
Chart on Skincare - Year-over-year growth 2025-2030 (%)
Data Table on Skincare - Year-over-year growth 2025-2030 (%)

9.4 Makeup - Market size and forecast 2025-2030

Chart on Makeup - Market size and forecast 2025-2030 ($ million)
Data Table on Makeup - Market size and forecast 2025-2030 ($ million)
Chart on Makeup - Year-over-year growth 2025-2030 (%)
Data Table on Makeup - Year-over-year growth 2025-2030 (%)

9.5 Fragrance - Market size and forecast 2025-2030

Chart on Fragrance - Market size and forecast 2025-2030 ($ million)
Data Table on Fragrance - Market size and forecast 2025-2030 ($ million)
Chart on Fragrance - Year-over-year growth 2025-2030 (%)
Data Table on Fragrance - Year-over-year growth 2025-2030 (%)

9.6 Haircare - Market size and forecast 2025-2030

Chart on Haircare - Market size and forecast 2025-2030 ($ million)
Data Table on Haircare - Market size and forecast 2025-2030 ($ million)
Chart on Haircare - Year-over-year growth 2025-2030 (%)
Data Table on Haircare - Year-over-year growth 2025-2030 (%)

9.7 Bodycare - Market size and forecast 2025-2030

Chart on Bodycare - Market size and forecast 2025-2030 ($ million)
Data Table on Bodycare - Market size and forecast 2025-2030 ($ million)
Chart on Bodycare - Year-over-year growth 2025-2030 (%)
Data Table on Bodycare - Year-over-year growth 2025-2030 (%)

9.8 Market opportunity by Product Type

Market opportunity by Product Type ($ million)
Data Table on Market opportunity by Product Type ($ million)

10. Market Segmentation by Distribution Channel

10.1 Market segments

Chart on Distribution Channel - Market share 2025-2030 (%)
Data Table on Distribution Channel - Market share 2025-2030 (%)

10.2 Comparison by Distribution Channel

Chart on Comparison by Distribution Channel
Data Table on Comparison by Distribution Channel

10.3 Offline - Market size and forecast 2025-2030

Chart on Offline - Market size and forecast 2025-2030 ($ million)
Data Table on Offline - Market size and forecast 2025-2030 ($ million)
Chart on Offline - Year-over-year growth 2025-2030 (%)
Data Table on Offline - Year-over-year growth 2025-2030 (%)

10.4 Online - Market size and forecast 2025-2030

Chart on Online - Market size and forecast 2025-2030 ($ million)
Data Table on Online - Market size and forecast 2025-2030 ($ million)
Chart on Online - Year-over-year growth 2025-2030 (%)
Data Table on Online - Year-over-year growth 2025-2030 (%)

10.5 Market opportunity by Distribution Channel

Market opportunity by Distribution Channel ($ million)
Data Table on Market opportunity by Distribution Channel ($ million)

11. Customer Landscape

11.1 Customer landscape overview

Analysis of price sensitivity, lifecycle, customer purchase basket, adoption rates, and purchase criteria

12. Geographic Landscape

12.1 Geographic segmentation

Chart on Market share by geography 2025-2030 (%)
Data Table on Market share by geography 2025-2030 (%)

12.2 Geographic comparison

Chart on Geographic comparison
Data Table on Geographic comparison

12.3 APAC - Market size and forecast 2025-2030

Chart on APAC - Market size and forecast 2025-2030 ($ million)
Data Table on APAC - Market size and forecast 2025-2030 ($ million)
Chart on APAC - Year-over-year growth 2025-2030 (%)
Data Table on APAC - Year-over-year growth 2025-2030 (%)
Chart on Regional Comparison - APAC
Data Table on Regional Comparison - APAC

12.3.1 China - Market size and forecast 2025-2030

Chart on China - Market size and forecast 2025-2030 ($ million)
Data Table on China - Market size and forecast 2025-2030 ($ million)
Chart on China - Year-over-year growth 2025-2030 (%)
Data Table on China - Year-over-year growth 2025-2030 (%)

12.3.2 Japan - Market size and forecast 2025-2030

Chart on Japan - Market size and forecast 2025-2030 ($ million)
Data Table on Japan - Market size and forecast 2025-2030 ($ million)
Chart on Japan - Year-over-year growth 2025-2030 (%)
Data Table on Japan - Year-over-year growth 2025-2030 (%)

12.3.3 South Korea - Market size and forecast 2025-2030

Chart on South Korea - Market size and forecast 2025-2030 ($ million)
Data Table on South Korea - Market size and forecast 2025-2030 ($ million)
Chart on South Korea - Year-over-year growth 2025-2030 (%)
Data Table on South Korea - Year-over-year growth 2025-2030 (%)

12.3.4 India - Market size and forecast 2025-2030

Chart on India - Market size and forecast 2025-2030 ($ million)
Data Table on India - Market size and forecast 2025-2030 ($ million)
Chart on India - Year-over-year growth 2025-2030 (%)
Data Table on India - Year-over-year growth 2025-2030 (%)

12.3.5 Australia - Market size and forecast 2025-2030

Chart on Australia - Market size and forecast 2025-2030 ($ million)
Data Table on Australia - Market size and forecast 2025-2030 ($ million)
Chart on Australia - Year-over-year growth 2025-2030 (%)
Data Table on Australia - Year-over-year growth 2025-2030 (%)

12.3.6 Thailand - Market size and forecast 2025-2030

Chart on Thailand - Market size and forecast 2025-2030 ($ million)
Data Table on Thailand - Market size and forecast 2025-2030 ($ million)
Chart on Thailand - Year-over-year growth 2025-2030 (%)
Data Table on Thailand - Year-over-year growth 2025-2030 (%)

12.4 North America - Market size and forecast 2025-2030

Chart on North America - Market size and forecast 2025-2030 ($ million)
Data Table on North America - Market size and forecast 2025-2030 ($ million)
Chart on North America - Year-over-year growth 2025-2030 (%)
Data Table on North America - Year-over-year growth 2025-2030 (%)
Chart on Regional Comparison - North America
Data Table on Regional Comparison - North America

12.4.1 US - Market size and forecast 2025-2030

Chart on US - Market size and forecast 2025-2030 ($ million)
Data Table on US - Market size and forecast 2025-2030 ($ million)
Chart on US - Year-over-year growth 2025-2030 (%)
Data Table on US - Year-over-year growth 2025-2030 (%)

12.4.2 Canada - Market size and forecast 2025-2030

Chart on Canada - Market size and forecast 2025-2030 ($ million)
Data Table on Canada - Market size and forecast 2025-2030 ($ million)
Chart on Canada - Year-over-year growth 2025-2030 (%)
Data Table on Canada - Year-over-year growth 2025-2030 (%)

12.4.3 Mexico - Market size and forecast 2025-2030

Chart on Mexico - Market size and forecast 2025-2030 ($ million)
Data Table on Mexico - Market size and forecast 2025-2030 ($ million)
Chart on Mexico - Year-over-year growth 2025-2030 (%)
Data Table on Mexico - Year-over-year growth 2025-2030 (%)

12.5 Europe - Market size and forecast 2025-2030

Chart on Europe - Market size and forecast 2025-2030 ($ million)
Data Table on Europe - Market size and forecast 2025-2030 ($ million)
Chart on Europe - Year-over-year growth 2025-2030 (%)
Data Table on Europe - Year-over-year growth 2025-2030 (%)
Chart on Regional Comparison - Europe
Data Table on Regional Comparison - Europe

12.5.1 France - Market size and forecast 2025-2030

Chart on France - Market size and forecast 2025-2030 ($ million)
Data Table on France - Market size and forecast 2025-2030 ($ million)
Chart on France - Year-over-year growth 2025-2030 (%)
Data Table on France - Year-over-year growth 2025-2030 (%)

12.5.2 Italy - Market size and forecast 2025-2030

Chart on Italy - Market size and forecast 2025-2030 ($ million)
Data Table on Italy - Market size and forecast 2025-2030 ($ million)
Chart on Italy - Year-over-year growth 2025-2030 (%)
Data Table on Italy - Year-over-year growth 2025-2030 (%)

12.5.3 Germany - Market size and forecast 2025-2030

Chart on Germany - Market size and forecast 2025-2030 ($ million)
Data Table on Germany - Market size and forecast 2025-2030 ($ million)
Chart on Germany - Year-over-year growth 2025-2030 (%)
Data Table on Germany - Year-over-year growth 2025-2030 (%)

12.5.4 UK - Market size and forecast 2025-2030

Chart on UK - Market size and forecast 2025-2030 ($ million)
Data Table on UK - Market size and forecast 2025-2030 ($ million)
Chart on UK - Year-over-year growth 2025-2030 (%)
Data Table on UK - Year-over-year growth 2025-2030 (%)

12.5.5 Spain - Market size and forecast 2025-2030

Chart on Spain - Market size and forecast 2025-2030 ($ million)
Data Table on Spain - Market size and forecast 2025-2030 ($ million)
Chart on Spain - Year-over-year growth 2025-2030 (%)
Data Table on Spain - Year-over-year growth 2025-2030 (%)

12.5.6 Poland - Market size and forecast 2025-2030

Chart on Poland - Market size and forecast 2025-2030 ($ million)
Data Table on Poland - Market size and forecast 2025-2030 ($ million)
Chart on Poland - Year-over-year growth 2025-2030 (%)
Data Table on Poland - Year-over-year growth 2025-2030 (%)

12.6 Middle East and Africa - Market size and forecast 2025-2030

Chart on Middle East and Africa - Market size and forecast 2025-2030 ($ million)
Data Table on Middle East and Africa - Market size and forecast 2025-2030 ($ million)
Chart on Middle East and Africa - Year-over-year growth 2025-2030 (%)
Data Table on Middle East and Africa - Year-over-year growth 2025-2030 (%)
Chart on Regional Comparison - Middle East and Africa
Data Table on Regional Comparison - Middle East and Africa

12.6.1 UAE - Market size and forecast 2025-2030

Chart on UAE - Market size and forecast 2025-2030 ($ million)
Data Table on UAE - Market size and forecast 2025-2030 ($ million)
Chart on UAE - Year-over-year growth 2025-2030 (%)
Data Table on UAE - Year-over-year growth 2025-2030 (%)

12.6.2 Saudi Arabia - Market size and forecast 2025-2030

Chart on Saudi Arabia - Market size and forecast 2025-2030 ($ million)
Data Table on Saudi Arabia - Market size and forecast 2025-2030 ($ million)
Chart on Saudi Arabia - Year-over-year growth 2025-2030 (%)
Data Table on Saudi Arabia - Year-over-year growth 2025-2030 (%)

12.6.3 South Africa - Market size and forecast 2025-2030

Chart on South Africa - Market size and forecast 2025-2030 ($ million)
Data Table on South Africa - Market size and forecast 2025-2030 ($ million)
Chart on South Africa - Year-over-year growth 2025-2030 (%)
Data Table on South Africa - Year-over-year growth 2025-2030 (%)

12.6.4 Turkey - Market size and forecast 2025-2030

Chart on Turkey - Market size and forecast 2025-2030 ($ million)
Data Table on Turkey - Market size and forecast 2025-2030 ($ million)
Chart on Turkey - Year-over-year growth 2025-2030 (%)
Data Table on Turkey - Year-over-year growth 2025-2030 (%)

12.6.5 Egypt - Market size and forecast 2025-2030

Chart on Egypt - Market size and forecast 2025-2030 ($ million)
Data Table on Egypt - Market size and forecast 2025-2030 ($ million)
Chart on Egypt - Year-over-year growth 2025-2030 (%)
Data Table on Egypt - Year-over-year growth 2025-2030 (%)

12.7 South America - Market size and forecast 2025-2030

Chart on South America - Market size and forecast 2025-2030 ($ million)
Data Table on South America - Market size and forecast 2025-2030 ($ million)
Chart on South America - Year-over-year growth 2025-2030 (%)
Data Table on South America - Year-over-year growth 2025-2030 (%)
Chart on Regional Comparison - South America
Data Table on Regional Comparison - South America

12.7.1 Brazil - Market size and forecast 2025-2030

Chart on Brazil - Market size and forecast 2025-2030 ($ million)
Data Table on Brazil - Market size and forecast 2025-2030 ($ million)
Chart on Brazil - Year-over-year growth 2025-2030 (%)
Data Table on Brazil - Year-over-year growth 2025-2030 (%)

12.7.2 Argentina - Market size and forecast 2025-2030

Chart on Argentina - Market size and forecast 2025-2030 ($ million)
Data Table on Argentina - Market size and forecast 2025-2030 ($ million)
Chart on Argentina - Year-over-year growth 2025-2030 (%)
Data Table on Argentina - Year-over-year growth 2025-2030 (%)

12.7.3 Colombia - Market size and forecast 2025-2030

Chart on Colombia - Market size and forecast 2025-2030 ($ million)
Data Table on Colombia - Market size and forecast 2025-2030 ($ million)
Chart on Colombia - Year-over-year growth 2025-2030 (%)
Data Table on Colombia - Year-over-year growth 2025-2030 (%)

12.8 Market opportunity by geography

Market opportunity by geography ($ million)
Data Tables on Market opportunity by geography ($ million)

13. Drivers, Challenges, and Opportunity

13.1 Market drivers

Increased demand for luxury skincare products
Growing number of new innovative product launches
Emergence of omnichannel retail channels

13.2 Market challenges

Limited penetration of luxury brands in developing regions
Availability of counterfeit products
Stringent regulations on product formulation, labeling, and packaging

13.3 Impact of drivers and challenges

Impact of drivers and challenges in 2025 and 2030

13.4 Market opportunities

Expansion of online retail channels
Rise in demand for natural and organic cosmetic products
Increasing research and development product activities

14. Competitive Landscape

14.1 Overview

14.2

Overview on criticality of inputs and factors of differentiation

14.3 Landscape disruption

Overview on factors of disruption

14.4 Industry risks

Impact of key risks on business

15. Competitive Analysis

15.1 Companies profiled

Companies covered

15.2 Company ranking index

15.3 Market positioning of companies

Matrix on companies position and classification

15.4 Avon Products Inc.

Avon Products Inc. - Overview
Avon Products Inc. - Product / Service
Avon Products Inc. - Key offerings
SWOT

15.5 Chanel Ltd.

Chanel Ltd. - Overview
Chanel Ltd. - Product / Service
Chanel Ltd. - Key offerings
SWOT

15.6 Christian Dior SE

Christian Dior SE - Overview
Christian Dior SE - Product / Service
Christian Dior SE - Key offerings
SWOT

15.7 Coty Inc.

Coty Inc. - Overview
Coty Inc. - Business segments
Coty Inc. - Key news
Coty Inc. - Key offerings
Coty Inc. - Segment focus
SWOT

15.8 Kao Corp.

Kao Corp. - Overview
Kao Corp. - Business segments
Kao Corp. - Key news
Kao Corp. - Key offerings
Kao Corp. - Segment focus
SWOT

15.9 Kose Corp.

Kose Corp. - Overview
Kose Corp. - Product / Service
Kose Corp. - Key offerings
SWOT

15.10 Loreal SA

Loreal SA - Overview
Loreal SA - Business segments
Loreal SA - Key offerings
Loreal SA - Segment focus
SWOT

15.11 LVMH Moet Hennessy

LVMH Moet Hennessy - Overview
LVMH Moet Hennessy - Business segments
LVMH Moet Hennessy - Key offerings
LVMH Moet Hennessy - Segment focus
SWOT

15.12 Oriflame Cosmetics SA

Oriflame Cosmetics SA - Overview
Oriflame Cosmetics SA - Product / Service
Oriflame Cosmetics SA - Key offerings
SWOT

15.13 PUIG S.L.

PUIG S.L. - Overview
PUIG S.L. - Business segments
PUIG S.L. - Key offerings
PUIG S.L. - Segment focus
SWOT

15.14 Ralph Lauren Corp.

Ralph Lauren Corp. - Overview
Ralph Lauren Corp. - Business segments
Ralph Lauren Corp. - Key offerings
Ralph Lauren Corp. - Segment focus
SWOT

15.15 Revlon Inc.

Revlon Inc. - Overview
Revlon Inc. - Product / Service
Revlon Inc. - Key offerings
SWOT

15.16 Shiseido Co. Ltd.

Shiseido Co. Ltd. - Overview
Shiseido Co. Ltd. - Business segments
Shiseido Co. Ltd. - Key offerings
Shiseido Co. Ltd. - Segment focus
SWOT

15.17 The Estee Lauder Co. Inc.

The Estee Lauder Co. Inc. - Overview
The Estee Lauder Co. Inc. - Business segments
The Estee Lauder Co. Inc. - Key offerings
The Estee Lauder Co. Inc. - Segment focus
SWOT

15.18 Unilever PLC

Unilever PLC - Overview
Unilever PLC - Business segments
Unilever PLC - Key news
Unilever PLC - Key offerings
Unilever PLC - Segment focus
SWOT

16. Appendix

16.1 Scope of the report

Market definition
Objectives
Notes and caveats

16.2 Inclusions and exclusions checklist

Inclusions checklist
Exclusions checklist

16.3 Currency conversion rates for US$

16.4 Research methodology

16.5 Data procurement

Information sources

16.6 Data validation

16.7 Validation techniques employed for market sizing

16.8 Data synthesis

16.9 360 degree market analysis

16.10 List of abbreviations

Research Methodology

Technavio presents a detailed picture of the market by way of study, synthesis, and summation of data from multiple sources. The analysts have presented the various facets of the market with a particular focus on identifying the key industry influencers. The data thus presented is comprehensive, reliable, and the result of extensive research, both primary and secondary.

INFORMATION SOURCES

Primary sources

  • Manufacturers and suppliers
  • Channel partners
  • Industry experts
  • Strategic decision makers

Secondary sources

  • Industry journals and periodicals
  • Government data
  • Financial reports of key industry players
  • Historical data
  • Press releases

DATA ANALYSIS

Data Synthesis

  • Collation of data
  • Estimation of key figures
  • Analysis of derived insights

Data Validation

  • Triangulation with data models
  • Reference against proprietary databases
  • Corroboration with industry experts

REPORT WRITING

Qualitative

  • Market drivers
  • Market challenges
  • Market trends
  • Five forces analysis

Quantitative

  • Market size and forecast
  • Market segmentation
  • Geographical insights
  • Competitive landscape

Interested in this report?

Get your sample now to see our research methodology and insights!

Download Now

Frequently Asked Questions

Luxury Cosmetics market growth will increase by USD 30918.8 million during 2026-2030.

The Luxury Cosmetics market is expected to grow at a CAGR of 7.5% during 2026-2030.

Luxury Cosmetics market is segmented by Type (Organic, Conventional) Product type (Skincare, Makeup, Fragrance, Haircare, Bodycare) Distribution channel (Offline, Online)

Avon Products Inc., Chanel Ltd., Christian Dior SE, Coty Inc., Kao Corp., Kose Corp., La Mer Technology Inc., Laura Mercier US Buyer LLC, Loreal SA, LVMH Moet Hennessy, Oriflame Cosmetics SA, Pat McGrath, PUIG S.L., Ralph Lauren Corp., Revlon Inc., Shiseido Co. Ltd., The Estee Lauder Co. Inc., Unilever PLC are a few of the key vendors in the Luxury Cosmetics market.

APAC will register the highest growth rate of 44.6% among the other regions. Therefore, the Luxury Cosmetics market in APAC is expected to garner significant business opportunities for the vendors during the forecast period.

China, Japan, South Korea, India, Australia, Thailand, US, Canada, Mexico, France, Italy, Germany, UK, Spain, Poland, UAE, Saudi Arabia, South Africa, Turkey, Egypt, Brazil, Argentina, Colombia

  • Increased demand for luxury skincare products is the driving factor this market.

The Luxury Cosmetics market vendors should focus on grabbing business opportunities from the Type segment as it accounted for the largest market share in the base year.
RIA - Research AI Assistant
Ask RIA