Liquified Petroleum Gas (LPG) Tanker Market Analysis, Size, and Forecast 2025-2029: North America (US and Canada), Europe (France, Germany, Italy, Spain, The Netherlands, and UK), APAC (China and Japan), and Rest of World (ROW)

Liquified Petroleum Gas (LPG) Tanker Market Analysis, Size, and Forecast 2025-2029:
North America (US and Canada), Europe (France, Germany, Italy, Spain, The Netherlands, and UK), APAC (China and Japan), and Rest of World (ROW)

Published: Mar 2025 204 Pages SKU: IRTNTR75223

Market Overview at a Glance

$55.8 Mn
Market Opportunity
3.3%
CAGR
3.1
YoY growth 2024-2025(%)

Liquified Petroleum Gas (LPG) Tanker Market Size 2025-2029

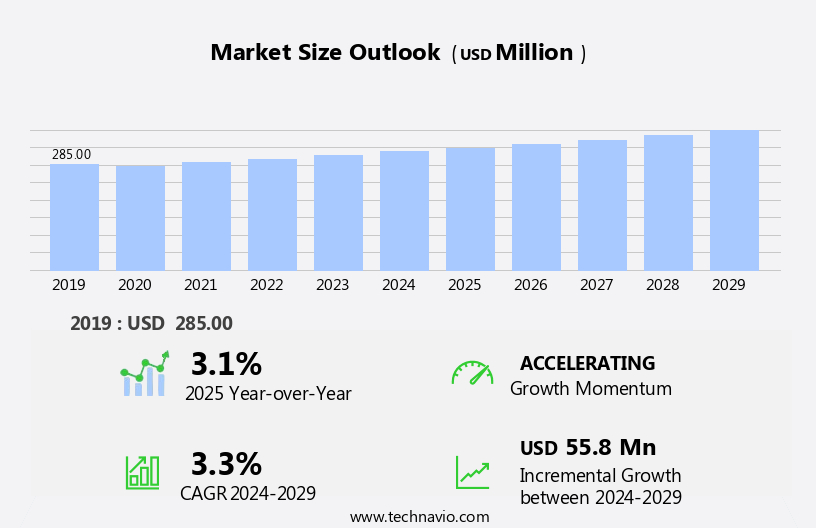
The liquified petroleum gas (lpg) tanker market size is forecast to increase by USD 55.8 million, at a CAGR of 3.3% between 2024 and 2029.

  • The LPG tanker market is experiencing significant shifts, driven by the increasing supply of natural gas and advancements in technology. Natural gas, a key feedstock for LPG production, has seen a surge in availability, leading to increased LPG production and, consequently, higher demand for LPG tankers. This trend is expected to continue, providing a promising outlook for market growth. However, the market is not without challenges. Fluctuating crude oil prices pose a significant threat to market stability. As a key input in LPG production, price volatility in crude oil can significantly impact the profitability of LPG tanker operators. Additionally, the industry faces the challenge of adhering to stringent safety regulations, which require substantial investments in technology and infrastructure to ensure safe and efficient operations.
  • Companies seeking to capitalize on market opportunities must stay abreast of these trends and challenges, implementing strategic initiatives to navigate the dynamic market landscape effectively.

What will be the Size of the Liquified Petroleum Gas (LPG) Tanker Market during the forecast period?

Liquified Petroleum Gas (LPG) Tanker Market Size

Explore in-depth regional segment analysis with market size data - historical 2019-2023 and forecasts 2025-2029 - in the full report.  
Request Free Sample

The liquefied petroleum gas (LPG) tanker market is characterized by its continuous evolution and dynamic nature. Entities such as inert gas systems, tank design, truck transportation, repair procedures, energy security, charter rates, crew training, petrochemical feedstock, pressure vessels, maintenance procedures, quality control, LPG terminals, vapor recovery systems, LPG tankers, pumping systems, ballast water management, and various other components play integral roles in this market. Inert gas systems ensure the safe transport of LPG by maintaining an inert atmosphere within the tank to prevent the formation of explosive mixtures. Tank design continues to advance, with innovations in hull construction, material selection, and insulation systems enhancing operational efficiency and safety.

Truck transportation and repair procedures enable the distribution of LPG to various sectors, including industrial and domestic applications. Energy security is a significant factor, with charter rates influenced by supply chain disruptions and geopolitical tensions. Crew training and safety systems are essential for ensuring the safe operation of LPG tankers and preventing accidents. Petrochemical feedstock demand drives the production and transportation of LPG, with pressure vessels and maintenance procedures ensuring the integrity of the supply chain. Quality control measures and LPG terminals facilitate the efficient handling and storage of LPG, while vapor recovery systems minimize emissions and improve operational efficiency.

LPG tankers, pumping systems, and ballast water management systems enable the safe and efficient transportation and handling of LPG. The market for LPG derivatives, such as propane and butane, continues to grow, with vaporization systems and cargo monitoring systems ensuring the safe and efficient handling of these products. The energy transition towards renewable energy sources is influencing the LPG market, with LNG tankers and pipeline infrastructure providing alternative transportation and storage solutions. Maritime security and Solas regulations ensure the safe and secure transportation of LPG, while cargo handling systems and rail transportation offer additional transportation options.

Non-destructive testing (NDT) and risk assessment are crucial for maintaining the integrity of LPG infrastructure and ensuring operational safety. Temperature sensors and pressure sensors enable real-time monitoring of LPG storage and transportation, while emergency shut-off valves and pressure relief valves prevent potential accidents. The LPG market is a complex and dynamic system, with ongoing activities and evolving patterns shaping its future. From tank design and transportation to energy security and safety systems, each component plays a critical role in ensuring the safe and efficient production, transportation, and use of LPG.

How is this Liquified Petroleum Gas (LPG) Tanker Industry segmented?

The liquified petroleum gas (lpg) tanker industry research report provides comprehensive data (region-wise segment analysis), with forecasts and estimates in "USD million" for the period 2025-2029, as well as historical data from 2019-2023 for the following segments.

  • Application
    • Residential
    • Commercial
  • Type
    • Very large gas carrier
    • Large gas carrier
    • Medium gas carrier
    • Small gas carrier
  • Variant
    • Semi-pressurized
    • Fully pressurized
    • Fully refrigerated
  • Propulsion Type
    • Conventional Fuel
    • Dual-Fuel
    • LNG-Powered
  • Geography
    • North America
      • US
      • Canada
    • Europe
      • France
      • Germany
      • Italy
      • Spain
      • The Netherlands
      • UK
    • APAC
      • China
      • Japan
    • Rest of World (ROW)

    By Application Insights

    The residential segment is estimated to witness significant growth during the forecast period.

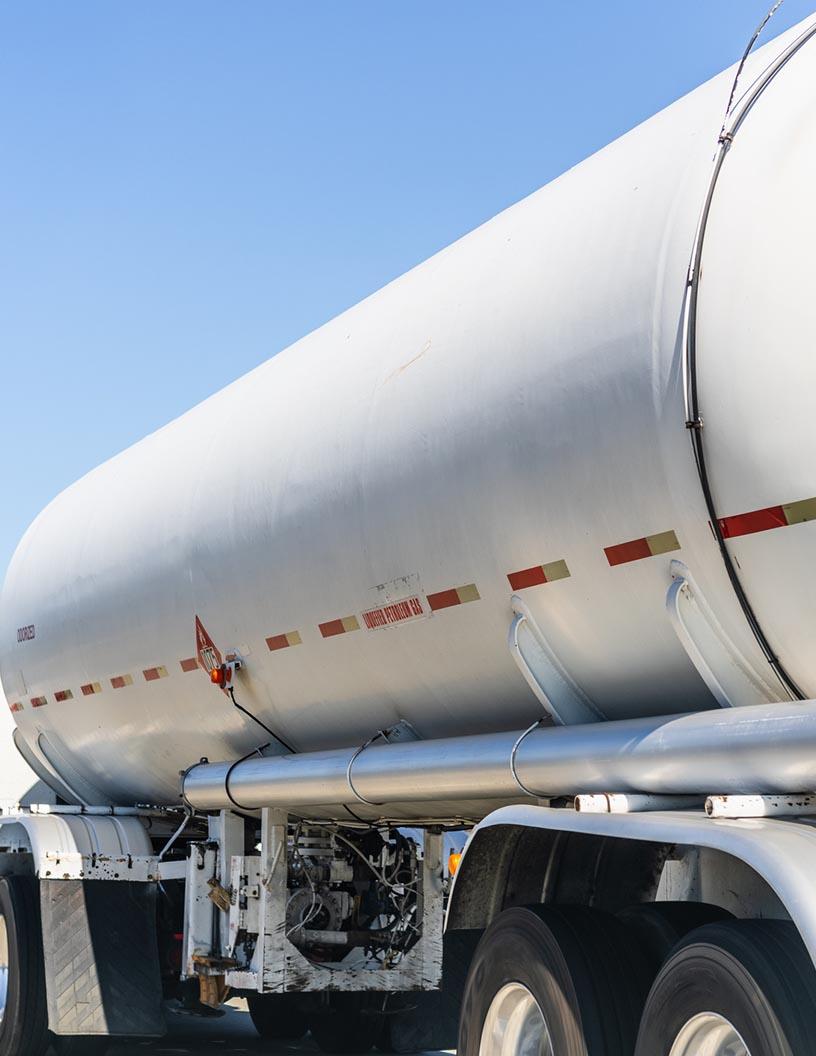
    The LPG tanker market caters to the demand for liquefied petroleum gas (LPG) from residential end-users, including households, apartments, and private homes. This market's growth is driven by the global shift towards cleaner, more sustainable energy sources. LPG, a versatile energy source, is employed in various applications, such as water and space heating and cooling in the residential sector. In developing countries, LPG serves as an alternative to electricity for lighting. In developed nations, LPG is popular for outdoor activities like barbecues and camping. The preference for LPG among residential consumers stems from its reliability, cost-effectiveness, and efficiency in power generation.

    Ship design and construction play a crucial role in ensuring safe and efficient LPG transportation. Compliance with International Maritime Organization (IMO) regulations is essential to maintain safety standards. Gas detection systems, flame arresters, safety systems, and emergency shut-off valves are integral components of LPG tanker design. Hull construction materials and insulation systems are carefully selected based on material properties and operational efficiency. LPG carriers employ various technologies, such as inert gas systems, vapor recovery systems, and cargo monitoring systems, to optimize operational efficiency and minimize environmental impact. Cryogenic tanks, pressure vessels, and level sensors are used for LPG storage and distribution.

    Unloading systems, filling systems, and welding techniques ensure safe and efficient transfer of LPG from tanker to end-user. The supply chain involves various stakeholders, including LPG bottling and cylinder manufacturers, freight rate negotiators, fleet management companies, and distribution network operators. Pressure relief valves, temperature sensors, and pressure sensors are critical components in managing the LPG supply chain. Risk assessment, maintenance procedures, and quality control are essential to ensure safety and reliability. LPG tankers are also used as petrochemical feedstock carriers and as components of pipeline infrastructure. The energy transition and emission control regulations have led to the development of alternative energy sources, such as natural gas and renewables, which may impact the LPG tanker market's future growth.

    Truck transportation, rail transportation, and ballast water management are other aspects of the LPG tanker market. In conclusion, the LPG tanker market is a dynamic and complex industry that plays a vital role in providing clean, reliable, and cost-effective energy to residential end-users. The market's growth is driven by various factors, including the global energy transition, increasing demand for sustainable energy sources, and the versatility of LPG as an energy source. The market's success depends on the efficient design, construction, and operation of LPG tankers, as well as the effective management of the supply chain and adherence to safety regulations.

    Liquified Petroleum Gas (LPG) Tanker Market Size

    Request Free Sample

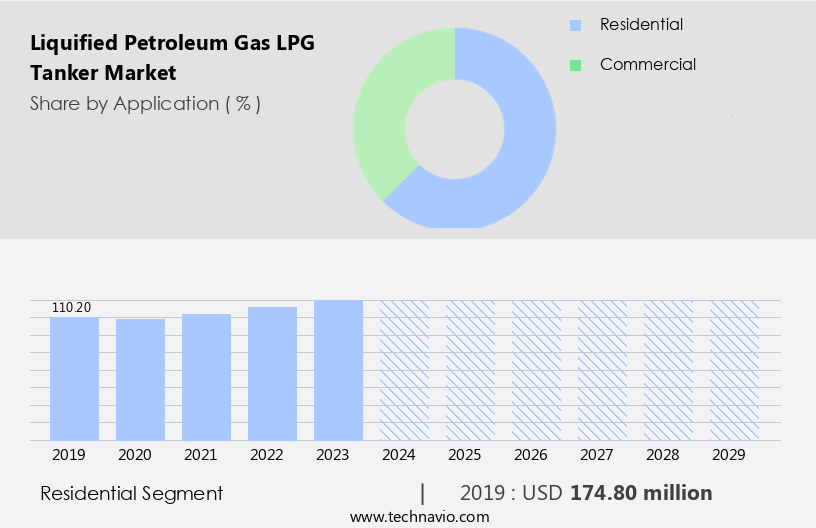
    The Residential segment was valued at USD 174.80 million in 2019 and showed a gradual increase during the forecast period.
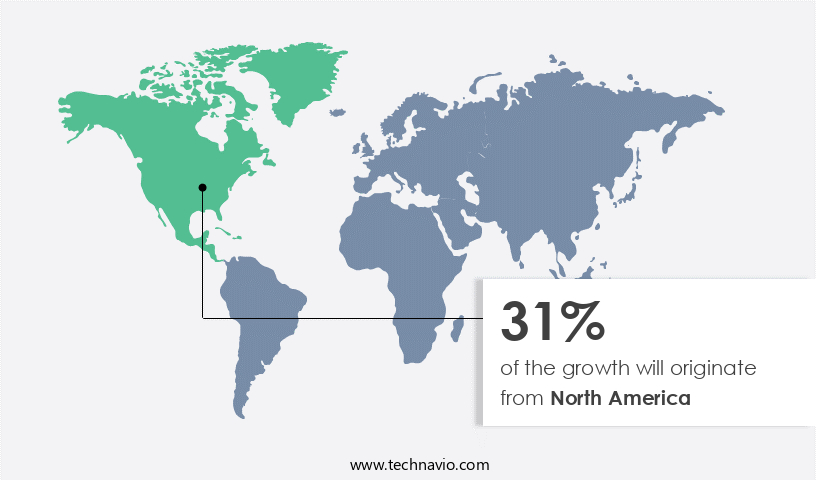
    Regional Analysis

    North America is estimated to contribute 31% to the growth of the global market during the forecast period.Technavio’s analysts have elaborately explained the regional trends and drivers that shape the market during the forecast period.

    Liquified Petroleum Gas (LPG) Tanker Market Share by Geography

     Request Free Sample

    The European the market is experiencing steady growth, driven by the expansion of petroleum production and crude oil imports. The transport sector, which accounts for over 60% of oil product consumption, plays a significant role in market growth. Partnerships in the LPG tanker industry foster infrastructure development, cost reduction, enhanced safety, expanded market reach, and innovation. For instance, BP and Apollo's collaboration in BP Pipelines (TANAP) Ltd. Fortifies Europe's energy infrastructure and supply security, indirectly boosting the LPG tanker market by optimizing distribution networks and encouraging investments in sustainable fuel transportation. Ship designs prioritize safety systems, including gas detection systems, flame arresters, emergency shut-off valves, and pressure relief valves.

    Hull construction materials undergo rigorous material selection processes to ensure durability and resistance to corrosion. Operational efficiency is maximized through the integration of inert gas systems, tank design, and welding techniques. LPG carriers transport various types of gases, such as propane and butane, to industrial and domestic consumers. LPG bottling and cylinder filling systems are essential components of the supply chain, ensuring the safe and efficient distribution of LPG. Unloading and filling systems employ advanced technology, such as cargo monitoring systems and vapor recovery systems, to minimize emissions and maintain operational efficiency. Fleet management strategies optimize fuel consumption and maintenance procedures, ensuring that LPG tankers remain in optimal condition.

    Pressure vessels and cargo handling systems are subjected to regular inspections and non-destructive testing (NDT) to maintain quality control and safety standards. The energy transition towards cleaner fuels influences the LPG tanker market, with LPG derivatives, such as LPG vaporization systems and LNG tankers, gaining popularity. Maritime security and Solas regulations ensure the safe transport of LPG, while pipeline infrastructure and rail transportation offer alternative methods for LPG transportation. Energy security and charter rates influence the market dynamics, with crew training and cargo handling systems prioritized to maintain operational efficiency. Emergency shut-off valves, pressure relief valves, level sensors, and temperature sensors are essential safety features for LPG tankers, ensuring the safe transport of LPG to industrial and domestic consumers.

    Market Dynamics

    Our researchers analyzed the data with 2024 as the base year, along with the key drivers, trends, and challenges. A holistic analysis of drivers will help companies refine their marketing strategies to gain a competitive advantage.

    What are the key market drivers leading to the rise in the adoption of Liquified Petroleum Gas (LPG) Tanker Industry?

    • The primary factor driving the natural gas market is the increase in its supply. 

    • The global LPG tanker market is experiencing significant growth due to the increasing demand for liquefied petroleum gas (LPG) as a cleaner alternative to traditional fossil fuels. The IEA reports a 2.7% increase in gas demand in 2024, with over 115 billion cubic meters (bcm) consumed. Gas demand for electricity generation grew by nearly 2.8% year-on-year, driven by expanding Asian markets and North America. However, European gas-fired power generation declined. To ensure safe and efficient transportation and storage of LPG, advanced technologies such as pressure relief valves, level sensors, pressure sensors, temperature sensors, unloading systems, and filling systems are crucial.
    • Material selection, welding techniques, and insulation systems are essential for the construction of LPG storage tanks, including cryogenic tanks, to maintain optimal temperature and prevent leaks. Operational efficiency is a key focus in the LPG supply chain, with fuel consumption minimization and risk assessment being critical factors. The integration of these technologies and systems contributes to the overall safety, reliability, and efficiency of LPG distribution networks.

    What are the market trends shaping the Liquified Petroleum Gas (LPG) Tanker Industry?

    • The current market trend is shaped by significant technological advances. It is essential to stay informed about these innovations to maintain a professional edge.

    • LPG tankers have seen significant advancements in technology, leading to enhanced efficiency and safety. Inert gas systems, a crucial safety feature, ensure the prevention of explosions by maintaining an inert atmosphere in the tanks. Tank design has evolved with the introduction of pressure vessels, which can withstand higher pressures and transport larger volumes. The logistics sector has witnessed the rise of truck transportation for last-mile delivery, complementing the role of LPG tankers. Repair procedures and maintenance have been streamlined through digitalization and advanced diagnostic tools. Energy security is a key focus, with charter rates remaining competitive to ensure a consistent supply of LPG as a petrochemical feedstock.
    • Quality control is ensured through stringent regulations and adherence to industry standards. Vapor recovery systems and pumping systems have been optimized for efficient operations and reduced emissions. Ballast water management systems are essential for maintaining the stability and safety of the tanker. Innovations in LPG tanker technology include the use of controllable pitch propellers (CPP) for improved maneuverability and power generation. These advancements enable the transportation of larger volumes and contribute to the overall growth of the LPG market.

    What challenges does the Liquified Petroleum Gas (LPG) Tanker Industry face during its growth?

    • The volatility in crude oil prices poses a significant challenge to the growth of the industry. 

    • The LPG tanker market is influenced by the volatility in global crude oil prices, which can disrupt the oil and gas industry and impact investment in LPG tankers. Fluctuations in crude oil prices can adversely affect end-user industries, leading to uncertainty in the demand for LPG derivatives such as butane and propane. To mitigate risks, LPG tankers are equipped with advanced technologies like vaporization systems, refrigeration systems, cargo monitoring systems, and non-destructive testing (NDT). These systems ensure the safe and efficient transportation of LPG. Moreover, the increasing focus on maritime security and emission control has led to the implementation of SOLAS regulations and the use of cargo handling systems.
    • In addition, pipeline infrastructure and rail transportation are also utilized to transport LPG, offering alternative options to maritime transportation. Despite these challenges, the LPG tanker market continues to grow due to the increasing demand for LPG derivatives and the need for reliable and efficient transportation solutions. LPG tankers are essential for the transportation of LPG derivatives such as butane and propane. However, the frequent volatility in crude oil prices can disrupt the oil and gas industry, ultimately impacting investment in the global LPG tanker market. The implementation of advanced technologies like vaporization systems, refrigeration systems, cargo monitoring systems, and non-destructive testing (NDT) is mandatory to ensure safe and efficient transportation.
    • Furthermore, the increasing focus on maritime security and emission control has led to the implementation of SOLAS regulations and the use of cargo handling systems. In addition, pipeline infrastructure and rail transportation offer alternative options to maritime transportation. Despite these challenges, the LPG tanker market is expected to grow due to the increasing demand for LPG derivatives and the need for reliable and efficient transportation solutions.

    Exclusive Customer Landscape

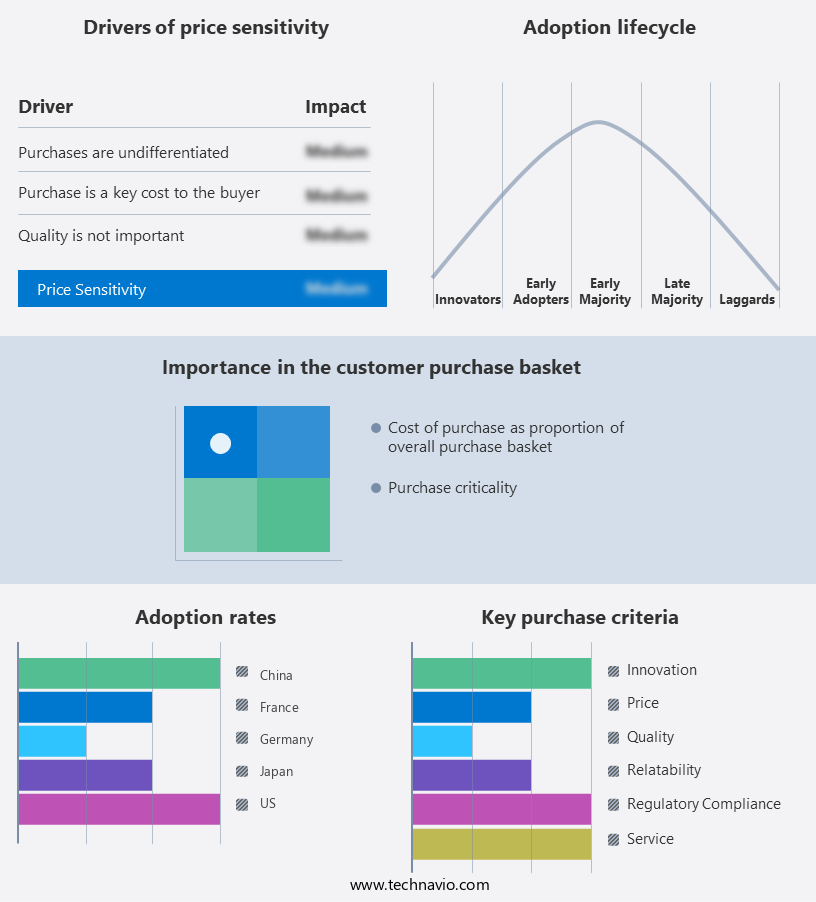
    The liquified petroleum gas (lpg) tanker market forecasting report includes the adoption lifecycle of the market, covering from the innovator’s stage to the laggard’s stage. It focuses on adoption rates in different regions based on penetration. Furthermore, the liquified petroleum gas (lpg) tanker market report also includes key purchase criteria and drivers of price sensitivity to help companies evaluate and develop their market growth analysis strategies.

    Liquified Petroleum Gas (LPG) Tanker Market Share by Geography

     Customer Landscape

    Key Companies & Market Insights

    Companies are implementing various strategies, such as strategic alliances, liquified petroleum gas (lpg) tanker market forecast, partnerships, mergers and acquisitions, geographical expansion, and product/service launches, to enhance their presence in the industry.

    Air and Gas Holdings Pty Ltd. - This company specializes in the transportation of liquefied petroleum gas (LPG) and very large gas carriers, collectively boasting a capacity exceeding 3 million cubic meters. With a focus on efficient and safe operations, the company's fleet plays a significant role in the global energy market.

    The industry research and growth report includes detailed analyses of the competitive landscape of the market and information about key companies, including:

    • Air and Gas Holdings Pty Ltd.
    • Bosco India
    • BW Group
    • DAE SUN SHIPBUILDING and ENGINEERING CO. LTD.
    • Dorian LPG Ltd.
    • Exmar NV
    • GLOBE GAS EQUIPMENTS INDUSTRY PVT. LTD.
    • HD Hyundai Co. Ltd.
    • Kawasaki Heavy Industries Ltd.
    • Krison Engineering Works
    • Kuwait Oil Tanker Co. SAK
    • Mitsubishi Heavy Industries Ltd.
    • Nakilat
    • Namura Shipbuilding Co. Ltd.
    • PT Pertamina Persero
    • Solvang ASA
    • StealthGas Inc.
    • STX Corp.
    • Teekay Corp.
    • The Great Eastern Shipping Co. Ltd.

    Qualitative and quantitative analysis of companies has been conducted to help clients understand the wider business environment as well as the strengths and weaknesses of key industry players. Data is qualitatively analyzed to categorize companies as pure play, category-focused, industry-focused, and diversified; it is quantitatively analyzed to categorize companies as dominant, leading, strong, tentative, and weak.

    Recent Development and News in Liquified Petroleum Gas (LPG) Tanker Market

    • In January 2024, Shell and Qatar Petroleum announced a strategic partnership to construct and operate the world's largest LPG carrier, the Q-Max LPG carrier, with a capacity of 84,000 cubic meters. This collaboration aimed to strengthen their positions in the global LPG market and meet the growing demand for cleaner fuels (Shell press release, 2024).
    • In March 2024, the European Union (EU) approved the revised Alternative Fuels Infrastructure Directive, mandating a significant increase in LPG refueling infrastructure across EU member states by 2030. This policy change is expected to boost the demand for LPG tankers in Europe (EU Commission press release, 2024).
    • In April 2025, ExxonMobil and Cheniere Energy entered into a joint venture to construct a new LPG export terminal in Louisiana, USA. This USD10 billion project, named Sabine Pass LPG Export Terminal, is expected to increase the US's LPG export capacity by 25% (ExxonMobil press release, 2025).
    • In May 2025, Mitsui O.S.K. Lines, Ltd. (MOL) and TotalEnergies signed a Memorandum of Understanding (MoU) to collaborate on the development of LPG bunkering infrastructure in Europe. The partnership aims to establish a network of LPG bunkering stations to support the growing number of LPG-powered vessels (MOL press release, 2025).

    Research Analyst Overview

    • The LPG tanker market is a critical segment of the maritime transport industry, with significant terminal operations and port operations shaping its dynamics. Pressure relief devices and ship repair are essential components of LPG tanker safety standards, ensuring the safe handling and transportation of this flammable gas. As the world transitions to cleaner energy sources, carbon footprint reduction is a growing concern, leading to increased interest in alternative fuels like LNG carriers. Environmental regulations, such as stricter emissions standards and liability insurance requirements, are driving the adoption of advanced refrigeration technology and fuel optimization techniques. Class societies play a vital role in enforcing safety standards and ensuring compliance with international regulations.
    • The LPG market analysis indicates a steady increase in LPG production, consumption, and global trade. Gas processing and demand forecasting are crucial for LPG market players to optimize their operations and remain competitive. The integration of autonomous navigation and vessel tracking systems is also transforming the LPG tanker market, enhancing efficiency and reducing operational costs. Sustainable shipping initiatives and supply forecasting are essential for LPG market players to navigate the complexities of the market and mitigate risks associated with insurance claims and price volatility. Overall, the LPG tanker market is a dynamic and evolving industry, requiring continuous innovation and adaptation to meet the changing needs of the global energy market.

    Dive into Technavio’s robust research methodology, blending expert interviews, extensive data synthesis, and validated models for unparalleled Liquified Petroleum Gas (LPG) Tanker Market insights. See full methodology.

    Market Scope

    Report Coverage

    Details

    Page number

    204

    Base year

    2024

    Historic period

    2019-2023

    Forecast period

    2025-2029

    Growth momentum & CAGR

    Accelerate at a CAGR of 3.3%

    Market growth 2025-2029

    USD 55.8 million

    Market structure

    Fragmented

    YoY growth 2024-2025(%)

    3.1

    Key countries

    US, Germany, UK, France, Italy, The Netherlands, Canada, China, Spain, and Japan

    Competitive landscape

    Leading Companies, Market Positioning of Companies, Competitive Strategies, and Industry Risks

    Request Free Sample

    What are the Key Data Covered in this Liquified Petroleum Gas (LPG) Tanker Market Research and Growth Report?

    • CAGR of the Liquified Petroleum Gas (LPG) Tanker industry during the forecast period
    • Detailed information on factors that will drive the growth and forecasting between 2025 and 2029
    • Precise estimation of the size of the market and its contribution of the industry in focus to the parent market
    • Accurate predictions about upcoming growth and trends and changes in consumer behaviour
    • Growth of the market across Europe, North America, APAC, South America, and Middle East and Africa
    • Thorough analysis of the market’s competitive landscape and detailed information about companies
    • Comprehensive analysis of factors that will challenge the liquified petroleum gas (lpg) tanker market growth of industry companies

    We can help! Our analysts can customize this liquified petroleum gas (lpg) tanker market research report to meet your requirements.

    Get in touch


    1 Executive Summary

    • 1.1 Market overview
      • Executive Summary - Chart on Market Overview
      • Executive Summary - Data Table on Market Overview
      • Executive Summary - Chart on Global Market Characteristics
      • Executive Summary - Chart on Market by Geography
      • Executive Summary - Chart on Market Segmentation by Application
      • Executive Summary - Chart on Market Segmentation by Type
      • Executive Summary - Chart on Market Segmentation by Variant
      • Executive Summary - Chart on Incremental Growth
      • Executive Summary - Data Table on Incremental Growth
      • Executive Summary - Chart on Company Market Positioning

    2 Technavio Analysis

    • 2.1 Analysis of price sensitivity, lifecycle, customer purchase basket, adoption rates, and purchase criteria
      • Analysis of price sensitivity, lifecycle, customer purchase basket, adoption rates, and purchase criteria
    • 2.2 Criticality of inputs and Factors of differentiation
      • Overview on criticality of inputs and factors of differentiation
    • 2.3 Factors of disruption
      • Overview on factors of disruption
    • 2.4 Impact of drivers and challenges
      • Impact of drivers and challenges in 2024 and 2029

    3 Market Landscape

    • 3.1 Market ecosystem
      • Parent Market
      • Data Table on - Parent Market
    • 3.2 Market characteristics
      • Market characteristics analysis
    • 3.3 Value chain analysis
      • Value chain analysis

    4 Market Sizing

    • 4.1 Market definition
      • Offerings of companies included in the market definition
    • 4.2 Market segment analysis
      • Market segments
    • 4.3 Market size 2024
      • 4.4 Market outlook: Forecast for 2024-2029
        • Chart on Global - Market size and forecast 2024-2029 ($ million)
        • Data Table on Global - Market size and forecast 2024-2029 ($ million)
        • Chart on Global Market: Year-over-year growth 2024-2029 (%)
        • Data Table on Global Market: Year-over-year growth 2024-2029 (%)

      5 Historic Market Size

      • 5.1 Global Liquified Petroleum Gas (LPG) Tanker Market 2019 - 2023
        • Historic Market Size - Data Table on Global Liquified Petroleum Gas (LPG) Tanker Market 2019 - 2023 ($ million)
      • 5.2 Application segment analysis 2019 - 2023
        • Historic Market Size - Application Segment 2019 - 2023 ($ million)
      • 5.3 Type segment analysis 2019 - 2023
        • Historic Market Size - Type Segment 2019 - 2023 ($ million)
      • 5.4 Variant segment analysis 2019 - 2023
        • Historic Market Size - Variant Segment 2019 - 2023 ($ million)
      • 5.5 Geography segment analysis 2019 - 2023
        • Historic Market Size - Geography Segment 2019 - 2023 ($ million)
      • 5.6 Country segment analysis 2019 - 2023
        • Historic Market Size - Country Segment 2019 - 2023 ($ million)

      6 Qualitative Analysis

      • 6.1 Impact of AI on global liquified petroleum gas (LPG) tanker market

        7 Five Forces Analysis

        • 7.1 Five forces summary
          • Five forces analysis - Comparison between 2024 and 2029
        • 7.2 Bargaining power of buyers
          • Bargaining power of buyers - Impact of key factors 2024 and 2029
        • 7.3 Bargaining power of suppliers
          • Bargaining power of suppliers - Impact of key factors in 2024 and 2029
        • 7.4 Threat of new entrants
          • Threat of new entrants - Impact of key factors in 2024 and 2029
        • 7.5 Threat of substitutes
          • Threat of substitutes - Impact of key factors in 2024 and 2029
        • 7.6 Threat of rivalry
          • Threat of rivalry - Impact of key factors in 2024 and 2029
        • 7.7 Market condition
          • Chart on Market condition - Five forces 2024 and 2029

        8 Market Segmentation by Application

        • 8.1 Market segments
          • Chart on Application - Market share (2024-2029) (%)
          • Data Table on Application - Market share (2024-2029) (%)
        • 8.2 Comparison by Application
          • Chart on Comparison by Application
          • Data Table on Comparison by Application
        • 8.3 Residential - Market size and forecast (2024-2029)
          • Chart on Residential - Market size and forecast (2024-2029) ($ million)
          • Data Table on Residential - Market size and forecast (2024-2029) ($ million)
          • Chart on Residential - Year-over-year growth (2024-2029) (%)
          • Data Table on Residential - Year-over-year growth (2024-2029) (%)
        • 8.4 Commercial - Market size and forecast (2024-2029)
          • Chart on Commercial - Market size and forecast (2024-2029) ($ million)
          • Data Table on Commercial - Market size and forecast (2024-2029) ($ million)
          • Chart on Commercial - Year-over-year growth (2024-2029) (%)
          • Data Table on Commercial - Year-over-year growth (2024-2029) (%)
        • 8.5 Market opportunity by Application
          • Market opportunity by Application ($ million)
          • Data Table on Market opportunity by Application ($ million)

        9 Market Segmentation by Type

        • 9.1 Market segments
          • Chart on Type - Market share (2024-2029) (%)
          • Data Table on Type - Market share (2024-2029) (%)
        • 9.2 Comparison by Type
          • Chart on Comparison by Type
          • Data Table on Comparison by Type
        • 9.3 Very large gas carrier - Market size and forecast (2024-2029)
          • Chart on Very large gas carrier - Market size and forecast (2024-2029) ($ million)
          • Data Table on Very large gas carrier - Market size and forecast (2024-2029) ($ million)
          • Chart on Very large gas carrier - Year-over-year growth (2024-2029) (%)
          • Data Table on Very large gas carrier - Year-over-year growth (2024-2029) (%)
        • 9.4 Large gas carrier - Market size and forecast (2024-2029)
          • Chart on Large gas carrier - Market size and forecast (2024-2029) ($ million)
          • Data Table on Large gas carrier - Market size and forecast (2024-2029) ($ million)
          • Chart on Large gas carrier - Year-over-year growth (2024-2029) (%)
          • Data Table on Large gas carrier - Year-over-year growth (2024-2029) (%)
        • 9.5 Medium gas carrier - Market size and forecast (2024-2029)
          • Chart on Medium gas carrier - Market size and forecast (2024-2029) ($ million)
          • Data Table on Medium gas carrier - Market size and forecast (2024-2029) ($ million)
          • Chart on Medium gas carrier - Year-over-year growth (2024-2029) (%)
          • Data Table on Medium gas carrier - Year-over-year growth (2024-2029) (%)
        • 9.6 Small gas carrier - Market size and forecast (2024-2029)
          • Chart on Small gas carrier - Market size and forecast (2024-2029) ($ million)
          • Data Table on Small gas carrier - Market size and forecast (2024-2029) ($ million)
          • Chart on Small gas carrier - Year-over-year growth (2024-2029) (%)
          • Data Table on Small gas carrier - Year-over-year growth (2024-2029) (%)
        • 9.7 Market opportunity by Type
          • Market opportunity by Type ($ million)
          • Data Table on Market opportunity by Type ($ million)

        10 Market Segmentation by Variant

        • 10.1 Market segments
          • Chart on Variant - Market share (2024-2029) (%)
          • Data Table on Variant - Market share (2024-2029) (%)
        • 10.2 Comparison by Variant
          • Chart on Comparison by Variant
          • Data Table on Comparison by Variant
        • 10.3 Semi-pressurized - Market size and forecast (2024-2029)
          • Chart on Semi-pressurized - Market size and forecast (2024-2029) ($ million)
          • Data Table on Semi-pressurized - Market size and forecast (2024-2029) ($ million)
          • Chart on Semi-pressurized - Year-over-year growth (2024-2029) (%)
          • Data Table on Semi-pressurized - Year-over-year growth (2024-2029) (%)
        • 10.4 Fully pressurized - Market size and forecast (2024-2029)
          • Chart on Fully pressurized - Market size and forecast (2024-2029) ($ million)
          • Data Table on Fully pressurized - Market size and forecast (2024-2029) ($ million)
          • Chart on Fully pressurized - Year-over-year growth (2024-2029) (%)
          • Data Table on Fully pressurized - Year-over-year growth (2024-2029) (%)
        • 10.5 Fully refrigerated - Market size and forecast (2024-2029)
          • Chart on Fully refrigerated - Market size and forecast (2024-2029) ($ million)
          • Data Table on Fully refrigerated - Market size and forecast (2024-2029) ($ million)
          • Chart on Fully refrigerated - Year-over-year growth (2024-2029) (%)
          • Data Table on Fully refrigerated - Year-over-year growth (2024-2029) (%)
        • 10.6 Market opportunity by Variant
          • Market opportunity by Variant ($ million)
          • Data Table on Market opportunity by Variant ($ million)

        11 Market Segmentation by Propulsion Type

        • 11.1 Market segments
          • Chart on Propulsion Type - Market share (2024-2029) (%)
          • Data Table on Propulsion Type - Market share (2024-2029) (%)
        • 11.2 Comparison by Propulsion Type
          • Chart on Comparison by Propulsion Type
          • Data Table on Comparison by Propulsion Type
        • 11.3 Conventional Fuel - Market size and forecast (2024-2029)
          • Chart on Conventional Fuel - Market size and forecast (2024-2029) ($ million)
          • Data Table on Conventional Fuel - Market size and forecast (2024-2029) ($ million)
          • Chart on Conventional Fuel - Year-over-year growth (2024-2029) (%)
          • Data Table on Conventional Fuel - Year-over-year growth (2024-2029) (%)
        • 11.4 Dual-Fuel - Market size and forecast (2024-2029)
          • Chart on Dual-Fuel - Market size and forecast (2024-2029) ($ million)
          • Data Table on Dual-Fuel - Market size and forecast (2024-2029) ($ million)
          • Chart on Dual-Fuel - Year-over-year growth (2024-2029) (%)
          • Data Table on Dual-Fuel - Year-over-year growth (2024-2029) (%)
        • 11.5 LNG-Powered - Market size and forecast (2024-2029)
          • Chart on LNG-Powered - Market size and forecast (2024-2029) ($ million)
          • Data Table on LNG-Powered - Market size and forecast (2024-2029) ($ million)
          • Chart on LNG-Powered - Year-over-year growth (2024-2029) (%)
          • Data Table on LNG-Powered - Year-over-year growth (2024-2029) (%)
        • 11.6 Market opportunity by Propulsion Type
          • Market opportunity by Propulsion Type ($ million)
          • Data Table on Market opportunity by Propulsion Type ($ million)

        12 Customer Landscape

        • 12.1 Customer landscape overview
          • Analysis of price sensitivity, lifecycle, customer purchase basket, adoption rates, and purchase criteria

        13 Geographic Landscape

        • 13.1 Geographic segmentation
          • Chart on Market share by geography 2024-2029 (%)
          • Data Table on Market share by geography 2024-2029 (%)
        • 13.2 Geographic comparison
          • Chart on Geographic comparison
          • Data Table on Geographic comparison
        • 13.3 Europe - Market size and forecast 2024-2029
          • Chart on Europe - Market size and forecast 2024-2029 ($ million)
          • Data Table on Europe - Market size and forecast 2024-2029 ($ million)
          • Chart on Europe - Year-over-year growth 2024-2029 (%)
          • Data Table on Europe - Year-over-year growth 2024-2029 (%)
        • 13.4 North America - Market size and forecast 2024-2029
          • Chart on North America - Market size and forecast 2024-2029 ($ million)
          • Data Table on North America - Market size and forecast 2024-2029 ($ million)
          • Chart on North America - Year-over-year growth 2024-2029 (%)
          • Data Table on North America - Year-over-year growth 2024-2029 (%)
        • 13.5 APAC - Market size and forecast 2024-2029
          • Chart on APAC - Market size and forecast 2024-2029 ($ million)
          • Data Table on APAC - Market size and forecast 2024-2029 ($ million)
          • Chart on APAC - Year-over-year growth 2024-2029 (%)
          • Data Table on APAC - Year-over-year growth 2024-2029 (%)
        • 13.6 South America - Market size and forecast 2024-2029
          • Chart on South America - Market size and forecast 2024-2029 ($ million)
          • Data Table on South America - Market size and forecast 2024-2029 ($ million)
          • Chart on South America - Year-over-year growth 2024-2029 (%)
          • Data Table on South America - Year-over-year growth 2024-2029 (%)
        • 13.7 Middle East and Africa - Market size and forecast 2024-2029
          • Chart on Middle East and Africa - Market size and forecast 2024-2029 ($ million)
          • Data Table on Middle East and Africa - Market size and forecast 2024-2029 ($ million)
          • Chart on Middle East and Africa - Year-over-year growth 2024-2029 (%)
          • Data Table on Middle East and Africa - Year-over-year growth 2024-2029 (%)
        • 13.8 US - Market size and forecast 2024-2029
          • Chart on US - Market size and forecast 2024-2029 ($ million)
          • Data Table on US - Market size and forecast 2024-2029 ($ million)
          • Chart on US - Year-over-year growth 2024-2029 (%)
          • Data Table on US - Year-over-year growth 2024-2029 (%)
        • 13.9 Germany - Market size and forecast 2024-2029
          • Chart on Germany - Market size and forecast 2024-2029 ($ million)
          • Data Table on Germany - Market size and forecast 2024-2029 ($ million)
          • Chart on Germany - Year-over-year growth 2024-2029 (%)
          • Data Table on Germany - Year-over-year growth 2024-2029 (%)
        • 13.10 UK - Market size and forecast 2024-2029
          • Chart on UK - Market size and forecast 2024-2029 ($ million)
          • Data Table on UK - Market size and forecast 2024-2029 ($ million)
          • Chart on UK - Year-over-year growth 2024-2029 (%)
          • Data Table on UK - Year-over-year growth 2024-2029 (%)
        • 13.11 France - Market size and forecast 2024-2029
          • Chart on France - Market size and forecast 2024-2029 ($ million)
          • Data Table on France - Market size and forecast 2024-2029 ($ million)
          • Chart on France - Year-over-year growth 2024-2029 (%)
          • Data Table on France - Year-over-year growth 2024-2029 (%)
        • 13.12 Italy - Market size and forecast 2024-2029
          • Chart on Italy - Market size and forecast 2024-2029 ($ million)
          • Data Table on Italy - Market size and forecast 2024-2029 ($ million)
          • Chart on Italy - Year-over-year growth 2024-2029 (%)
          • Data Table on Italy - Year-over-year growth 2024-2029 (%)
        • 13.13 The Netherlands - Market size and forecast 2024-2029
          • Chart on The Netherlands - Market size and forecast 2024-2029 ($ million)
          • Data Table on The Netherlands - Market size and forecast 2024-2029 ($ million)
          • Chart on The Netherlands - Year-over-year growth 2024-2029 (%)
          • Data Table on The Netherlands - Year-over-year growth 2024-2029 (%)
        • 13.14 Canada - Market size and forecast 2024-2029
          • Chart on Canada - Market size and forecast 2024-2029 ($ million)
          • Data Table on Canada - Market size and forecast 2024-2029 ($ million)
          • Chart on Canada - Year-over-year growth 2024-2029 (%)
          • Data Table on Canada - Year-over-year growth 2024-2029 (%)
        • 13.15 China - Market size and forecast 2024-2029
          • Chart on China - Market size and forecast 2024-2029 ($ million)
          • Data Table on China - Market size and forecast 2024-2029 ($ million)
          • Chart on China - Year-over-year growth 2024-2029 (%)
          • Data Table on China - Year-over-year growth 2024-2029 (%)
        • 13.16 Japan - Market size and forecast 2024-2029
          • Chart on Japan - Market size and forecast 2024-2029 ($ million)
          • Data Table on Japan - Market size and forecast 2024-2029 ($ million)
          • Chart on Japan - Year-over-year growth 2024-2029 (%)
          • Data Table on Japan - Year-over-year growth 2024-2029 (%)
        • 13.17 Spain - Market size and forecast 2024-2029
          • Chart on Spain - Market size and forecast 2024-2029 ($ million)
          • Data Table on Spain - Market size and forecast 2024-2029 ($ million)
          • Chart on Spain - Year-over-year growth 2024-2029 (%)
          • Data Table on Spain - Year-over-year growth 2024-2029 (%)
        • 13.18 Market opportunity by geography
          • Market opportunity by geography ($ million)
          • Data Tables on Market opportunity by geography ($ million)
        • 13.19 Rest of World (ROW) - Market size and forecast (2024-2029)
          • Chart on Rest of World (ROW) - Market size and forecast (2024-2029) ($ million)
          • Data Table on Rest of World (ROW) - Market size and forecast (2024-2029) ($ million)
          • Chart on Rest of World (ROW) - Year-over-year growth (2024-2029) (%)
          • Data Table on Rest of World (ROW) - Year-over-year growth (2024-2029) (%)

        14 Drivers, Challenges, and Opportunity/Restraints

        • 14.1 Market drivers
          • 14.2 Market challenges
            • 14.3 Impact of drivers and challenges
              • Impact of drivers and challenges in 2024 and 2029
            • 14.4 Market opportunities/restraints

              15 Competitive Landscape

              • 15.1 Overview
                • 15.2 Competitive Landscape
                  • Overview on criticality of inputs and factors of differentiation
                • 15.3 Landscape disruption
                  • Overview on factors of disruption
                • 15.4 Industry risks
                  • Impact of key risks on business

                16 Competitive Analysis

                • 16.1 Companies profiled
                  • Companies covered
                • 16.2 Company ranking index
                  • Company ranking index
                • 16.3 Market positioning of companies
                  • Matrix on companies position and classification
                • 16.4 BW Group
                  • BW Group - Overview
                  • BW Group - Product / Service
                  • BW Group - Key offerings
                  • SWOT
                • 16.5 DAE SUN SHIPBUILDING and ENGINEERING CO. LTD.
                  • DAE SUN SHIPBUILDING and ENGINEERING CO. LTD. - Overview
                  • DAE SUN SHIPBUILDING and ENGINEERING CO. LTD. - Product / Service
                  • DAE SUN SHIPBUILDING and ENGINEERING CO. LTD. - Key offerings
                  • SWOT
                • 16.6 Dorian LPG Ltd.
                  • Dorian LPG Ltd. - Overview
                  • Dorian LPG Ltd. - Product / Service
                  • Dorian LPG Ltd. - Key offerings
                  • SWOT
                • 16.7 Exmar NV
                  • Exmar NV - Overview
                  • Exmar NV - Business segments
                  • Exmar NV - Key offerings
                  • Exmar NV - Segment focus
                  • SWOT
                • 16.8 HD Hyundai Co. Ltd.
                  • HD Hyundai Co. Ltd. - Overview
                  • HD Hyundai Co. Ltd. - Business segments
                  • HD Hyundai Co. Ltd. - Key offerings
                  • HD Hyundai Co. Ltd. - Segment focus
                  • SWOT
                • 16.9 Kawasaki Heavy Industries Ltd.
                  • Kawasaki Heavy Industries Ltd. - Overview
                  • Kawasaki Heavy Industries Ltd. - Business segments
                  • Kawasaki Heavy Industries Ltd. - Key offerings
                  • Kawasaki Heavy Industries Ltd. - Segment focus
                  • SWOT
                • 16.10 Kuwait Oil Tanker Co. SAK
                  • Kuwait Oil Tanker Co. SAK - Overview
                  • Kuwait Oil Tanker Co. SAK - Product / Service
                  • Kuwait Oil Tanker Co. SAK - Key offerings
                  • SWOT
                • 16.11 Mitsubishi Heavy Industries Ltd.
                  • Mitsubishi Heavy Industries Ltd. - Overview
                  • Mitsubishi Heavy Industries Ltd. - Business segments
                  • Mitsubishi Heavy Industries Ltd. - Key news
                  • Mitsubishi Heavy Industries Ltd. - Key offerings
                  • Mitsubishi Heavy Industries Ltd. - Segment focus
                  • SWOT
                • 16.12 Nakilat
                  • Nakilat - Overview
                  • Nakilat - Product / Service
                  • Nakilat - Key offerings
                  • SWOT
                • 16.13 Namura Shipbuilding Co. Ltd.
                  • Namura Shipbuilding Co. Ltd. - Overview
                  • Namura Shipbuilding Co. Ltd. - Product / Service
                  • Namura Shipbuilding Co. Ltd. - Key offerings
                  • SWOT
                • 16.14 PT Pertamina Persero
                  • PT Pertamina Persero - Overview
                  • PT Pertamina Persero - Product / Service
                  • PT Pertamina Persero - Key offerings
                  • SWOT
                • 16.15 StealthGas Inc.
                  • StealthGas Inc. - Overview
                  • StealthGas Inc. - Product / Service
                  • StealthGas Inc. - Key offerings
                  • SWOT
                • 16.16 STX Corp.
                  • STX Corp. - Overview
                  • STX Corp. - Product / Service
                  • STX Corp. - Key offerings
                  • SWOT
                • 16.17 Teekay Corp.
                  • Teekay Corp. - Overview
                  • Teekay Corp. - Product / Service
                  • Teekay Corp. - Key offerings
                  • SWOT
                • 16.18 The Great Eastern Shipping Co. Ltd.
                  • The Great Eastern Shipping Co. Ltd. - Overview
                  • The Great Eastern Shipping Co. Ltd. - Product / Service
                  • The Great Eastern Shipping Co. Ltd. - Key offerings
                  • SWOT

                17 Appendix

                • 17.1 Scope of the report
                  • 17.2 Inclusions and exclusions checklist
                    • Inclusions checklist
                    • Exclusions checklist
                  • 17.3 Currency conversion rates for US$
                    • Currency conversion rates for US$
                  • 17.4 Research methodology
                    • Research methodology
                  • 17.5 Data procurement
                    • Information sources
                  • 17.6 Data validation
                    • Data validation
                  • 17.7 Validation techniques employed for market sizing
                    • Validation techniques employed for market sizing
                  • 17.8 Data synthesis
                    • Data synthesis
                  • 17.9 360 degree market analysis
                    • 360 degree market analysis
                  • 17.10 List of abbreviations
                    • List of abbreviations

                  Research Methodology

                  Technavio presents a detailed picture of the market by way of study, synthesis, and summation of data from multiple sources. The analysts have presented the various facets of the market with a particular focus on identifying the key industry influencers. The data thus presented is comprehensive, reliable, and the result of extensive research, both primary and secondary.

                  INFORMATION SOURCES

                  Primary sources

                  • Manufacturers and suppliers
                  • Channel partners
                  • Industry experts
                  • Strategic decision makers

                  Secondary sources

                  • Industry journals and periodicals
                  • Government data
                  • Financial reports of key industry players
                  • Historical data
                  • Press releases

                  DATA ANALYSIS

                  Data Synthesis

                  • Collation of data
                  • Estimation of key figures
                  • Analysis of derived insights

                  Data Validation

                  • Triangulation with data models
                  • Reference against proprietary databases
                  • Corroboration with industry experts

                  REPORT WRITING

                  Qualitative

                  • Market drivers
                  • Market challenges
                  • Market trends
                  • Five forces analysis

                  Quantitative

                  • Market size and forecast
                  • Market segmentation
                  • Geographical insights
                  • Competitive landscape

                  Interested in this report?

                  Get your sample now to see our research methodology and insights!

                  Download Now

                  Frequently Asked Questions

                  Liquified Petroleum Gas (Lpg) Tanker market growth will increase by $ 55.8 mn during 2025-2029.

                  The Liquified Petroleum Gas (Lpg) Tanker market is expected to grow at a CAGR of 3.3% during 2025-2029.

                  Liquified Petroleum Gas (Lpg) Tanker market is segmented by Application( Residential, Commercial) Type( Very large gas carrier, Large gas carrier, Medium gas carrier, Small gas carrier) Variant( Semi-pressurized, Fully pressurized, Fully refrigerated, South America, Middle East and Africa)

                  Air and Gas Holdings Pty Ltd., Bosco India, BW Group, DAE SUN SHIPBUILDING and ENGINEERING CO. LTD., Dorian LPG Ltd., Exmar NV, GLOBE GAS EQUIPMENTS INDUSTRY PVT. LTD., HD Hyundai Co. Ltd., Kawasaki Heavy Industries Ltd., Krison Engineering Works, Kuwait Oil Tanker Co. SAK, Mitsubishi Heavy Industries Ltd., Nakilat, Namura Shipbuilding Co. Ltd., PT Pertamina Persero, Solvang ASA, StealthGas Inc., STX Corp., Teekay Corp., The Great Eastern Shipping Co. Ltd. are a few of the key vendors in the Liquified Petroleum Gas (Lpg) Tanker market.

                  North America will register the highest growth rate of 31% among the other regions. Therefore, the Liquified Petroleum Gas (Lpg) Tanker market in North America is expected to garner significant business opportunities for the vendors during the forecast period.

                  US, Germany, UK, France, Italy, The Netherlands, Canada, China, Spain, Japan

                  • Increase in supply of natural gasWith the growth in the supply of coalbed methane is the driving factor this market.
                  • shale gas is the driving factor this market.
                  • and tight gas is the driving factor this market.
                  • natural gas has become the fastest-growing fossil fuel. As a result is the driving factor this market.
                  • the global oil and gas industry has experienced significant growth in producing unconventional oil and gas resources such as natural gas. According to the International Energy Agency (IEA) is the driving factor this market.
                  • gas demand increased by 2.7% is the driving factor this market.
                  • or 115 billion cubic meters (bcm) is the driving factor this market.
                  • in 2024. Gas demand for electricity generation grew by nearly 2.8% year-on-year is the driving factor this market.
                  • driven by significant increases in North America is the driving factor this market.
                  • rapidly expanding Asian markets is the driving factor this market.
                  • and Eurasia. However is the driving factor this market.
                  • this growth was partially offset by a decline in gas-fired power generation in Europe.Since 2008 is the driving factor this market.
                  • shale oil and gas extraction has been successful in countries such as the US is the driving factor this market.
                  • which has led to an increase in the global oil and gas supply. According to the IEA is the driving factor this market.
                  • natural gas production in the US accounted for an increase from 40% to 45% of global natural gas output growth in 2023. According to IEA is the driving factor this market.
                  • following the supply and price shocks of 2022 and 2023 is the driving factor this market.
                  • which weighed on natural gas demand is the driving factor this market.
                  • consumption picked up pace in 2024 and rose by over 2.5% is the driving factor this market.
                  • or by just over 100 bcm. As a result is the driving factor this market.
                  • natural gas demand reached a record high of 4 is the driving factor this market.
                  • 200 bcm in 2024 is the driving factor this market.
                  • driven primarily by growth in the Asia Pacific region.Moreover is the driving factor this market.
                  • Russia is the driving factor this market.
                  • the second-largest natural gas producer in the world after the US is the driving factor this market.
                  • hosts substantial under-utilized natural gas production capacity in the Yamal peninsula. The continuation of such initiatives will likely cause the global LPG Tanker market to expand throughout the forecast period. is the driving factor this market.

                  The Liquified Petroleum Gas (Lpg) Tanker market vendors should focus on grabbing business opportunities from the Residential segment as it accounted for the largest market share in the base year.