US LNG Infrastructure Market Analysis - Size and Forecast 2024-2028

US LNG Infrastructure Market Analysis - Size and Forecast 2024-2028

Published: Dec 2024 133 Pages SKU: IRTNTR72211

Market Overview at a Glance

$1.04 B
Market Opportunity
5.8%
CAGR
5.4
YoY growth 2023-2024(%)

US LNG Infrastructure Market Size and Trends

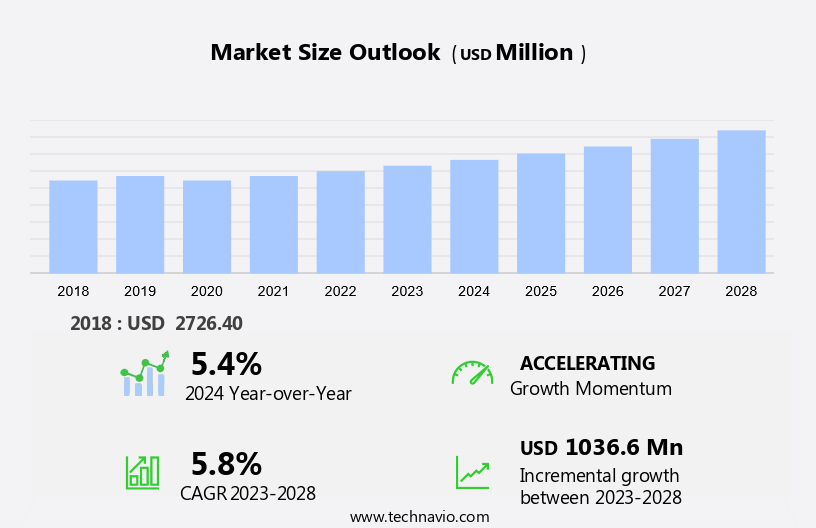
The US LNG infrastructure market size is forecast to increase by USD 1.04 billion at a CAGR of 5.8% between 2024 and 2028.  The market is experiencing significant growth due to several key drivers. The increasing concern over emissions and air pollution from carbon-intensive fuels has led to a surge in demand for cleaner alternatives, such as LNG. This shift is particularly evident in the maritime industry, where LNG is being increasingly used as a bunker fuel to reduce sulfur oxides and nitrogen oxides emissions. The market encompasses the construction and operation of various facilities, including liquefaction terminals, regasification terminals, and floating LNG terminals. Furthermore, the ongoing trade war between the US and China has boosted LNG demand as both countries seek to diversify their energy sources. In terms of trends, the project lifecycle of infrastructure projects, including LNG terminals and regasification facilities, is becoming increasingly complex. Regulatory requirements, environmental concerns, and technological advancements are all factors that must be considered in the planning and execution of these projects. Additionally, the need to mitigate the environmental impact of LNG production and transportation is a major challenge facing the industry. This includes reducing methane leakage and finding ways to capture and utilize associated emissions. In conclusion, the market is experiencing robust growth due to increasing demand for cleaner fuels and the ongoing trade war between major economies. However, the complexities of the project lifecycle and the need to address environmental concerns present significant challenges that must be addressed in order to ensure the long-term sustainability of the industry.

LNG Infrastructure Market in US Size

 Request Free Sample

The market plays a pivotal role in the power sector's transition towards cleaner energy sources. Natural gas, a sustainable alternative to coal and oil for power generation, has gained significant traction due to its lower carbon footprint. The increasing focus on reducing emissions and pollutants, such as sulfur oxides, from power generation has further boosted the demand for natural gas. Natural Gas Consumption and Imports: A Growing Trend Natural gas consumption has been on the rise in the power sector due to its cleaner burning properties compared to coal and oil. The US is among the leading consumers of natural gas for power generation. The country's natural gas imports have also been increasing to meet the growing demand. LNG imports have become a crucial energy source for the US, especially during peak demand periods. LNG Infrastructure: A Necessity for Natural Gas Imports. These terminals play a crucial role in the import and regasification of LNG for further distribution to power plants and other consumers. Types of LNG Terminals: Liquefaction and Regasification Liquefaction terminals are used to convert natural gas into LNG for export or storage. Regasification terminals, on the other hand, convert LNG back into its gaseoUS state for distribution to consumers. Both types of terminals are essential components of the market. Floating LNG Terminals: A Modern Solution Floating LNG terminals are a modern solution for LNG imports in regions with limited onshore infrastructure. These terminals can be deployed in deep waters and are particularly useful for countries with large offshore gas fields. Environmental Benefits of LNG The use of natural gas for power generation results in lower carbon emissions compared to coal and oil.

Market Segmentation

The market research report provides comprehensive data (region-wise segment analysis), with forecasts and estimates in "USD billion" for the period 2024-2028, as well as historical data from 2018 - 2022 for the following segments.

  • Type
    • Liquefaction terminal
    • Regasification terminal
  • End-USer
    • Power generation
    • Transportation fuel
    • Others
  • Geography
    • US

By Type Insights

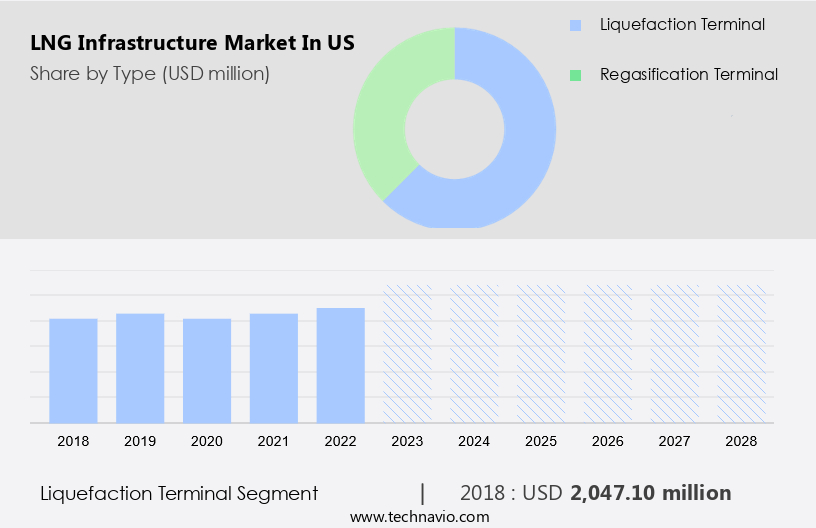
The liquefaction terminal segment is estimated to witness significant growth during the forecast period. The market is anchored by the liquefaction terminal segment, which plays a significant role in the country's position as a major global LNG exporter. These terminals convert natural gas into liquefied natural gas (LNG) by cooling it to -260 degrees Fahrenheit, facilitating efficient storage and transportation to international markets.

LNG Infrastructure Market in US Size

Get a glance at the market share of various segment Download the PDF Sample

The liquefaction terminal segment was the largest segment and valued at USD 2.05 billion in 2018. The US has developed extensive liquefaction capacity due to the abundance of shale gas reserves and advancements in hydraulic fracturing, primarily along the Gulf Coast. Key facilities, including Sabine Pass, Corpus Christi, and Cameron LNG, lead the market, with numerous new projects under construction or expansion. Air pollution and climate change concerns have led to a shift towards cleaner, less carbon-intensive fuels. LNG, as a cleaner alternative to coal and other carbon-intensive fuels, is gaining popularity. Hence, such factors are fuelling the growth of this segment during the forecast period.

Our researchers analyzed the data with 2023 as the base year, along with the key drivers, trends, and challenges. A holistic analysis of drivers will help companies refine their marketing strategies to gain a competitive advantage.

US LNG Infrastructure Market Driver

Increase in LNG production is notably driving market growth. Natural gas has emerged as a significant energy source in the US due to the abundant supply of unconventional resources such as coalbed methane, shale gas, and tight gas.  The US natural gas production surge has led to an increase in LNG infrastructure development, including LNG receiving terminals and city gas distribution networks.

Compressed Natural Gas (CNG) and Small-Scale LNG are gaining popularity as alternative fuel sources for transportation. Natural Gas Imports have also become essential for meeting the country's energy demands, especially during peak consumption periods. LNG projects, including transportation and infrastructure, are crucial for the efficient distribution of natural gas. ThUS, such factors are driving the growth of the market during the forecast period.

US LNG Infrastructure Market Trends

Growing demand for LNG bunkering is the key trend in the market. Liquefied Natural Gas (LNG) is gaining significance as a cleaner energy source for power generation and transportation, particularly in the maritime sector. With increasing focus on reducing carbon footprint and embracing sustainable alternatives to coal and oil, LNG is becoming an attractive option for fueling marine vessels and heavy-duty vehicles.

In response to this trend, ports are investing in LNG bunkering facilities to cater to the growing demand for LNG as a marine fuel. According to various market research firms like the International Energy Agency (IEA), the maritime industry continues to rely heavily on heavy fuel oil (HFO) for fuel. However, stringent environmental regulations, such as those enforced by the International Maritime Organization (IMO), are driving the need for cleaner energy sources.  Thus, such trends will shape the growth of the market during the forecast period.

US LNG Infrastructure Market Challenge

Impact of ongoing trade war between US and China is the major challenge that affects the growth of the market. The market, encompassing Construction, Alternative Energy Sources, and Renewable Energy, has faced challenges due to the US-China trade dispute since 2023. This conflict has resulted in increased costs and reduced profitability for vendors through tariffs and trade restrictions.

The Chinese government's continued announcements of higher tariffs on US-sourced products have further complicated the situation. These protective measures, intended to shield domestic bUSinesses and employment, have led to decreased import and export activities, negatively impacting the financial performance of LNG infrastructure vendors. Hence, the above factors will impede the growth of the market during the forecast period.

Exclusive Customer Landscape

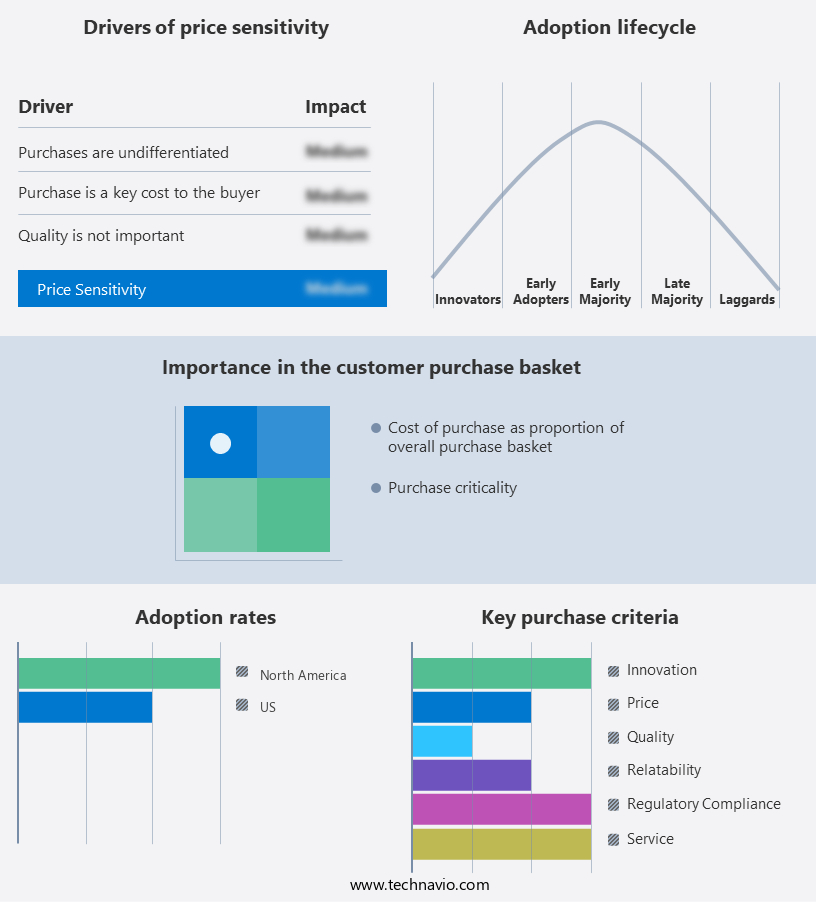
The market forecasting report includes the adoption lifecycle of the market, covering from the innovator's stage to the laggard's stage. It focuses on adoption rates in different regions based on penetration. Furthermore, the report also includes key purchase criteria and drivers of price sensitivity to help companies evaluate and develop their market growth analysis strategies.

LNG Infrastructure Market in US Share by Geography

 CUStomer Landscape

Key Companies & Market Insights

Companies are implementing various strategies, such as strategic alliances, partnerships, mergers and acquisitions, geographical expansion, and product/service launches, to enhance their presence in the market.

Bechtel Corp: The company offers LNG infrastructure solutions such as Bechtel LNG Plant.

The market research and growth report also includes detailed analyses of the competitive landscape of the market and information about key companies, including:

  • Cheniere Energy Inc.
  • Chevron Corp.
  • Chiyoda Corp.
  • Dominion Energy Inc.
  • Dow Inc.
  • Exxon Mobil Corp.
  • Fluor Corp.
  • Freeport LNG Development LP
  • McDermott International Ltd.
  • Mitsubishi Corp.
  • NextDecade Corp.
  • Saipem S.p.A.
  • Sempra Energy
  • TotalEnergies SE

Qualitative and quantitative analysis of companies has been conducted to help clients understand the wider business environment as well as the strengths and weaknesses of key market players. Data is qualitatively analyzed to categorize companies as pure play, category-focused, industry-focused, and diversified; it is quantitatively analyzed to categorize companies as dominant, leading, strong, tentative, and weak.

Liquefied Natural Gas (LNG) is a sustainable alternative to coal and oil for power generation, as it emits fewer pollutants and contributes less to carbon footprint compared to traditional fossil fuels. The increasing awareness of air pollution and climate change has led to a shift towards cleaner energy sources, making LNG an attractive option for energy consumers. The infrastructure market for LNG is witnessing significant growth due to the abundance of natural gas resources and the shale gas revolution driven by horizontal drilling and hydraulic fracturing. The energy sector's energy mix is evolving, with a focus on reducing carbon emissions and providing a cleaner environment. The market includes various projects such as liquefaction and regasification terminals, floating LNG terminals, and LNG receiving terminals. The project lifecycle involves liquefaction, regasification, logistical constraints, and city gas distribution. LNG is used as an energy source for heavy-duty vehicles and marine transport, and its imports are increasing due to energy security concerns. The global regasification capacity is expected to grow, and the use of LNG as a fuel for electric power generation is gaining popularity. LNG infrastructure projects face challenges such as high capital costs and complex construction processes. However, the benefits of using LNG as a cleaner energy source and reducing emissions from coal-to-gas conversion make it a worthwhile investment. The infrastructure market for LNG is also driven by the growing demand for alternative energy sources, including renewable technology, nuclear energy, and Compressed Natural Gas (CNG). The terminal type, heavy-duty vehicles, and marine transport sectors are significant consumers of LNG, making it an essential part of the energy mix.

Market Scope

Report Coverage

Details

Page number

133

Base year

2023

Historic period

2018 - 2022

Forecast period

2024-2028

Growth momentum & CAGR

Accelerate at a CAGR of 5.8%

Market growth 2024-2028

USD 1.04 billion

Market structure

Fragmented

YoY growth 2023-2024(%)

5.4

Competitive landscape

Leading Companies, Market Positioning of Companies, Competitive Strategies, and Industry Risks

Key companies profiled

Bechtel Corp., Cheniere Energy Inc., Chevron Corp., Chiyoda Corp., Dominion Energy Inc., Dow Inc., Exxon Mobil Corp., Fluor Corp., Freeport LNG Development LP, McDermott International Ltd., Mitsubishi Corp., NextDecade Corp., Saipem S.p.A., Sempra Energy, and TotalEnergies SE

Market dynamics

Parent market analysis, market report, market forecast, Market growth inducers and obstacles, Fast-growing and slow-growing segment analysis, COVID-19 impact and recovery analysis and future consumer dynamics, Market condition analysis for forecast period

CUStomization purview

If our report has not included the data that you are looking for, you can reach out to our analysts and get segments customized.

Download PDF Sample

What are the Key Data Covered in this Market Research Report?

  • CAGR of the market during the forecast period
  • Detailed information on factors that will drive the market growth and forecasting between 2024 and 2028
  • Precise estimation of the size of the market  and its contribution of the market in focus to the parent market
  • Accurate predictions about upcoming market growth and trends and changes in consumer behaviour
  • Growth of the market across US
  • Thorough analysis of the market's competitive landscape and detailed information about companies
  • Comprehensive analysis of factors that will challenge the growth of market companies

We can help! Our analysts can customize this market research report to meet your requirements. Get in touch

1 Executive Summary

  • 1.1 Market overview
    • Executive Summary - Chart on Market Overview
    • Executive Summary - Data Table on Market Overview
    • Executive Summary - Chart on Country Market Characteristics
    • Executive Summary - Chart on Market Segmentation by Type
    • Executive Summary - Chart on Market Segmentation by End-user
    • Executive Summary - Chart on Company Market Positioning

2 Technavio Analysis

  • 2.1 Analysis of price sensitivity, lifecycle, customer purchase basket, adoption rates, and purchase criteria
    • Analysis of price sensitivity, lifecycle, customer purchase basket, adoption rates, and purchase criteria
  • 2.2 Criticality of inputs and Factors of differentiation
    • Overview on criticality of inputs and factors of differentiation
  • 2.3 Factors of disruption
    • Overview on factors of disruption
  • 2.4 Impact of drivers and challenges
    • Impact of drivers and challenges in 2023 and 2028

3 Market Landscape

  • 3.1 Market ecosystem
    • Parent Market
    • Data Table on - Parent Market
  • 3.2 Market characteristics
    • Market characteristics analysis
  • 3.3 Value chain analysis
    • Value chain analysis

4 Market Sizing

  • 4.1 Market definition
    • Offerings of companies included in the market definition
  • 4.2 Market segment analysis
    • Market segments
  • 4.3 Market size 2023
    • 4.4 Market outlook: Forecast for 2023-2028
      • Chart on US - Market size and forecast 2023-2028 ($ million)
      • Data Table on US - Market size and forecast 2023-2028 ($ million)
      • Chart on US: Year-over-year growth 2023-2028 (%)
      • Data Table on US: Year-over-year growth 2023-2028 (%)

    5 Historic Market Size

    • 5.1 LNG Infrastructure Market in US 2018 - 2022
      • Historic Market Size - Data Table on LNG Infrastructure Market in US 2018 - 2022 ($ million)
    • 5.2 Type segment analysis 2018 - 2022
      • Historic Market Size - Type Segment 2018 - 2022 ($ million)
    • 5.3 End-user segment analysis 2018 - 2022
      • Historic Market Size - End-user Segment 2018 - 2022 ($ million)

    6 Qualitative Analysis

    • 6.1 Impact of AI on the LNG Infrastructure Market in US

      7 Five Forces Analysis

      • 7.1 Five forces summary
        • Five forces analysis - Comparison between 2023 and 2028
      • 7.2 Bargaining power of buyers
        • Bargaining power of buyers - Impact of key factors 2023 and 2028
      • 7.3 Bargaining power of suppliers
        • Bargaining power of suppliers - Impact of key factors in 2023 and 2028
      • 7.4 Threat of new entrants
        • Threat of new entrants - Impact of key factors in 2023 and 2028
      • 7.5 Threat of substitutes
        • Threat of substitutes - Impact of key factors in 2023 and 2028
      • 7.6 Threat of rivalry
        • Threat of rivalry - Impact of key factors in 2023 and 2028
      • 7.7 Market condition
        • Chart on Market condition - Five forces 2023 and 2028

      8 Market Segmentation by Type

      • 8.1 Market segments
        • Chart on Type - Market share 2023-2028 (%)
        • Data Table on Type - Market share 2023-2028 (%)
      • 8.2 Comparison by Type
        • Chart on Comparison by Type
        • Data Table on Comparison by Type
      • 8.3 Liquefaction terminal - Market size and forecast 2023-2028
        • Chart on Liquefaction terminal - Market size and forecast 2023-2028 ($ million)
        • Data Table on Liquefaction terminal - Market size and forecast 2023-2028 ($ million)
        • Chart on Liquefaction terminal - Year-over-year growth 2023-2028 (%)
        • Data Table on Liquefaction terminal - Year-over-year growth 2023-2028 (%)
      • 8.4 Regasification terminal - Market size and forecast 2023-2028
        • Chart on Regasification terminal - Market size and forecast 2023-2028 ($ million)
        • Data Table on Regasification terminal - Market size and forecast 2023-2028 ($ million)
        • Chart on Regasification terminal - Year-over-year growth 2023-2028 (%)
        • Data Table on Regasification terminal - Year-over-year growth 2023-2028 (%)
      • 8.5 Market opportunity by Type
        • Market opportunity by Type ($ million)
        • Data Table on Market opportunity by Type ($ million)

      9 Market Segmentation by End-user

      • 9.1 Market segments
        • Chart on End-user - Market share 2023-2028 (%)
        • Data Table on End-user - Market share 2023-2028 (%)
      • 9.2 Comparison by End-user
        • Chart on Comparison by End-user
        • Data Table on Comparison by End-user
      • 9.3 Power generation - Market size and forecast 2023-2028
        • Chart on Power generation - Market size and forecast 2023-2028 ($ million)
        • Data Table on Power generation - Market size and forecast 2023-2028 ($ million)
        • Chart on Power generation - Year-over-year growth 2023-2028 (%)
        • Data Table on Power generation - Year-over-year growth 2023-2028 (%)
      • 9.4 Transportation fuel - Market size and forecast 2023-2028
        • Chart on Transportation fuel - Market size and forecast 2023-2028 ($ million)
        • Data Table on Transportation fuel - Market size and forecast 2023-2028 ($ million)
        • Chart on Transportation fuel - Year-over-year growth 2023-2028 (%)
        • Data Table on Transportation fuel - Year-over-year growth 2023-2028 (%)
      • 9.5 Others - Market size and forecast 2023-2028
        • Chart on Others - Market size and forecast 2023-2028 ($ million)
        • Data Table on Others - Market size and forecast 2023-2028 ($ million)
        • Chart on Others - Year-over-year growth 2023-2028 (%)
        • Data Table on Others - Year-over-year growth 2023-2028 (%)
      • 9.6 Market opportunity by End-user
        • Market opportunity by End-user ($ million)
        • Data Table on Market opportunity by End-user ($ million)

      10 Customer Landscape

      • 10.1 Customer landscape overview
        • Analysis of price sensitivity, lifecycle, customer purchase basket, adoption rates, and purchase criteria

      11 Drivers, Challenges, and Opportunity/Restraints

      • 11.1 Market drivers
        • 11.2 Market challenges
          • 11.3 Impact of drivers and challenges
            • Impact of drivers and challenges in 2023 and 2028
          • 11.4 Market opportunities/restraints

            12 Competitive Landscape

            • 12.1 Overview
              • 12.2 Competitive Landscape
                • Overview on criticality of inputs and factors of differentiation
              • 12.3 Landscape disruption
                • Overview on factors of disruption
              • 12.4 Industry risks
                • Impact of key risks on business

              13 Competitive Analysis

              • 13.1 Companies profiled
                • Companies covered
              • 13.2 Company ranking index
                • Company ranking index
              • 13.3 Market positioning of companies
                • Matrix on companies position and classification
              • 13.4 Bechtel Corp.
                • Bechtel Corp. - Overview
                • Bechtel Corp. - Product / Service
                • Bechtel Corp. - Key news
                • Bechtel Corp. - Key offerings
                • SWOT
              • 13.5 Cheniere Energy Inc.
                • Cheniere Energy Inc. - Overview
                • Cheniere Energy Inc. - Product / Service
                • Cheniere Energy Inc. - Key news
                • Cheniere Energy Inc. - Key offerings
                • SWOT
              • 13.6 Chevron Corp.
                • Chevron Corp. - Overview
                • Chevron Corp. - Business segments
                • Chevron Corp. - Key news
                • Chevron Corp. - Key offerings
                • Chevron Corp. - Segment focus
                • SWOT
              • 13.7 Chiyoda Corp.
                • Chiyoda Corp. - Overview
                • Chiyoda Corp. - Business segments
                • Chiyoda Corp. - Key news
                • Chiyoda Corp. - Key offerings
                • Chiyoda Corp. - Segment focus
                • SWOT
              • 13.8 Exxon Mobil Corp.
                • Exxon Mobil Corp. - Overview
                • Exxon Mobil Corp. - Business segments
                • Exxon Mobil Corp. - Key news
                • Exxon Mobil Corp. - Key offerings
                • Exxon Mobil Corp. - Segment focus
                • SWOT
              • 13.9 Fluor Corp.
                • Fluor Corp. - Overview
                • Fluor Corp. - Business segments
                • Fluor Corp. - Key news
                • Fluor Corp. - Key offerings
                • Fluor Corp. - Segment focus
                • SWOT
              • 13.10 McDermott International Ltd.
                • McDermott International Ltd. - Overview
                • McDermott International Ltd. - Product / Service
                • McDermott International Ltd. - Key news
                • McDermott International Ltd. - Key offerings
                • SWOT
              • 13.11 NextDecade Corp.
                • NextDecade Corp. - Overview
                • NextDecade Corp. - Product / Service
                • NextDecade Corp. - Key news
                • NextDecade Corp. - Key offerings
                • SWOT
              • 13.12 Sempra Energy
                • Sempra Energy - Overview
                • Sempra Energy - Business segments
                • Sempra Energy - Key news
                • Sempra Energy - Key offerings
                • Sempra Energy - Segment focus
                • SWOT
              • 13.13 TotalEnergies SE
                • TotalEnergies SE - Overview
                • TotalEnergies SE - Business segments
                • TotalEnergies SE - Key news
                • TotalEnergies SE - Key offerings
                • TotalEnergies SE - Segment focus
                • SWOT

              14 Appendix

              • 14.1 Scope of the report
                • 14.2 Inclusions and exclusions checklist
                  • Inclusions checklist
                  • Exclusions checklist
                • 14.3 Currency conversion rates for US$
                  • Currency conversion rates for US$
                • 14.4 Research methodology
                  • Research methodology
                • 14.5 Data procurement
                  • Information sources
                • 14.6 Data validation
                  • Data validation
                • 14.7 Validation techniques employed for market sizing
                  • Validation techniques employed for market sizing
                • 14.8 Data synthesis
                  • Data synthesis
                • 14.9 360 degree market analysis
                  • 360 degree market analysis
                • 14.10 List of abbreviations
                  • List of abbreviations

                Research Methodology

                Technavio presents a detailed picture of the market by way of study, synthesis, and summation of data from multiple sources. The analysts have presented the various facets of the market with a particular focus on identifying the key industry influencers. The data thus presented is comprehensive, reliable, and the result of extensive research, both primary and secondary.

                INFORMATION SOURCES

                Primary sources

                • Manufacturers and suppliers
                • Channel partners
                • Industry experts
                • Strategic decision makers

                Secondary sources

                • Industry journals and periodicals
                • Government data
                • Financial reports of key industry players
                • Historical data
                • Press releases

                DATA ANALYSIS

                Data Synthesis

                • Collation of data
                • Estimation of key figures
                • Analysis of derived insights

                Data Validation

                • Triangulation with data models
                • Reference against proprietary databases
                • Corroboration with industry experts

                REPORT WRITING

                Qualitative

                • Market drivers
                • Market challenges
                • Market trends
                • Five forces analysis

                Quantitative

                • Market size and forecast
                • Market segmentation
                • Geographical insights
                • Competitive landscape

                Interested in this report?

                Get your sample now to see our research methodology and insights!

                Download Now

                Frequently Asked Questions

                Lng Infrastructure market growth will increase by $ 1036.6 mn during 2024-2028.

                The Lng Infrastructure market is expected to grow at a CAGR of 5.8% during 2024-2028.

                Lng Infrastructure market is segmented by Type( Liquefaction terminal, Regasification terminal, Others) End-user( Power generation, Transportation fuel, Others)

                Bechtel Corp., Cheniere Energy Inc., Chevron Corp., Chiyoda Corp., Dominion Energy Inc., Dow Inc., Exxon Mobil Corp., Fluor Corp., Freeport LNG Development LP, McDermott International Ltd., Mitsubishi Corp., NextDecade Corp., Saipem S.p.A., Sempra Energy, TotalEnergies SE are a few of the key vendors in the Lng Infrastructure market.

                North America will register the highest growth rate of 100% among the other regions. Therefore, the Lng Infrastructure market in North America is expected to garner significant business opportunities for the vendors during the forecast period.

                US, North America

                • Increase in LNG productionThe increase in the supply of coalbed methane is the driving factor this market.
                • shale gas is the driving factor this market.
                • and tight gas has made natural gas one of the fastest-growing fossil fuels in the US. Hence is the driving factor this market.
                • the oil and gas industry will experience a significant increase in unconventional oil and gas resources.Since 2008 is the driving factor this market.
                • the US has been successfully extracting shale oil and gas is the driving factor this market.
                • significantly boosting the global oil and gas supply. According to the US Energy Information Administration (EIA) is the driving factor this market.
                • shale gas production in the US increased from 68% in 2018 to 71% in 2019. The International Energy Agency (IEA) reported that the increase in natural gas production in US accounted for 49% of global natural gas output growth in 2022. The Permian Basin has been a major contributor is the driving factor this market.
                • with output expected to double by 2025. By 2022 is the driving factor this market.
                • the US produced 890 billion cubic meters (bcm) or 22% of global natural gas production. Despite rising domestic demand is the driving factor this market.
                • more than half of the additional natural gas produced is being converted into LNG for export to countries with insufficient domestic production. Hence is the driving factor this market.
                • the increase in natural gas production has led to a rise in LNG production is the driving factor this market.
                • which is likely to boost the demand for LNG infrastructure in the US during the forecast period. is the driving factor this market.

                The Lng Infrastructure market vendors should focus on grabbing business opportunities from the Liquefaction terminal segment as it accounted for the largest market share in the base year.