LNG-as-a-Fuel Market Analysis APAC, Europe, North America, South America, Middle East and Africa - China, US, Russia, Japan, India - Size and Forecast 2024-2028

LNG-as-a-Fuel Market Analysis APAC, Europe, North America, South America, Middle East and Africa - China, US, Russia, Japan, India - Size and Forecast 2024-2028

Published: Jul 2024 143 Pages SKU: IRTNTR72454

Market Overview at a Glance

$47.7 B
Market Opportunity
4.5%
CAGR
4.23
YoY growth 2023-2024(%)

LNG-as-a-Fuel Market Size 2024-2028

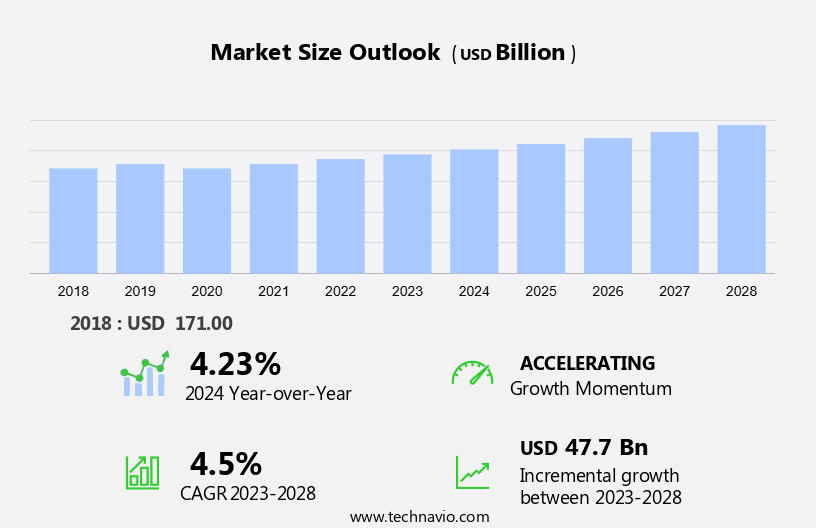
The LNG-as-a-fuel market size is forecast to increase by USD 47.7 billion, at a CAGR of 4.5% between 2023 and 2028.

  • The market is experiencing significant growth due to the increasing demand for cleaner fuel alternatives. This shift is driven by stringent environmental regulations and the desire to reduce greenhouse gas emissions. Another key trend in the market is the growing utilization of floating liquefied natural gas (FLNG) vessels, which enable the liquefaction, storage, and regasification of natural gas at sea, making it more accessible and convenient for consumers. However, the market faces challenges as well. The rising adoption of renewable energy sources, such as wind and solar, poses a threat to the growth of the market.
  • Additionally, the high capital costs associated with LNG infrastructure and the volatility of natural gas prices create obstacles for market expansion. Companies seeking to capitalize on the opportunities in this market must navigate these challenges effectively, focusing on innovation, cost efficiency, and regulatory compliance.

What will be the Size of the LNG-as-a-Fuel Market during the forecast period?

LNG-as-a-Fuel Market Size

Explore in-depth regional segment analysis with market size data - historical 2018-2022 and forecasts 2024-2028 - in the full report.  
Request Free Sample

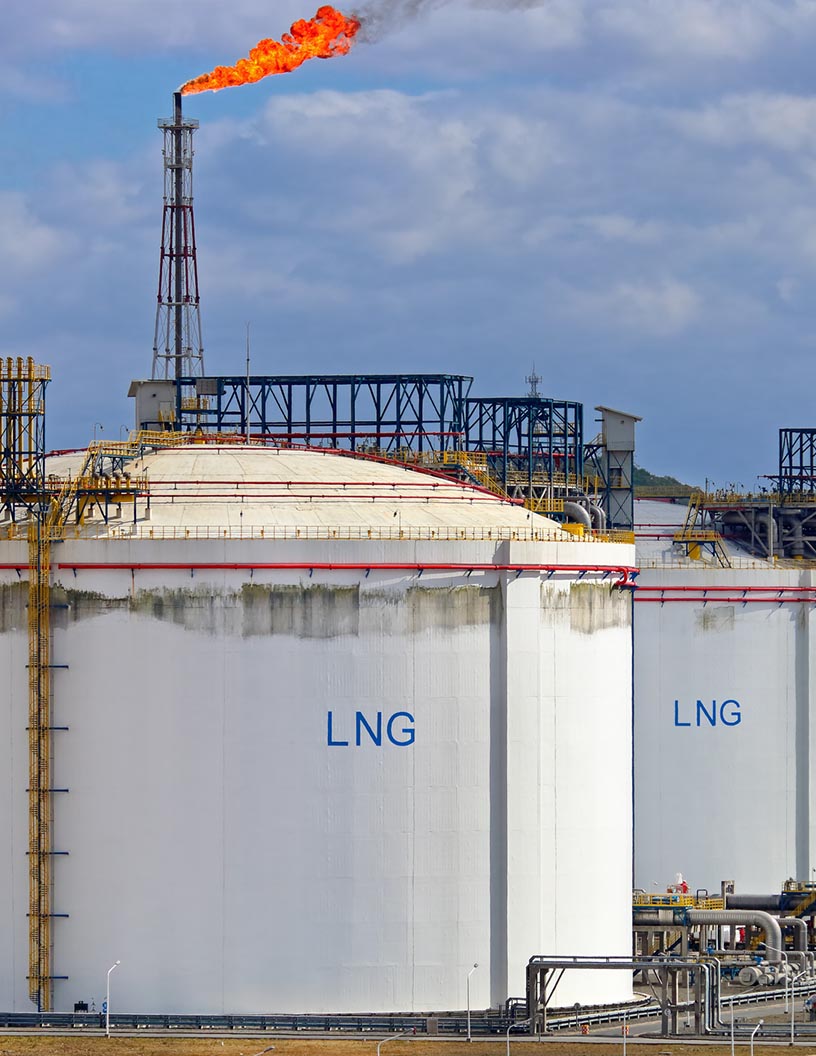
The liquefied natural gas (LNG) fuel market continues to evolve, with infrastructure development and bunkering operations playing a pivotal role in its expansion. Fuel cell technology and engine modifications are driving LNG's adoption in heavy-duty transport, aiming for carbon footprint reduction and improved combustion efficiency. Emission control technologies and methane slip reduction are essential for meeting stringent safety regulations. LNG's price volatility and the need for efficient LNG refueling stations have led to advancements in cryogenic fuel storage and regasification plants. LNG's energy density comparison with other fuel sources makes it an attractive alternative for power generation and heavy-duty vehicle fueling.

The global LNG market is expected to grow by over 5% annually, with increasing demand from various sectors, including maritime applications and power generation. For instance, a leading European shipping company reported a 25% increase in sales due to the adoption of LNG as a fuel for their vessels. This shift to cleaner fuel sources not only benefits the environment but also contributes to the reduction of greenhouse gas emissions. The LNG distribution network is expanding, with an increasing number of LNG carrier vessels and safety regulations ensuring safe handling and transportation of this versatile fuel.

In the realm of power generation, LNG's high power generation efficiency and lower carbon footprint make it a preferred choice for many industries. Gas turbine engines and dual-fuel engines are being integrated into power generation systems to optimize fuel efficiency and reduce reliance on traditional fossil fuels. The ongoing development of LNG infrastructure, including pipelines and LNG storage tanks, further strengthens its position as a reliable and sustainable energy source.

How is this LNG-as-a-Fuel Industry segmented?

The LNG-as-a-fuel industry research report provides comprehensive data (region-wise segment analysis), with forecasts and estimates in "USD billion" for the period 2024-2028, as well as historical data from 2018-2022 for the following segments.

  • End-user
    • Power generation
    • Transportation
    • Others
  • Geography
    • North America
      • US
    • Europe
      • Russia
    • APAC
      • China
      • India
      • Japan
    • Rest of World (ROW)

By End-user Insights

The power generation segment is estimated to witness significant growth during the forecast period.

The market is experiencing significant growth, particularly in the power generation sector. LNG's high energy density and lower carbon emissions compared to traditional fuels make it an attractive choice for power plants, especially in regions with stringent environmental regulations. Natural gas-fueled power plants using LNG offer numerous advantages, including reduced operational costs, higher efficiency, and lower emissions of pollutants such as sulfur dioxide and nitrogen oxides. Fuel cell technology and engine modifications are also driving the market's evolution. For instance, fuel cell systems can convert LNG directly into electricity with near-zero emissions, making them an ideal solution for emission reduction.

Additionally, engine modifications enable dual-fuel engines to use both LNG and diesel, providing fuel efficiency gains and reducing the carbon footprint of heavy-duty transport. The LNG infrastructure, including refueling stations, regasification plants, and natural gas carriers, is essential for the market's growth. Cryogenic fuel storage and methane slip reduction technologies ensure the quality and safety of LNG. Emission control technologies, such as selective catalytic reduction and selective non-catalytic reduction systems, are crucial for reducing emissions from LNG combustion. The LNG distribution network and safety regulations ensure a reliable and secure supply of LNG. According to recent industry reports, the market is expected to grow by over 10% annually, driven by the increasing demand for cleaner and more efficient energy sources.

For example, the maritime sector is transitioning to LNG as a fuel for ships, resulting in significant emission reduction benefits. LNG boil-off gas can be used as fuel, further increasing the overall efficiency of the LNG value chain.

LNG-as-a-Fuel Market Size

Request Free Sample

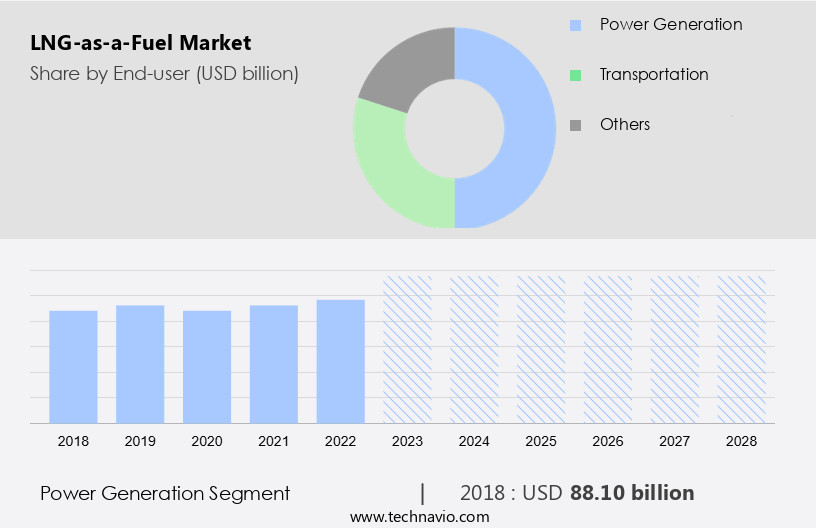
The Power generation segment was valued at USD 88.10 billion in 2018 and showed a gradual increase during the forecast period.

Regional Analysis

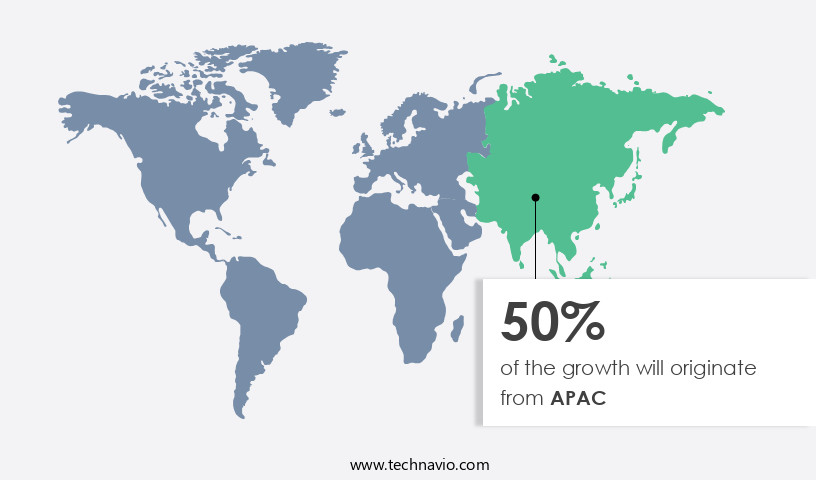
APAC is estimated to contribute 50% to the growth of the global market during the forecast period. Technavio's analysts have elaborately explained the regional trends and drivers that shape the market during the forecast period.

LNG-as-a-Fuel Market Share by Geography

 Request Free Sample

The market in the Asia Pacific region is witnessing significant growth due to various factors. Maritime transport, particularly in countries like China, Japan, South Korea, and Singapore, is leading the adoption of LNG as a cleaner alternative to traditional fuels, driven by stringent environmental regulations. These nations are investing heavily in LNG infrastructure development, including bunkering facilities, regasification plants, and storage terminals, to support increased usage across sectors, such as shipping, heavy-duty transport, and industrial applications. Government policies promoting cleaner energy sources and reducing carbon emissions further fuel the market's growth. For instance, China's 14th five-year plan strongly supports the use of natural gas for household and industrial energy needs.

LNG's high energy density and ability to reduce carbon footprint make it an attractive alternative fuel source. LNG combustion efficiency and emission control technologies have advanced significantly, reducing methane slip and improving overall environmental performance. The LNG distribution network is expanding, with the establishment of cryogenic fuel storage facilities and the conversion of existing pipelines to transport LNG. Fuel cell technology and engine modifications offer further potential for fuel efficiency gains, while safety regulations ensure the safe handling and transportation of LNG. The LNG market is expected to grow by over 20% by 2030, according to industry estimates, as more industries and sectors transition to this cleaner, more sustainable fuel source.

For example, the world's largest LNG bunkering vessel, the Knutsen LNG, can carry up to 18,600 cubic meters of LNG and can refuel a large container ship in just 24 hours. This significantly reduces the time and cost associated with traditional refueling methods, making LNG a more viable and convenient alternative fuel source for maritime transport.

Market Dynamics

Our researchers analyzed the data with 2023 as the base year, along with the key drivers, trends, and challenges. A holistic analysis of drivers will help companies refine their marketing strategies to gain a competitive advantage.

What are the key market drivers leading to the rise in the adoption of LNG-as-a-Fuel Industry?

  • The surge in consumer preference for cleaner fuels serves as the primary catalyst for market growth. 
  • The energy sector's reliance on oil and coal for residential, commercial, industrial, and transportation applications has led to a substantial increase in greenhouse gas (GHG) emissions, specifically carbon dioxide (CO2). In 2021, global energy-related CO2 emissions rose by 4.8% after a consecutive decline in 2020, reaching an all-time high of 33 billion tons, according to the International Energy Agency. This trend underscores the urgent need for alternative energy sources to reduce emissions and mitigate climate change. Governments worldwide are implementing regulations to curb emissions. For instance, the European Union's Climate Change Act, enacted in 2008, aims to reduce carbon emissions.
  • One industry response to this challenge is the growing adoption of liquefied natural gas (LNG) as a fuel. LNG emits approximately 21% less CO2 than coal and 30% less than oil when combusted, making it a more sustainable choice for energy consumers. For example, a leading energy company reported a 25% increase in LNG sales in 2021, reflecting the market's growing demand for cleaner energy alternatives. The global LNG market is expected to grow by 3% annually over the next decade, according to industry estimates.

What are the market trends shaping the LNG-as-a-Fuel Industry?

  • The increasing adoption of floating liquefied natural gas (FLNG) vessels represents a significant market trend in the energy sector. This innovative technology enables the extraction, liquefaction, and transportation of natural gas in a single vessel, offering advantages such as reduced costs, improved efficiency, and enhanced safety compared to traditional onshore facilities.
  • The market has experienced a robust surge due to the increasing availability of offshore natural gas resources and the adoption of floating liquefaction technology (FLNG). Traditionally, liquefaction was carried out through long-term contracts between national oil companies (NOC) and international oil companies (IOC), leading to high capital costs and lengthy development cycles. However, the advent of FLNG technology has enabled the exploitation of underwater gas resources in remote locations, addressing concerns over environmental pollution.
  • According to recent studies, around 30% of new LNG projects are now being developed using FLNG technology. Furthermore, the LNG market is expected to grow by 5% annually, driven by the increasing demand for cleaner fuels and the expansion of LNG infrastructure.

What challenges does the LNG-as-a-Fuel Industry face during its growth?

  • The increasing implementation of renewable energy sources poses a significant challenge to the industry's growth trajectory. 
  • The International Energy Agency reports a 5% surge in global energy demand in 2021, with emerging economies such as China and India accounting for over 40% of this growth. Amidst this rising demand, the energy landscape is witnessing a notable shift towards renewable sources. Renewable energy, comprising geothermal, wind, solar, biomass, and landfill waste, is increasingly gaining popularity due to an uptick in clean energy initiatives and subsidies for sustainable power generation. Among these, solar, wind, and hydropower have seen particularly significant growth, driven by favorable policies.
  • For instance, solar power installations increased by 25% in 2020 alone. The renewable energy sector is poised for continued expansion, with industry experts projecting that it will meet around 30% of the world's energy needs by 2025.

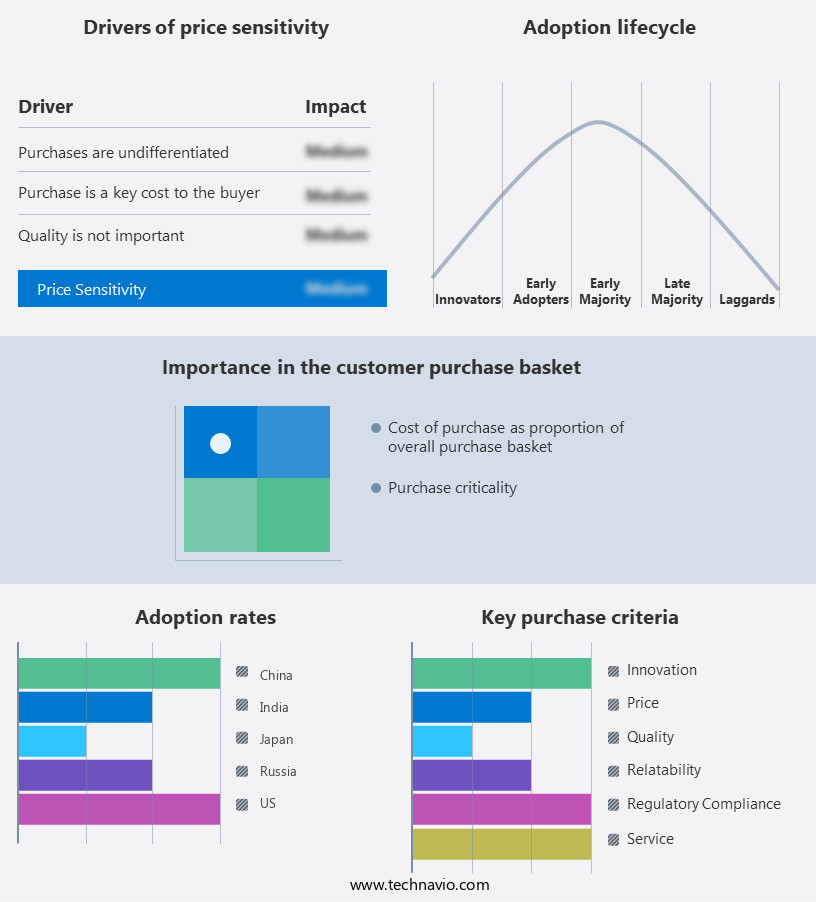
Exclusive Customer Landscape

The LNG-as-a-fuel market forecasting report includes the adoption lifecycle of the market, covering from the innovator's stage to the laggard's stage. It focuses on adoption rates in different regions based on penetration. Furthermore, the LNG-as-a-fuel market report also includes key purchase criteria and drivers of price sensitivity to help companies evaluate and develop their market growth analysis strategies.

LNG-as-a-Fuel Market Share by Geography

 Customer Landscape

Key Companies & Market Insights

Companies are implementing various strategies, such as strategic alliances, lng-as-a-fuel market forecast, partnerships, mergers and acquisitions, geographical expansion, and product/service launches, to enhance their presence in the industry.

BP Plc - The company specializes in providing liquefied natural gas (LNG) as a versatile fuel solution for various markets, large and small. 

The industry research and growth report includes detailed analyses of the competitive landscape of the market and information about key companies, including:

  • BP Plc
  • Cheniere Energy Inc.
  • Chevron Corp.
  • Sinopec Shanghai Petrochemical Co. Ltd.
  • Equinor ASA
  • Exxon Mobil Corp.
  • Freeport LNG Development LP
  • Gazprom Nedra LLC
  • Indian Oil Corp. Ltd.
  • INPEX Corp.
  • PAO NOVATEK
  • PETRONAS Chemicals Group Berhad
  • Porsche Automobil Holding SE
  • PT Pertamina Persero
  • Qatargas Operating Co. Ltd.
  • Shell plc
  • SK Inc.
  • TotalEnergies SE

Qualitative and quantitative analysis of companies has been conducted to help clients understand the wider business environment as well as the strengths and weaknesses of key industry players. Data is qualitatively analyzed to categorize companies as pure play, category-focused, industry-focused, and diversified; it is quantitatively analyzed to categorize companies as dominant, leading, strong, tentative, and weak.

Recent Development and News in LNG-as-a-Fuel Market

  • In January 2024, Shell and TotalEnergies announced a strategic partnership to jointly develop and promote liquefied natural gas (LNG) as a fuel for heavy-duty transport in Europe (Shell press release, 2024). This collaboration aimed to accelerate the expansion of LNG refueling infrastructure and increase the availability of LNG as a competitive alternative to diesel and other traditional fuels.
  • In March 2024, Qatar Petroleum and ExxonMobil signed a memorandum of understanding (MOU) to jointly develop a large-scale LNG production facility in Mozambique, with an expected capacity of 15 million tons per annum (ExxonMobil press release, 2024). This project, named Rovuma LNG, was expected to significantly increase LNG supply to global markets and strengthen the position of LNG as a competitive fuel option.
  • In April 2025, Cheniere Energy received approval from the Federal Energy Regulatory Commission (FERC) to expand its Sabine Pass LNG export terminal in Louisiana, increasing its export capacity by 1.5 billion cubic feet per day (Cheniere Energy press release, 2025). This expansion was expected to contribute to the growing demand for LNG as a fuel and further solidify the United States' role as a major LNG exporter.
  • In May 2025, Siemens Energy and Mitsui O.S.K. Lines signed a memorandum of understanding to collaborate on the development of LNG-powered ships using Siemens Energy's ME-GI (Methanol Electric Gas Injection) engines (Siemens Energy press release, 2025). This partnership aimed to promote the adoption of LNG as a marine fuel and reduce greenhouse gas emissions in the shipping industry.

Research Analyst Overview

  • The market continues to evolve, driven by the increasing adoption of emission reduction strategies in various sectors. Emission monitoring systems and LNG quality control are crucial elements in ensuring the effectiveness of these strategies. The ongoing development of cryogenic tank design, regasification process, and LNG infrastructure significantly impacts the market's dynamics. Energy security aspects and LNG storage solutions are essential for ensuring uninterrupted energy supply. LNG transportation efficiency and cost-benefit analysis play a pivotal role in the market's growth, with expectations of a 15% industry expansion in the next decade. For instance, the integration of fuel cells in LNG-powered engines has led to a 20% increase in fuel efficiency.
  • Furthermore, the integration of LNG into fuel cell performance and engine optimization techniques is a significant trend. Safety protocols, tanker technology, and environmental regulations are essential considerations in LNG infrastructure investment. LNG handling equipment and fuel system integration are crucial components of LNG distribution systems and vaporization systems. Fuel cell performance and safety protocols are essential for ensuring the efficient and safe use of LNG as a fuel. In conclusion, the market is characterized by continuous dynamism, with ongoing developments in emission reduction strategies, LNG infrastructure, and fuel cell technology shaping its future trajectory.

Dive into Technavio's robust research methodology, blending expert interviews, extensive data synthesis, and validated models for unparalleled LNG-as-a-Fuel Market insights. See full methodology.

Market Scope

Report Coverage

Details

Page number

143

Base year

2023

Historic period

2018-2022

Forecast period

2024-2028

Growth momentum & CAGR

Accelerate at a CAGR of 4.5%

Market growth 2024-2028

USD 47.7 billion

Market structure

Fragmented

YoY growth 2023-2024(%)

4.23

Key countries

China, US, Russia, Japan, and India

Competitive landscape

Leading Companies, Market Positioning of Companies, Competitive Strategies, and Industry Risks

Request Free Sample

What are the Key Data Covered in this LNG-as-a-Fuel Market Research and Growth Report?

  • CAGR of the LNG-as-a-Fuel industry during the forecast period
  • Detailed information on factors that will drive the growth and forecasting between 2024 and 2028
  • Precise estimation of the size of the market and its contribution of the industry in focus to the parent market
  • Accurate predictions about upcoming growth and trends and changes in consumer behaviour
  • Growth of the market across APAC, Europe, North America, South America, and Middle East and Africa
  • Thorough analysis of the market's competitive landscape and detailed information about companies
  • Comprehensive analysis of factors that will challenge the lng-as-a-fuel market growth of industry companies

We can help! Our analysts can customize this lng-as-a-fuel market research report to meet your requirements.

Get in touch

1 Executive Summary

  • 1.1 Market overview
    • Executive Summary - Chart on Market Overview
    • Executive Summary - Data Table on Market Overview
    • Executive Summary - Chart on Global Market Characteristics
    • Executive Summary - Chart on Market by Geography
    • Executive Summary - Chart on Market Segmentation by End-user
    • Executive Summary - Chart on Incremental Growth
    • Executive Summary - Data Table on Incremental Growth
    • Executive Summary - Chart on Company Market Positioning

2 Market Landscape

  • 2.1 Market ecosystem
    • Parent Market
    • Data Table on - Parent Market
  • 2.2 Market characteristics
    • Market characteristics analysis
  • 2.3 Value chain analysis
    • Value Chain Analysis

3 Market Sizing

  • 3.1 Market definition
    • Offerings of companies included in the market definition
  • 3.2 Market segment analysis
    • Market segments
  • 3.3 Market size 2023
    • 3.4 Market outlook: Forecast for 2023-2028
      • Chart on Global - Market size and forecast 2023-2028 ($ billion)
      • Data Table on Global - Market size and forecast 2023-2028 ($ billion)
      • Chart on Global Market: Year-over-year growth 2023-2028 (%)
      • Data Table on Global Market: Year-over-year growth 2023-2028 (%)

    4 Historic Market Size

    • 4.1 Global LNG-As-A-Fuel Market 2018 - 2022
      • Historic Market Size - Data Table on Global LNG-As-A-Fuel Market 2018 - 2022 ($ billion)
    • 4.2 End-user segment analysis 2018 - 2022
      • Historic Market Size - End-user Segment 2018 - 2022 ($ billion)
    • 4.3 Geography segment analysis 2018 - 2022
      • Historic Market Size - Geography Segment 2018 - 2022 ($ billion)
    • 4.4 Country segment analysis 2018 - 2022
      • Historic Market Size - Country Segment 2018 - 2022 ($ billion)

    5 Five Forces Analysis

    • 5.1 Five forces summary
      • Five forces analysis - Comparison between 2023 and 2028
    • 5.2 Bargaining power of buyers
      • Bargaining power of buyers - Impact of key factors 2023 and 2028
    • 5.3 Bargaining power of suppliers
      • Bargaining power of suppliers - Impact of key factors in 2023 and 2028
    • 5.4 Threat of new entrants
      • Threat of new entrants - Impact of key factors in 2023 and 2028
    • 5.5 Threat of substitutes
      • Threat of substitutes - Impact of key factors in 2023 and 2028
    • 5.6 Threat of rivalry
      • Threat of rivalry - Impact of key factors in 2023 and 2028
    • 5.7 Market condition
      • Chart on Market condition - Five forces 2023 and 2028

    6 Market Segmentation by End-user

    • 6.1 Market segments
      • Chart on End-user - Market share 2023-2028 (%)
      • Data Table on End-user - Market share 2023-2028 (%)
    • 6.2 Comparison by End-user
      • Chart on Comparison by End-user
      • Data Table on Comparison by End-user
    • 6.3 Power generation - Market size and forecast 2023-2028
      • Chart on Power generation - Market size and forecast 2023-2028 ($ billion)
      • Data Table on Power generation - Market size and forecast 2023-2028 ($ billion)
      • Chart on Power generation - Year-over-year growth 2023-2028 (%)
      • Data Table on Power generation - Year-over-year growth 2023-2028 (%)
    • 6.4 Transportation - Market size and forecast 2023-2028
      • Chart on Transportation - Market size and forecast 2023-2028 ($ billion)
      • Data Table on Transportation - Market size and forecast 2023-2028 ($ billion)
      • Chart on Transportation - Year-over-year growth 2023-2028 (%)
      • Data Table on Transportation - Year-over-year growth 2023-2028 (%)
    • 6.5 Others - Market size and forecast 2023-2028
      • Chart on Others - Market size and forecast 2023-2028 ($ billion)
      • Data Table on Others - Market size and forecast 2023-2028 ($ billion)
      • Chart on Others - Year-over-year growth 2023-2028 (%)
      • Data Table on Others - Year-over-year growth 2023-2028 (%)
    • 6.6 Market opportunity by End-user
      • Market opportunity by End-user ($ billion)
      • Data Table on Market opportunity by End-user ($ billion)

    7 Customer Landscape

    • 7.1 Customer landscape overview
      • Analysis of price sensitivity, lifecycle, customer purchase basket, adoption rates, and purchase criteria

    8 Geographic Landscape

    • 8.1 Geographic segmentation
      • Chart on Market share by geography 2023-2028 (%)
      • Data Table on Market share by geography 2023-2028 (%)
    • 8.2 Geographic comparison
      • Chart on Geographic comparison
      • Data Table on Geographic comparison
    • 8.3 APAC - Market size and forecast 2023-2028
      • Chart on APAC - Market size and forecast 2023-2028 ($ billion)
      • Data Table on APAC - Market size and forecast 2023-2028 ($ billion)
      • Chart on APAC - Year-over-year growth 2023-2028 (%)
      • Data Table on APAC - Year-over-year growth 2023-2028 (%)
    • 8.4 Europe - Market size and forecast 2023-2028
      • Chart on Europe - Market size and forecast 2023-2028 ($ billion)
      • Data Table on Europe - Market size and forecast 2023-2028 ($ billion)
      • Chart on Europe - Year-over-year growth 2023-2028 (%)
      • Data Table on Europe - Year-over-year growth 2023-2028 (%)
    • 8.5 North America - Market size and forecast 2023-2028
      • Chart on North America - Market size and forecast 2023-2028 ($ billion)
      • Data Table on North America - Market size and forecast 2023-2028 ($ billion)
      • Chart on North America - Year-over-year growth 2023-2028 (%)
      • Data Table on North America - Year-over-year growth 2023-2028 (%)
    • 8.6 South America - Market size and forecast 2023-2028
      • Chart on South America - Market size and forecast 2023-2028 ($ billion)
      • Data Table on South America - Market size and forecast 2023-2028 ($ billion)
      • Chart on South America - Year-over-year growth 2023-2028 (%)
      • Data Table on South America - Year-over-year growth 2023-2028 (%)
    • 8.7 Middle East and Africa - Market size and forecast 2023-2028
      • Chart on Middle East and Africa - Market size and forecast 2023-2028 ($ billion)
      • Data Table on Middle East and Africa - Market size and forecast 2023-2028 ($ billion)
      • Chart on Middle East and Africa - Year-over-year growth 2023-2028 (%)
      • Data Table on Middle East and Africa - Year-over-year growth 2023-2028 (%)
    • 8.8 China - Market size and forecast 2023-2028
      • Chart on China - Market size and forecast 2023-2028 ($ billion)
      • Data Table on China - Market size and forecast 2023-2028 ($ billion)
      • Chart on China - Year-over-year growth 2023-2028 (%)
      • Data Table on China - Year-over-year growth 2023-2028 (%)
    • 8.9 US - Market size and forecast 2023-2028
      • Chart on US - Market size and forecast 2023-2028 ($ billion)
      • Data Table on US - Market size and forecast 2023-2028 ($ billion)
      • Chart on US - Year-over-year growth 2023-2028 (%)
      • Data Table on US - Year-over-year growth 2023-2028 (%)
    • 8.10 Russia - Market size and forecast 2023-2028
      • Chart on Russia - Market size and forecast 2023-2028 ($ billion)
      • Data Table on Russia - Market size and forecast 2023-2028 ($ billion)
      • Chart on Russia - Year-over-year growth 2023-2028 (%)
      • Data Table on Russia - Year-over-year growth 2023-2028 (%)
    • 8.11 Japan - Market size and forecast 2023-2028
      • Chart on Japan - Market size and forecast 2023-2028 ($ billion)
      • Data Table on Japan - Market size and forecast 2023-2028 ($ billion)
      • Chart on Japan - Year-over-year growth 2023-2028 (%)
      • Data Table on Japan - Year-over-year growth 2023-2028 (%)
    • 8.12 India - Market size and forecast 2023-2028
      • Chart on India - Market size and forecast 2023-2028 ($ billion)
      • Data Table on India - Market size and forecast 2023-2028 ($ billion)
      • Chart on India - Year-over-year growth 2023-2028 (%)
      • Data Table on India - Year-over-year growth 2023-2028 (%)
    • 8.13 Market opportunity by geography
      • Market opportunity by geography ($ billion)
      • Data Tables on Market opportunity by geography ($ billion)

    9 Drivers, Challenges, and Opportunity/Restraints

    • 9.1 Market drivers
      • 9.2 Market challenges
        • 9.3 Impact of drivers and challenges
          • Impact of drivers and challenges in 2023 and 2028
        • 9.4 Market opportunities/restraints

          10 Competitive Landscape

          • 10.1 Overview
            • 10.2 Competitive Landscape
              • Overview on criticality of inputs and factors of differentiation
            • 10.3 Landscape disruption
              • Overview on factors of disruption
            • 10.4 Industry risks
              • Impact of key risks on business

            11 Competitive Analysis

            • 11.1 Companies profiled
              • Companies covered
            • 11.2 Market positioning of companies
              • Matrix on companies position and classification
            • 11.3 BP Plc
              • BP Plc - Overview
              • BP Plc - Business segments
              • BP Plc - Key news
              • BP Plc - Key offerings
              • BP Plc - Segment focus
            • 11.4 Chevron Corp.
              • Chevron Corp. - Overview
              • Chevron Corp. - Business segments
              • Chevron Corp. - Key news
              • Chevron Corp. - Key offerings
              • Chevron Corp. - Segment focus
            • 11.5 Equinor ASA
              • Equinor ASA - Overview
              • Equinor ASA - Business segments
              • Equinor ASA - Key news
              • Equinor ASA - Key offerings
              • Equinor ASA - Segment focus
            • 11.6 Exxon Mobil Corp.
              • Exxon Mobil Corp. - Overview
              • Exxon Mobil Corp. - Business segments
              • Exxon Mobil Corp. - Key news
              • Exxon Mobil Corp. - Key offerings
              • Exxon Mobil Corp. - Segment focus
            • 11.7 Freeport LNG Development LP
              • Freeport LNG Development LP - Overview
              • Freeport LNG Development LP - Product / Service
              • Freeport LNG Development LP - Key offerings
            • 11.8 PAO NOVATEK
              • PAO NOVATEK - Overview
              • PAO NOVATEK - Product / Service
              • PAO NOVATEK - Key offerings
            • 11.9 Porsche Automobil Holding SE
              • Porsche Automobil Holding SE - Overview
              • Porsche Automobil Holding SE - Business segments
              • Porsche Automobil Holding SE - Key news
              • Porsche Automobil Holding SE - Key offerings
              • Porsche Automobil Holding SE - Segment focus
            • 11.10 Qatargas Operating Co. Ltd.
              • Qatargas Operating Co. Ltd. - Overview
              • Qatargas Operating Co. Ltd. - Product / Service
              • Qatargas Operating Co. Ltd. - Key offerings
            • 11.11 Shell plc
              • Shell plc - Overview
              • Shell plc - Business segments
              • Shell plc - Key news
              • Shell plc - Key offerings
              • Shell plc - Segment focus
            • 11.12 TotalEnergies SE
              • TotalEnergies SE - Overview
              • TotalEnergies SE - Business segments
              • TotalEnergies SE - Key news
              • TotalEnergies SE - Key offerings
              • TotalEnergies SE - Segment focus

            12 Appendix

            • 12.1 Scope of the report
              • 12.2 Inclusions and exclusions checklist
                • Inclusions checklist
                • Exclusions checklist
              • 12.3 Currency conversion rates for US$
                • Currency conversion rates for US$
              • 12.4 Research methodology
                • Research methodology
              • 12.5 Data procurement
                • Information sources
              • 12.6 Data validation
                • Data validation
              • 12.7 Validation techniques employed for market sizing
                • Validation techniques employed for market sizing
              • 12.8 Data synthesis
                • Data synthesis
              • 12.9 360 degree market analysis
                • 360 degree market analysis
              • 12.10 List of abbreviations
                • List of abbreviations

              Research Methodology

              Technavio presents a detailed picture of the market by way of study, synthesis, and summation of data from multiple sources. The analysts have presented the various facets of the market with a particular focus on identifying the key industry influencers. The data thus presented is comprehensive, reliable, and the result of extensive research, both primary and secondary.

              INFORMATION SOURCES

              Primary sources

              • Manufacturers and suppliers
              • Channel partners
              • Industry experts
              • Strategic decision makers

              Secondary sources

              • Industry journals and periodicals
              • Government data
              • Financial reports of key industry players
              • Historical data
              • Press releases

              DATA ANALYSIS

              Data Synthesis

              • Collation of data
              • Estimation of key figures
              • Analysis of derived insights

              Data Validation

              • Triangulation with data models
              • Reference against proprietary databases
              • Corroboration with industry experts

              REPORT WRITING

              Qualitative

              • Market drivers
              • Market challenges
              • Market trends
              • Five forces analysis

              Quantitative

              • Market size and forecast
              • Market segmentation
              • Geographical insights
              • Competitive landscape

              Interested in this report?

              Get your sample now to see our research methodology and insights!

              Download Now

              Frequently Asked Questions

              LNG-as-a-Fuel market growth will increase by $ 47.7 bn during 2024-2028.

              The LNG-as-a-Fuel market is expected to grow at a CAGR of 4.5% during 2024-2028.

              LNG-as-a-Fuel market is segmented by End-user( Power generation, Transportation, Others)

              BP Plc, Cheniere Energy Inc., Chevron Corp., Sinopec Shanghai Petrochemical Co. Ltd., Equinor ASA, Exxon Mobil Corp., Freeport LNG Development LP, Gazprom Nedra LLC, Indian Oil Corp. Ltd., INPEX Corp., PAO NOVATEK, PETRONAS Chemicals Group Berhad, Porsche Automobil Holding SE, PT Pertamina Persero, Qatargas Operating Co. Ltd., Shell plc, SK Inc., TotalEnergies SE are a few of the key vendors in the LNG-as-a-Fuel market.

              APAC will register the highest growth rate of 50% among the other regions. Therefore, the LNG-as-a-Fuel market in APAC is expected to garner significant business opportunities for the vendors during the forecast period.

              China, US, Russia, Japan, India

              • Rise in demand for cleaner fuelsOil and coal were the major sources of energy to meet the demand in residential is the driving factor this market.
              • commercial is the driving factor this market.
              • industrial is the driving factor this market.
              • and transportation applications is the driving factor this market.
              • which resulted in a significant increase in the emissions of carbon dioxide (CO2) and other Greenhouse Gas (GHGs). According to the IEA is the driving factor this market.
              • in 2021 is the driving factor this market.
              • global energy-related CO2 emissions increased by 4.8% after witnessing a consecutive year of decline in CO2 emissions globally in 2020. As a result is the driving factor this market.
              • CO2 emissions reached a historic high of 33 billion tons at the end of 2021. Globally is the driving factor this market.
              • various regulations are being enforced by countries to reduce emissions. For instance is the driving factor this market.
              • the Climate Change Act is the driving factor this market.
              • which was introduced in 2008 in the EU is the driving factor this market.
              • aims at reducing carbon emissions. The objective of this act is to reduce GHG emissions by 80% by 2050 over the GHG emissions levels in 1990. Thus is the driving factor this market.
              • the popularity of natural gas is growing as concerns over environmental pollution also increase. Natural gas is regarded as the cleanest fossil fuel compared with the other fossil fuels. It releases the lowest amount of CO2 on combustion is the driving factor this market.
              • thereby having the most negligible environmental impact among fossil fuels. Thus is the driving factor this market.
              • globally is the driving factor this market.
              • the demand for natural gas is increasing to meet the increasing energy demand. Also is the driving factor this market.
              • various vendors are expanding gas pipeline networks. For instance is the driving factor this market.
              • in December 2021 is the driving factor this market.
              • Saudi Aramco signed a $15.5 billion lease and leaseback deal for its gas pipeline network with a consortium led by BlackRock Real Assets and Hassana Investment Company in its second major infrastructure deal year. Thus is the driving factor this market.
              • the expansion of LNG pipelines will positively impact the market in focus during the forecast period. is the driving factor this market.

              The LNG-as-a-Fuel market vendors should focus on grabbing business opportunities from the Power generation segment as it accounted for the largest market share in the base year.