Light Rail Market Analysis, Size, and Forecast 2026-2030: Europe (Germany, UK, and France), APAC (China, India, and Japan), North America (US, Canada, and Mexico), Middle East and Africa (South Africa, UAE, and Saudi Arabia), South America (Brazil and Argentina), and Rest of World (ROW)

Light Rail Market Analysis, Size, and Forecast 2026-2030:
Europe (Germany, UK, and France), APAC (China, India, and Japan), North America (US, Canada, and Mexico), Middle East and Africa (South Africa, UAE, and Saudi Arabia), South America (Brazil and Argentina), and Rest of World (ROW)

Published: Dec 2025 297 Pages SKU: IRTNTR80125

Market Overview at a Glance

$4.10 B
Market Opportunity
4.2%
CAGR 2025 - 2030
53.5%
Europe Growth
$10.11 B
High capacity light rail segment 2024

Light Rail Market Size 2026-2030

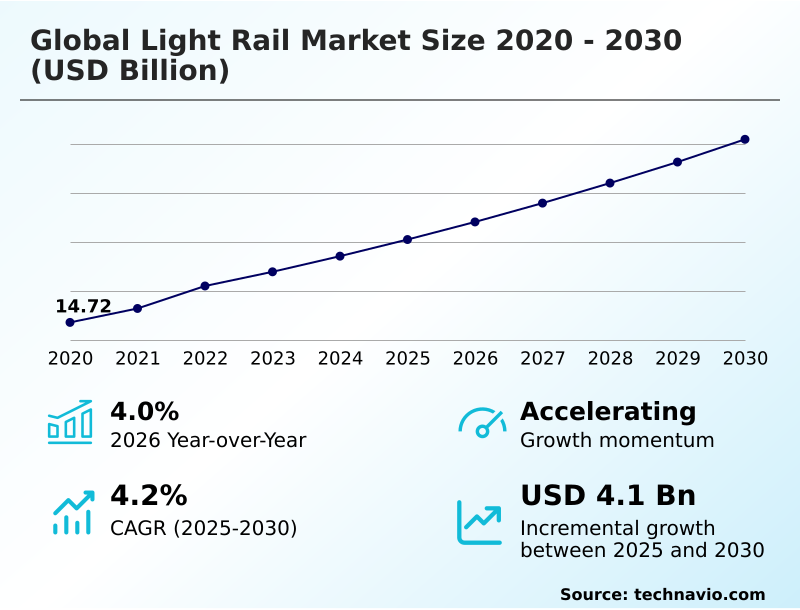
The light rail market size is valued to increase by USD 4.10 billion, at a CAGR of 4.2% from 2025 to 2030. Surging urbanization and imperative for efficient mobility will drive the light rail market.

Major Market Trends & Insights

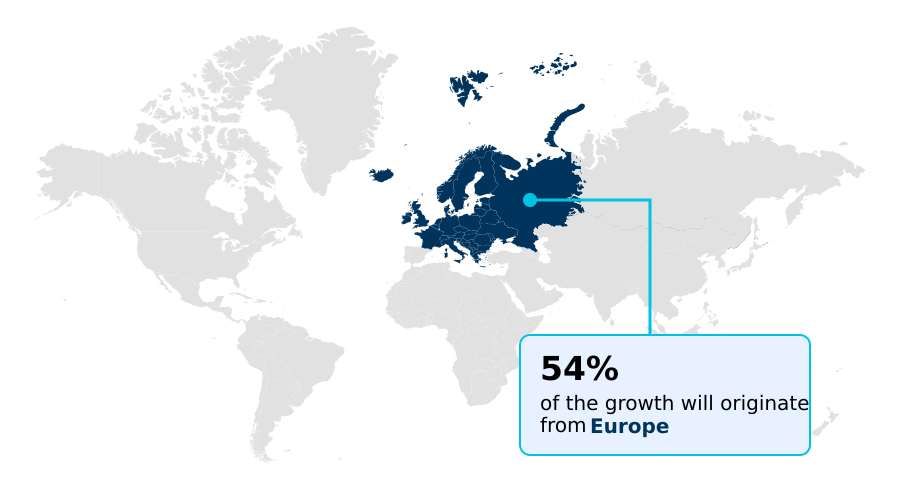
  • Europe dominated the market and accounted for a 53.5% growth during the forecast period.
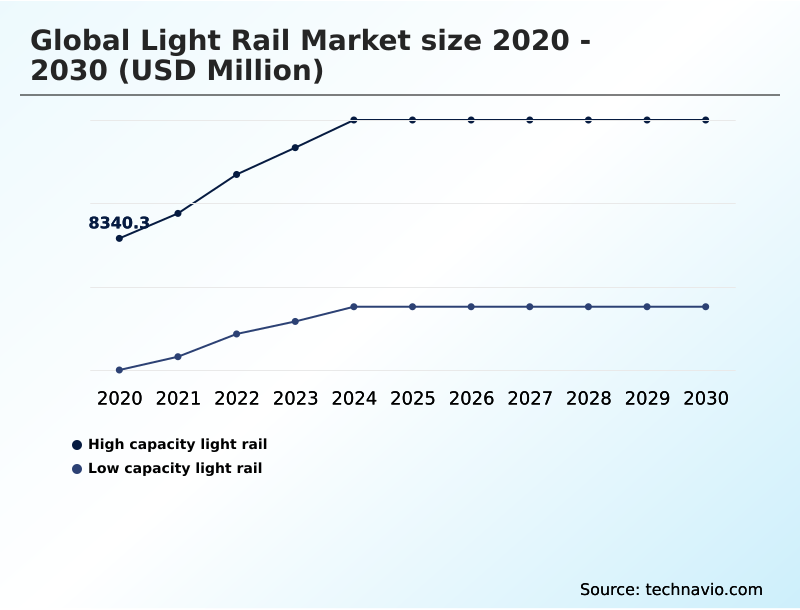
  • By Type - High capacity light rail segment was valued at USD 10.11 billion in 2024
  • By Application - Intra-city transport segment accounted for the largest market revenue share in 2024

Market Size & Forecast

  • Market Opportunities: USD 7.49 billion
  • Market Future Opportunities: USD 4.10 billion
  • CAGR from 2025 to 2030 : 4.2%

Market Summary

  • The light rail market is expanding as a critical component of modern urban infrastructure, driven by global urbanization and the push for sustainable transportation. These systems, defined by electrically powered vehicles operating on fixed rails, offer a high-capacity solution to traffic congestion and carbon emissions.
  • A key trend is the integration of smart technologies; for example, a transit authority might leverage IoT sensors and AI algorithms for predictive maintenance, reducing downtime and operational costs. This shift toward digitalization also enhances the passenger experience through real-time information and seamless fare payment systems.
  • However, the industry faces challenges in securing long-term funding for these capital-intensive projects and ensuring seamless multimodal integration with other transport services. As cities invest in transit-oriented development, light rail is positioned not just as a mode of transport but as a catalyst for economic growth and improved urban livability, requiring a strategic balance between technological innovation and financial sustainability.
  • The development of energy-efficient rolling stock and advanced control systems further solidifies its role in future smart city frameworks.

What will be the Size of the Light Rail Market during the forecast period?

Get Key Insights on Market Forecast (PDF) Request Free Sample

How is the Light Rail Market Segmented?

The light rail industry research report provides comprehensive data (region-wise segment analysis), with forecasts and estimates in "USD million" for the period 2026-2030, as well as historical data from 2020-2024 for the following segments.

  • Type
    • High capacity light rail
    • Low capacity light rail
  • Application
    • Intra-city transport
    • Inter-city transport
  • Product type
    • Passenger transportation
    • Freight transportation
  • Geography
    • Europe
      • Germany
      • UK
      • France
    • APAC
      • China
      • India
      • Japan
    • North America
      • US
      • Canada
      • Mexico
    • Middle East and Africa
      • South Africa
      • UAE
      • Saudi Arabia
    • South America
      • Brazil
      • Argentina
    • Rest of World (ROW)

By Type Insights

The high capacity light rail segment is estimated to witness significant growth during the forecast period.

The high-capacity segment is defined by systems utilizing longer trainsets on dedicated rights-of-way to serve major metropolitan corridors, supporting regional connectivity. These urban rail transit systems are critical for high-capacity public transportation, alleviating traffic and supporting transit-oriented development.

New projects focus on advanced rolling stock with efficient propulsion systems and robust bogie systems to ensure reliability. The expansion of these networks, such as the line extension in Snohomish County, is crucial for connecting suburban commuters to downtown cores.

Modernization efforts, including the introduction of new low-floor light rail trains, improve accessibility and service frequency, with some modernized systems reporting a 15% increase in on-time performance.

Request Free Sample

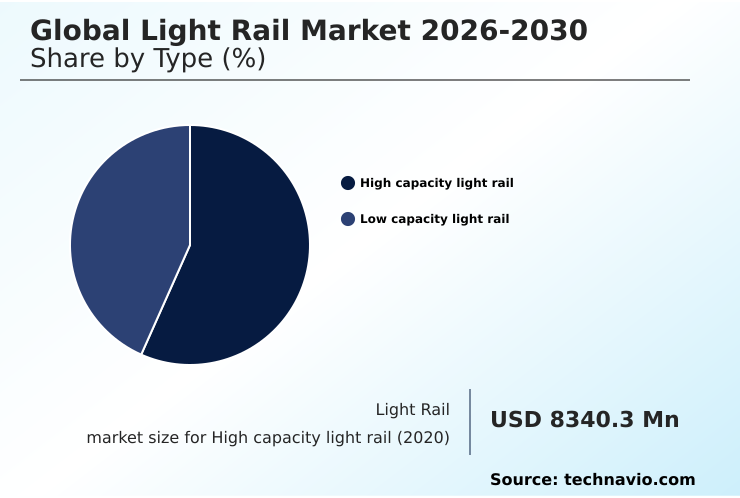
The High capacity light rail segment was valued at USD 10.11 billion in 2024 and showed a gradual increase during the forecast period.

Request Free Sample

Regional Analysis

Europe is estimated to contribute 53.5% to the growth of the global market during the forecast period.Technavio’s analysts have elaborately explained the regional trends and drivers that shape the market during the forecast period.

See How Light Rail Market Demand is Rising in Europe Request Free Sample

Europe leads in market opportunity, contributing over 53% to global growth, driven by strong commitments to eco-friendly transit options and urban renewal. Projects in the region often feature advanced signaling systems and low-floor vehicles for enhanced accessibility.

In contrast, the APAC region is characterized by rapid network expansion to manage urban density, with a focus on high-capacity solutions.

North America demonstrates steady growth through system extensions and modernization, increasingly adopting technologies like communications-based train control (CBTC) to maximize line capacity.

In some North American cities, new extensions have increased system-wide ridership by as much as 10% within the first year of operation, reflecting successful urban development strategies.

Market Dynamics

Our researchers analyzed the data with 2025 as the base year, along with the key drivers, trends, and challenges. A holistic analysis of drivers will help companies refine their marketing strategies to gain a competitive advantage.

  • Strategic decision-making in the light rail sector requires a deep understanding of evolving technologies and operational models. A thorough cost-benefit analysis of light rail modernization is essential before committing to large-scale upgrades. This includes assessing the lifecycle cost assessment of rolling stock and the potential predictive maintenance ROI for light rail operators.
  • A key consideration is the light rail integration with bus rapid transit and integrating light rail with on-demand mobility to create a seamless commuter journey. The impact of digitalization on light rail safety cannot be overstated, with technologies like the role of CBTC in increasing line capacity being a prime example.
  • The debate over hydrogen vs battery-electric light rail performance continues, with both offering pathways for reducing emissions through light rail electrification. Concurrently, operational planning must address catenary-free light rail deployment challenges and the complexities of ERTMS implementation in mixed-traffic environments.
  • Urban planning with transit-oriented development is a powerful catalyst for justifying investment, but its success hinges on improving accessibility with low-floor vehicles and automating ticketing systems for traffic optimization. Examining the energy consumption of modern HVAC systems is another area for efficiency gains. Furthermore, assessing the viability of cargo trams opens new revenue streams.
  • The benefits of automated train operation and the standardization of light rail signaling systems are driving future network designs, often supported by public-private partnership models for light rail financing, which demonstrate up to a 15% faster project delivery timeline compared to traditional public funding approaches.

What are the key market drivers leading to the rise in the adoption of Light Rail Industry?

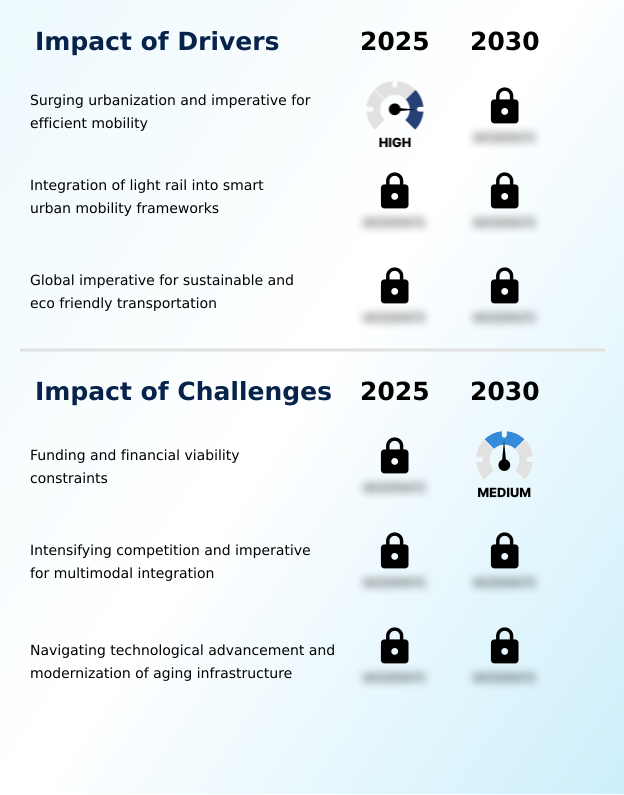
  • Surging urbanization and the corresponding imperative for efficient mobility are primary drivers shaping the market.

  • Surging urbanization is a primary driver, compelling cities to adopt sustainable transportation. Light rail, typically powered by overhead electrical wires via a pantograph, is central to decarbonizing urban transport and achieving zero-emission public transport goals.
  • Investments in smart city integration are accelerating the development of new lines. For instance, innovative tram-train services allow seamless travel between urban and regional networks, expanding service reach. Advanced traction converters improve energy efficiency by more than 10%.
  • As a result, cities are increasingly viewing rail-based transit as a cornerstone of modern urban development, with some regions seeing a 7% year-on-year increase in ridership due to these eco-friendly transit options.

What are the market trends shaping the Light Rail Industry?

  • Accelerated government investment and policy support represents a key market trend. These initiatives focus on fostering sustainable urban mobility on a global scale.

  • A defining trend is the rapid integration of digitalization in rail, which enhances passenger experience enhancement and operational efficiency. The use of AI algorithms for predictive maintenance can reduce system downtime by up to 25%. Concurrently, the focus on green transportation initiatives is driving the adoption of hydrogen-powered light rail and catenary-free systems that rely on onboard energy storage.
  • The development of a hydrogen tram is a key innovation in this space. Furthermore, the deployment of 5G technology enables features like real-time passenger information and advanced control systems, improving service reliability by over 15% while supporting catenary-free solutions.

What challenges does the Light Rail Industry face during its growth?

  • Significant challenges related to securing adequate funding and ensuring long-term financial viability constrain industry growth.

  • The market faces challenges with the financial viability of capital-intensive development, where projects can run over budget by as much as 40%. This necessitates resilient funding models, including public-private partnerships, to ensure project completion. Another challenge is the need for deep multimodal integration to compete with other transport options.
  • Modernization efforts, such as upgrading to a new light rail interlocking system or deploying the European Rail Traffic Management System (ERTMS), are complex and costly. Even successful projects like a new driverless metro system can face initial ridership figures that are 20% below projections, highlighting the difficulty in shifting commuter habits from private vehicles.

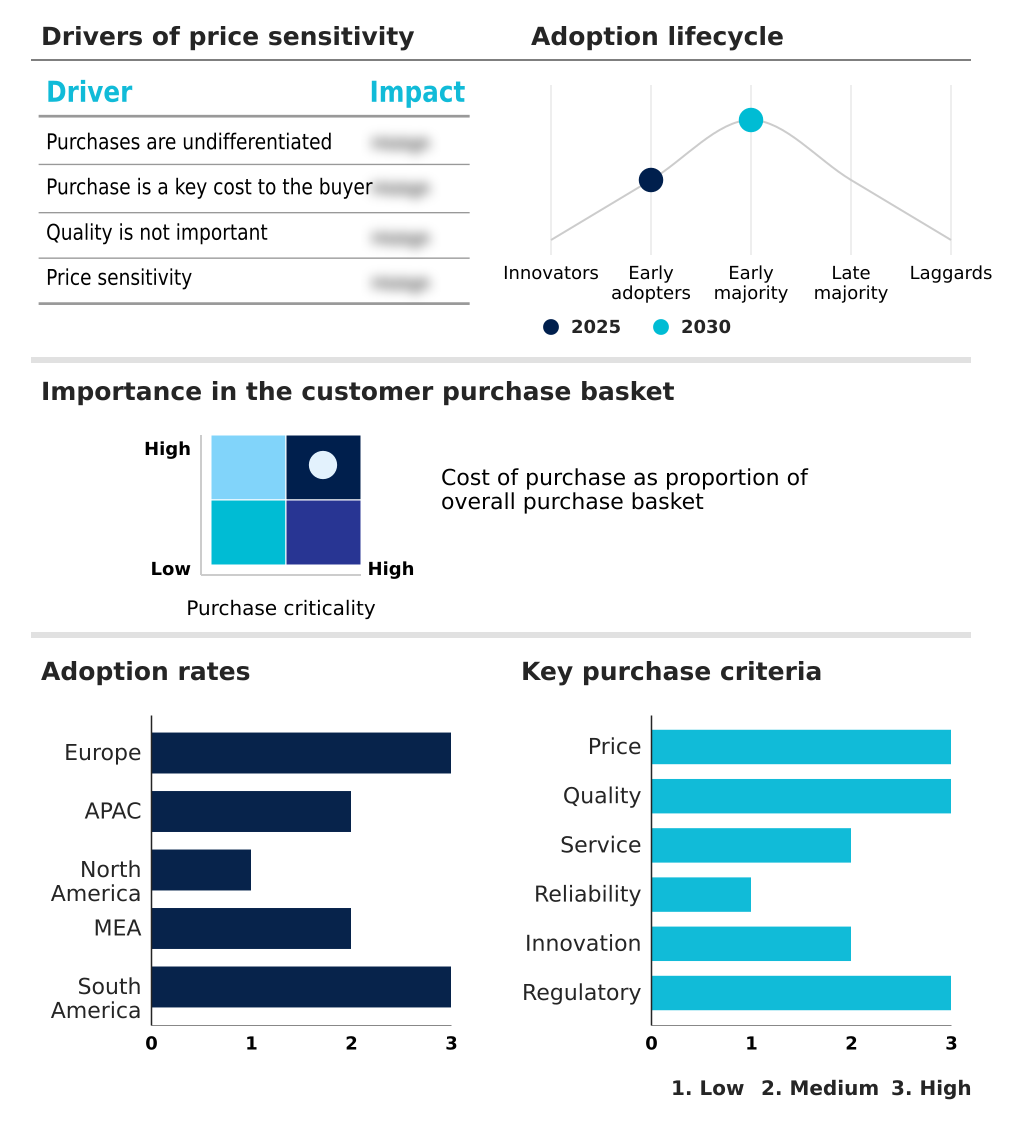
Exclusive Technavio Analysis on Customer Landscape

The light rail market forecasting report includes the adoption lifecycle of the market, covering from the innovator’s stage to the laggard’s stage. It focuses on adoption rates in different regions based on penetration. Furthermore, the light rail market report also includes key purchase criteria and drivers of price sensitivity to help companies evaluate and develop their market growth analysis strategies.

Customer Landscape of Light Rail Industry

Competitive Landscape

Companies are implementing various strategies, such as strategic alliances, light rail market forecast, partnerships, mergers and acquisitions, geographical expansion, and product/service launches, to enhance their presence in the industry.

ABB Ltd. - Key offerings include integrated rolling stock, advanced propulsion and braking systems, and digital signaling solutions designed to enhance operational efficiency and transit network reliability.

The industry research and growth report includes detailed analyses of the competitive landscape of the market and information about key companies, including:

  • ABB Ltd.
  • ALSTOM SA
  • CRRC Corp. Ltd.
  • Hitachi Ltd.
  • Hyundai Motor Group
  • Kawasaki Heavy Industries Ltd.
  • Kintetsu Group Holdings Ltd.
  • Knorr Bremse AG
  • Mitsubishi Heavy Ltd.
  • Motherson Group
  • Mott MacDonald
  • Parsons Corp.
  • Pesa Group
  • Schunk GmbH
  • Siemens AG
  • Stadler Rail Ag
  • SYSTRA SA
  • Thales Group
  • Wabtec Corp.
  • WSP Global Inc.

Qualitative and quantitative analysis of companies has been conducted to help clients understand the wider business environment as well as the strengths and weaknesses of key industry players. Data is qualitatively analyzed to categorize companies as pure play, category-focused, industry-focused, and diversified; it is quantitatively analyzed to categorize companies as dominant, leading, strong, tentative, and weak.

Recent Development and News in Light rail market

  • In November 2024, Light Rail Manila Corp. initiated passenger services on the first phase of the Cavite Extension for Manila Light Rail Transit Line 1, a 6.5-kilometer segment with five new stations.
  • In December 2024, Ho Chi Minh City inaugurated its first metro line, a nearly 20-kilometer system developed as a strategic intervention to mitigate severe traffic congestion and pollution.
  • In September 2024, Siemens Mobility and Ruhrbahn announced a $212 million project to digitalize the light rail interlocking system in Essen and Mulheim an der Ruhr, Germany, upgrading technology from the 1970s.
  • In February 2025, the Hyiptrain project was announced, aiming to develop and commercialize a hydrogen retrofit kit for existing diesel trains to advance the decarbonization of the rail industry.

Dive into Technavio’s robust research methodology, blending expert interviews, extensive data synthesis, and validated models for unparalleled Light Rail Market insights. See full methodology.

Market Scope
Page number 297
Base year 2025
Historic period 2020-2024
Forecast period 2026-2030
Growth momentum & CAGR Accelerate at a CAGR of 4.2%
Market growth 2026-2030 USD 4096.7 million
Market structure Fragmented
YoY growth 2025-2026(%) 4.0%
Key countries Germany, UK, France, Italy, Spain, The Netherlands, China, India, Japan, Australia, South Korea, Indonesia, US, Canada, Mexico, South Africa, UAE, Egypt, Saudi Arabia, Morocco, Brazil, Argentina and Chile
Competitive landscape Leading Companies, Market Positioning of Companies, Competitive Strategies, and Industry Risks

Request Free Sample

Research Analyst Overview

  • The light rail market's evolution is defined by a convergence of infrastructure modernization and technological innovation. Core systems rely on rolling stock powered by overhead electrical wires via a pantograph, with newer catenary-free systems using onboard energy storage gaining traction. The push for accessibility is met with low-floor vehicles and low-floor light rail trains.
  • Operationally, efficiency is enhanced through dedicated rights-of-way and advanced signaling systems, including integrated signaling and communications-based train control (CBTC). A key boardroom decision involves investing in digitalization, leveraging IoT sensors and AI algorithms for predictive maintenance, which can reduce component failures by over 30%. Innovations like the driverless metro system and automated train operation (ATO) are becoming more prevalent.
  • The industry is also adopting green technologies such as the hydrogen tram, part of a move toward hydrogen-powered light rail and battery-powered light rail. Key components like traction converters, propulsion systems, braking systems, door control units, and advanced bogie systems are critical for performance.
  • For broader network integration, projects include the European Train Control System, tram-train services, and the European Rail Traffic Management System (ERTMS). The adoption of 5G technology supports contactless payment systems and sophisticated control systems.
  • Infrastructure projects like a new rail-only bridge, underground parking facilities, and an upgraded light rail interlocking system reflect the market's continuous development, while even HVAC systems are being optimized for energy efficiency. These catenary-free solutions collectively define the next generation of urban transit.

What are the Key Data Covered in this Light Rail Market Research and Growth Report?

  • What is the expected growth of the Light Rail Market between 2026 and 2030?

    • USD 4.10 billion, at a CAGR of 4.2%

  • What segmentation does the market report cover?

    • The report is segmented by Type (High capacity light rail, and Low capacity light rail), Application (Intra-city transport, and Inter-city transport), Product Type (Passenger transportation, and Freight transportation) and Geography (Europe, APAC, North America, Middle East and Africa, South America)

  • Which regions are analyzed in the report?

    • Europe, APAC, North America, Middle East and Africa and South America

  • What are the key growth drivers and market challenges?

    • Surging urbanization and imperative for efficient mobility, Funding and financial viability constraints

  • Who are the major players in the Light Rail Market?

    • ABB Ltd., ALSTOM SA, CRRC Corp. Ltd., Hitachi Ltd., Hyundai Motor Group, Kawasaki Heavy Industries Ltd., Kintetsu Group Holdings Ltd., Knorr Bremse AG, Mitsubishi Heavy Ltd., Motherson Group, Mott MacDonald, Parsons Corp., Pesa Group, Schunk GmbH, Siemens AG, Stadler Rail Ag, SYSTRA SA, Thales Group, Wabtec Corp. and WSP Global Inc.

Market Research Insights

  • The market is evolving through enhanced urban mobility solutions that prioritize sustainable transportation and smart city integration. A focus on transit-oriented development is shaping urban planning, with light rail acting as a backbone for regional connectivity. Strategic multimodal integration with other services is critical for success, with well-integrated systems showing up to 20% higher ridership than standalone lines.
  • The push for decarbonizing urban transport has led to green transportation initiatives that improve energy efficiency by over 15%. This shift is supported by fare simplification initiatives and a focus on passenger experience enhancement. However, ensuring financial viability remains a challenge, often addressed through public-private partnerships and resilient funding models.

We can help! Our analysts can customize this light rail market research report to meet your requirements.

Get in touch

1. Executive Summary

1.1 Market overview

Executive Summary - Chart on Market Overview
Executive Summary - Data Table on Market Overview
Executive Summary - Chart on Global Market Characteristics
Executive Summary - Chart on Market by Geography
Executive Summary - Chart on Market Segmentation by Type
Executive Summary - Chart on Market Segmentation by Application
Executive Summary - Chart on Market Segmentation by Product Type
Executive Summary - Chart on Incremental Growth
Executive Summary - Data Table on Incremental Growth
Executive Summary - Chart on Company Market Positioning

2. Technavio Analysis

2.1 Analysis of price sensitivity, lifecycle, customer purchase basket, adoption rates, and purchase criteria

2.2 Criticality of inputs and Factors of differentiation

Chart on Overview on criticality of inputs and factors of differentiation

2.3 Factors of disruption

Chart on Overview on factors of disruption

2.4 Impact of drivers and challenges

Chart on Impact of drivers and challenges in 2025 and 2030

3. Market Landscape

3.1 Market ecosystem

Chart on Parent Market
Data Table on - Parent Market

3.2 Market characteristics

Chart on Market characteristics analysis

3.3 Value chain analysis

Chart on Value chain analysis

4. Market Sizing

4.1 Market definition

Data Table on Offerings of companies included in the market definition

4.2 Market segment analysis

Market segments

4.3 Market size 2025

4.4 Market outlook: Forecast for 2025-2030

Chart on Global - Market size and forecast 2025-2030 ($ million)
Data Table on Global - Market size and forecast 2025-2030 ($ million)
Chart on Global Market: Year-over-year growth 2025-2030 (%)
Data Table on Global Market: Year-over-year growth 2025-2030 (%)

5. Historic Market Size

5.1 Global Light Rail Market 2020 - 2024

Historic Market Size - Data Table on Global Light Rail Market 2020 - 2024 ($ million)

5.2 Type segment analysis 2020 - 2024

Historic Market Size - Type Segment 2020 - 2024 ($ million)

5.3 Application segment analysis 2020 - 2024

Historic Market Size - Application Segment 2020 - 2024 ($ million)

5.4 Product Type segment analysis 2020 - 2024

Historic Market Size - Product Type Segment 2020 - 2024 ($ million)

5.5 Geography segment analysis 2020 - 2024

Historic Market Size - Geography Segment 2020 - 2024 ($ million)

5.6 Country segment analysis 2020 - 2024

Historic Market Size - Country Segment 2020 - 2024 ($ million)

6. Qualitative Analysis

6.1 Impact of AI on the Global Light Rail Market

7. Five Forces Analysis

7.1 Five forces summary

Five forces analysis - Comparison between 2025 and 2030

7.2 Bargaining power of buyers

Bargaining power of buyers - Impact of key factors 2025 and 2030

7.3 Bargaining power of suppliers

Bargaining power of suppliers - Impact of key factors in 2025 and 2030

7.4 Threat of new entrants

Threat of new entrants - Impact of key factors in 2025 and 2030

7.5 Threat of substitutes

Threat of substitutes - Impact of key factors in 2025 and 2030

7.6 Threat of rivalry

Threat of rivalry - Impact of key factors in 2025 and 2030

7.7 Market condition

Chart on Market condition - Five forces 2025 and 2030

8. Market Segmentation by Type

8.1 Market segments

Chart on Type - Market share 2025-2030 (%)
Data Table on Type - Market share 2025-2030 (%)

8.2 Comparison by Type

Chart on Comparison by Type
Data Table on Comparison by Type

8.3 High capacity light rail - Market size and forecast 2025-2030

Chart on High capacity light rail - Market size and forecast 2025-2030 ($ million)
Data Table on High capacity light rail - Market size and forecast 2025-2030 ($ million)
Chart on High capacity light rail - Year-over-year growth 2025-2030 (%)
Data Table on High capacity light rail - Year-over-year growth 2025-2030 (%)

8.4 Low capacity light rail - Market size and forecast 2025-2030

Chart on Low capacity light rail - Market size and forecast 2025-2030 ($ million)
Data Table on Low capacity light rail - Market size and forecast 2025-2030 ($ million)
Chart on Low capacity light rail - Year-over-year growth 2025-2030 (%)
Data Table on Low capacity light rail - Year-over-year growth 2025-2030 (%)

8.5 Market opportunity by Type

Market opportunity by Type ($ million)
Data Table on Market opportunity by Type ($ million)

9. Market Segmentation by Application

9.1 Market segments

Chart on Application - Market share 2025-2030 (%)
Data Table on Application - Market share 2025-2030 (%)

9.2 Comparison by Application

Chart on Comparison by Application
Data Table on Comparison by Application

9.3 Intra-city transport - Market size and forecast 2025-2030

Chart on Intra-city transport - Market size and forecast 2025-2030 ($ million)
Data Table on Intra-city transport - Market size and forecast 2025-2030 ($ million)
Chart on Intra-city transport - Year-over-year growth 2025-2030 (%)
Data Table on Intra-city transport - Year-over-year growth 2025-2030 (%)

9.4 Inter-city transport - Market size and forecast 2025-2030

Chart on Inter-city transport - Market size and forecast 2025-2030 ($ million)
Data Table on Inter-city transport - Market size and forecast 2025-2030 ($ million)
Chart on Inter-city transport - Year-over-year growth 2025-2030 (%)
Data Table on Inter-city transport - Year-over-year growth 2025-2030 (%)

9.5 Market opportunity by Application

Market opportunity by Application ($ million)
Data Table on Market opportunity by Application ($ million)

10. Market Segmentation by Product Type

10.1 Market segments

Chart on Product Type - Market share 2025-2030 (%)
Data Table on Product Type - Market share 2025-2030 (%)

10.2 Comparison by Product Type

Chart on Comparison by Product Type
Data Table on Comparison by Product Type

10.3 Passenger transportation - Market size and forecast 2025-2030

Chart on Passenger transportation - Market size and forecast 2025-2030 ($ million)
Data Table on Passenger transportation - Market size and forecast 2025-2030 ($ million)
Chart on Passenger transportation - Year-over-year growth 2025-2030 (%)
Data Table on Passenger transportation - Year-over-year growth 2025-2030 (%)

10.4 Freight transportation - Market size and forecast 2025-2030

Chart on Freight transportation - Market size and forecast 2025-2030 ($ million)
Data Table on Freight transportation - Market size and forecast 2025-2030 ($ million)
Chart on Freight transportation - Year-over-year growth 2025-2030 (%)
Data Table on Freight transportation - Year-over-year growth 2025-2030 (%)

10.5 Market opportunity by Product Type

Market opportunity by Product Type ($ million)
Data Table on Market opportunity by Product Type ($ million)

11. Customer Landscape

11.1 Customer landscape overview

Analysis of price sensitivity, lifecycle, customer purchase basket, adoption rates, and purchase criteria

12. Geographic Landscape

12.1 Geographic segmentation

Chart on Market share by geography 2025-2030 (%)
Data Table on Market share by geography 2025-2030 (%)

12.2 Geographic comparison

Chart on Geographic comparison
Data Table on Geographic comparison

12.3 Europe - Market size and forecast 2025-2030

Chart on Europe - Market size and forecast 2025-2030 ($ million)
Data Table on Europe - Market size and forecast 2025-2030 ($ million)
Chart on Europe - Year-over-year growth 2025-2030 (%)
Data Table on Europe - Year-over-year growth 2025-2030 (%)
Chart on Regional Comparison - Europe
Data Table on Regional Comparison - Europe

12.3.1 Germany - Market size and forecast 2025-2030

Chart on Germany - Market size and forecast 2025-2030 ($ million)
Data Table on Germany - Market size and forecast 2025-2030 ($ million)
Chart on Germany - Year-over-year growth 2025-2030 (%)
Data Table on Germany - Year-over-year growth 2025-2030 (%)

12.3.2 UK - Market size and forecast 2025-2030

Chart on UK - Market size and forecast 2025-2030 ($ million)
Data Table on UK - Market size and forecast 2025-2030 ($ million)
Chart on UK - Year-over-year growth 2025-2030 (%)
Data Table on UK - Year-over-year growth 2025-2030 (%)

12.3.3 France - Market size and forecast 2025-2030

Chart on France - Market size and forecast 2025-2030 ($ million)
Data Table on France - Market size and forecast 2025-2030 ($ million)
Chart on France - Year-over-year growth 2025-2030 (%)
Data Table on France - Year-over-year growth 2025-2030 (%)

12.3.4 Italy - Market size and forecast 2025-2030

Chart on Italy - Market size and forecast 2025-2030 ($ million)
Data Table on Italy - Market size and forecast 2025-2030 ($ million)
Chart on Italy - Year-over-year growth 2025-2030 (%)
Data Table on Italy - Year-over-year growth 2025-2030 (%)

12.3.5 Spain - Market size and forecast 2025-2030

Chart on Spain - Market size and forecast 2025-2030 ($ million)
Data Table on Spain - Market size and forecast 2025-2030 ($ million)
Chart on Spain - Year-over-year growth 2025-2030 (%)
Data Table on Spain - Year-over-year growth 2025-2030 (%)

12.3.6 The Netherlands - Market size and forecast 2025-2030

Chart on The Netherlands - Market size and forecast 2025-2030 ($ million)
Data Table on The Netherlands - Market size and forecast 2025-2030 ($ million)
Chart on The Netherlands - Year-over-year growth 2025-2030 (%)
Data Table on The Netherlands - Year-over-year growth 2025-2030 (%)

12.4 APAC - Market size and forecast 2025-2030

Chart on APAC - Market size and forecast 2025-2030 ($ million)
Data Table on APAC - Market size and forecast 2025-2030 ($ million)
Chart on APAC - Year-over-year growth 2025-2030 (%)
Data Table on APAC - Year-over-year growth 2025-2030 (%)
Chart on Regional Comparison - APAC
Data Table on Regional Comparison - APAC

12.4.1 China - Market size and forecast 2025-2030

Chart on China - Market size and forecast 2025-2030 ($ million)
Data Table on China - Market size and forecast 2025-2030 ($ million)
Chart on China - Year-over-year growth 2025-2030 (%)
Data Table on China - Year-over-year growth 2025-2030 (%)

12.4.2 India - Market size and forecast 2025-2030

Chart on India - Market size and forecast 2025-2030 ($ million)
Data Table on India - Market size and forecast 2025-2030 ($ million)
Chart on India - Year-over-year growth 2025-2030 (%)
Data Table on India - Year-over-year growth 2025-2030 (%)

12.4.3 Japan - Market size and forecast 2025-2030

Chart on Japan - Market size and forecast 2025-2030 ($ million)
Data Table on Japan - Market size and forecast 2025-2030 ($ million)
Chart on Japan - Year-over-year growth 2025-2030 (%)
Data Table on Japan - Year-over-year growth 2025-2030 (%)

12.4.4 Australia - Market size and forecast 2025-2030

Chart on Australia - Market size and forecast 2025-2030 ($ million)
Data Table on Australia - Market size and forecast 2025-2030 ($ million)
Chart on Australia - Year-over-year growth 2025-2030 (%)
Data Table on Australia - Year-over-year growth 2025-2030 (%)

12.4.5 South Korea - Market size and forecast 2025-2030

Chart on South Korea - Market size and forecast 2025-2030 ($ million)
Data Table on South Korea - Market size and forecast 2025-2030 ($ million)
Chart on South Korea - Year-over-year growth 2025-2030 (%)
Data Table on South Korea - Year-over-year growth 2025-2030 (%)

12.4.6 Indonesia - Market size and forecast 2025-2030

Chart on Indonesia - Market size and forecast 2025-2030 ($ million)
Data Table on Indonesia - Market size and forecast 2025-2030 ($ million)
Chart on Indonesia - Year-over-year growth 2025-2030 (%)
Data Table on Indonesia - Year-over-year growth 2025-2030 (%)

12.5 North America - Market size and forecast 2025-2030

Chart on North America - Market size and forecast 2025-2030 ($ million)
Data Table on North America - Market size and forecast 2025-2030 ($ million)
Chart on North America - Year-over-year growth 2025-2030 (%)
Data Table on North America - Year-over-year growth 2025-2030 (%)
Chart on Regional Comparison - North America
Data Table on Regional Comparison - North America

12.5.1 US - Market size and forecast 2025-2030

Chart on US - Market size and forecast 2025-2030 ($ million)
Data Table on US - Market size and forecast 2025-2030 ($ million)
Chart on US - Year-over-year growth 2025-2030 (%)
Data Table on US - Year-over-year growth 2025-2030 (%)

12.5.2 Canada - Market size and forecast 2025-2030

Chart on Canada - Market size and forecast 2025-2030 ($ million)
Data Table on Canada - Market size and forecast 2025-2030 ($ million)
Chart on Canada - Year-over-year growth 2025-2030 (%)
Data Table on Canada - Year-over-year growth 2025-2030 (%)

12.5.3 Mexico - Market size and forecast 2025-2030

Chart on Mexico - Market size and forecast 2025-2030 ($ million)
Data Table on Mexico - Market size and forecast 2025-2030 ($ million)
Chart on Mexico - Year-over-year growth 2025-2030 (%)
Data Table on Mexico - Year-over-year growth 2025-2030 (%)

12.6 Middle East and Africa - Market size and forecast 2025-2030

Chart on Middle East and Africa - Market size and forecast 2025-2030 ($ million)
Data Table on Middle East and Africa - Market size and forecast 2025-2030 ($ million)
Chart on Middle East and Africa - Year-over-year growth 2025-2030 (%)
Data Table on Middle East and Africa - Year-over-year growth 2025-2030 (%)
Chart on Regional Comparison - Middle East and Africa
Data Table on Regional Comparison - Middle East and Africa

12.6.1 South Africa - Market size and forecast 2025-2030

Chart on South Africa - Market size and forecast 2025-2030 ($ million)
Data Table on South Africa - Market size and forecast 2025-2030 ($ million)
Chart on South Africa - Year-over-year growth 2025-2030 (%)
Data Table on South Africa - Year-over-year growth 2025-2030 (%)

12.6.2 UAE - Market size and forecast 2025-2030

Chart on UAE - Market size and forecast 2025-2030 ($ million)
Data Table on UAE - Market size and forecast 2025-2030 ($ million)
Chart on UAE - Year-over-year growth 2025-2030 (%)
Data Table on UAE - Year-over-year growth 2025-2030 (%)

12.6.3 Egypt - Market size and forecast 2025-2030

Chart on Egypt - Market size and forecast 2025-2030 ($ million)
Data Table on Egypt - Market size and forecast 2025-2030 ($ million)
Chart on Egypt - Year-over-year growth 2025-2030 (%)
Data Table on Egypt - Year-over-year growth 2025-2030 (%)

12.6.4 Saudi Arabia - Market size and forecast 2025-2030

Chart on Saudi Arabia - Market size and forecast 2025-2030 ($ million)
Data Table on Saudi Arabia - Market size and forecast 2025-2030 ($ million)
Chart on Saudi Arabia - Year-over-year growth 2025-2030 (%)
Data Table on Saudi Arabia - Year-over-year growth 2025-2030 (%)

12.6.5 Morocco - Market size and forecast 2025-2030

Chart on Morocco - Market size and forecast 2025-2030 ($ million)
Data Table on Morocco - Market size and forecast 2025-2030 ($ million)
Chart on Morocco - Year-over-year growth 2025-2030 (%)
Data Table on Morocco - Year-over-year growth 2025-2030 (%)

12.7 South America - Market size and forecast 2025-2030

Chart on South America - Market size and forecast 2025-2030 ($ million)
Data Table on South America - Market size and forecast 2025-2030 ($ million)
Chart on South America - Year-over-year growth 2025-2030 (%)
Data Table on South America - Year-over-year growth 2025-2030 (%)
Chart on Regional Comparison - South America
Data Table on Regional Comparison - South America

12.7.1 Brazil - Market size and forecast 2025-2030

Chart on Brazil - Market size and forecast 2025-2030 ($ million)
Data Table on Brazil - Market size and forecast 2025-2030 ($ million)
Chart on Brazil - Year-over-year growth 2025-2030 (%)
Data Table on Brazil - Year-over-year growth 2025-2030 (%)

12.7.2 Argentina - Market size and forecast 2025-2030

Chart on Argentina - Market size and forecast 2025-2030 ($ million)
Data Table on Argentina - Market size and forecast 2025-2030 ($ million)
Chart on Argentina - Year-over-year growth 2025-2030 (%)
Data Table on Argentina - Year-over-year growth 2025-2030 (%)

12.7.3 Chile - Market size and forecast 2025-2030

Chart on Chile - Market size and forecast 2025-2030 ($ million)
Data Table on Chile - Market size and forecast 2025-2030 ($ million)
Chart on Chile - Year-over-year growth 2025-2030 (%)
Data Table on Chile - Year-over-year growth 2025-2030 (%)

12.8 Market opportunity by geography

Market opportunity by geography ($ million)
Data Tables on Market opportunity by geography ($ million)

13. Drivers, Challenges, and Opportunity

13.1 Market drivers

Surging urbanization and imperative for efficient mobility
Integration of light rail into smart urban mobility frameworks
Global imperative for sustainable and eco friendly transportation

13.2 Market challenges

Funding and financial viability constraints
Intensifying competition and imperative for multimodal integration
Navigating technological advancement and modernization of aging infrastructure

13.3 Impact of drivers and challenges

Impact of drivers and challenges in 2025 and 2030

13.4 Market opportunities

Accelerated government investment and policy support for sustainable urban mobility
Rapid integration of digitalization and artificial intelligence
Focus on green technologies and energy efficiency

14. Competitive Landscape

14.1 Overview

14.2

Overview on criticality of inputs and factors of differentiation

14.3 Landscape disruption

Overview on factors of disruption

14.4 Industry risks

Impact of key risks on business

15. Competitive Analysis

15.1 Companies profiled

Companies covered

15.2 Company ranking index

15.3 Market positioning of companies

Matrix on companies position and classification

15.4 ABB Ltd.

ABB Ltd. - Overview
ABB Ltd. - Business segments
ABB Ltd. - Key news
ABB Ltd. - Key offerings
ABB Ltd. - Segment focus
SWOT

15.5 ALSTOM SA

ALSTOM SA - Overview
ALSTOM SA - Business segments
ALSTOM SA - Key offerings
ALSTOM SA - Segment focus
SWOT

15.6 CRRC Corp. Ltd.

CRRC Corp. Ltd. - Overview
CRRC Corp. Ltd. - Product / Service
CRRC Corp. Ltd. - Key offerings
SWOT

15.7 Hitachi Ltd.

Hitachi Ltd. - Overview
Hitachi Ltd. - Business segments
Hitachi Ltd. - Key news
Hitachi Ltd. - Key offerings
Hitachi Ltd. - Segment focus
SWOT

15.8 Hyundai Motor Group

Hyundai Motor Group - Overview
Hyundai Motor Group - Business segments
Hyundai Motor Group - Key news
Hyundai Motor Group - Key offerings
Hyundai Motor Group - Segment focus
SWOT

15.9 Kawasaki Heavy Industries Ltd.

Kawasaki Heavy Industries Ltd. - Overview
Kawasaki Heavy Industries Ltd. - Business segments
Kawasaki Heavy Industries Ltd. - Key news
Kawasaki Heavy Industries Ltd. - Key offerings
Kawasaki Heavy Industries Ltd. - Segment focus
SWOT

15.10 Knorr Bremse AG

Knorr Bremse AG - Overview
Knorr Bremse AG - Business segments
Knorr Bremse AG - Key offerings
Knorr Bremse AG - Segment focus
SWOT

15.11 Mitsubishi Heavy Ltd.

Mitsubishi Heavy Ltd. - Overview
Mitsubishi Heavy Ltd. - Business segments
Mitsubishi Heavy Ltd. - Key news
Mitsubishi Heavy Ltd. - Key offerings
Mitsubishi Heavy Ltd. - Segment focus
SWOT

15.12 Mott MacDonald

Mott MacDonald - Overview
Mott MacDonald - Product / Service
Mott MacDonald - Key offerings
SWOT

15.13 Pesa Group

Pesa Group - Overview
Pesa Group - Product / Service
Pesa Group - Key offerings
SWOT

15.14 Siemens AG

Siemens AG - Overview
Siemens AG - Business segments
Siemens AG - Key news
Siemens AG - Key offerings
Siemens AG - Segment focus
SWOT

15.15 Stadler Rail Ag

Stadler Rail Ag - Overview
Stadler Rail Ag - Business segments
Stadler Rail Ag - Key offerings
Stadler Rail Ag - Segment focus
SWOT

15.16 Thales Group

Thales Group - Overview
Thales Group - Business segments
Thales Group - Key news
Thales Group - Key offerings
Thales Group - Segment focus
SWOT

15.17 Wabtec Corp.

Wabtec Corp. - Overview
Wabtec Corp. - Business segments
Wabtec Corp. - Key offerings
Wabtec Corp. - Segment focus
SWOT

15.18 WSP Global Inc.

WSP Global Inc. - Overview
WSP Global Inc. - Business segments
WSP Global Inc. - Key offerings
WSP Global Inc. - Segment focus
SWOT

16. Appendix

16.1 Scope of the report

Market definition
Objectives
Notes and caveats

16.2 Inclusions and exclusions checklist

Inclusions checklist
Exclusions checklist

16.3 Currency conversion rates for US$

16.4 Research methodology

16.5 Data procurement

Information sources

16.6 Data validation

16.7 Validation techniques employed for market sizing

16.8 Data synthesis

16.9 360 degree market analysis

16.10 List of abbreviations

Research Methodology

Technavio presents a detailed picture of the market by way of study, synthesis, and summation of data from multiple sources. The analysts have presented the various facets of the market with a particular focus on identifying the key industry influencers. The data thus presented is comprehensive, reliable, and the result of extensive research, both primary and secondary.

INFORMATION SOURCES

Primary sources

  • Manufacturers and suppliers
  • Channel partners
  • Industry experts
  • Strategic decision makers

Secondary sources

  • Industry journals and periodicals
  • Government data
  • Financial reports of key industry players
  • Historical data
  • Press releases

DATA ANALYSIS

Data Synthesis

  • Collation of data
  • Estimation of key figures
  • Analysis of derived insights

Data Validation

  • Triangulation with data models
  • Reference against proprietary databases
  • Corroboration with industry experts

REPORT WRITING

Qualitative

  • Market drivers
  • Market challenges
  • Market trends
  • Five forces analysis

Quantitative

  • Market size and forecast
  • Market segmentation
  • Geographical insights
  • Competitive landscape

Interested in this report?

Get your sample now to see our research methodology and insights!

Download Now

Frequently Asked Questions

Light Rail market growth will increase by USD 4096.7 million during 2026-2030.

The Light Rail market is expected to grow at a CAGR of 4.2% during 2026-2030.

Light Rail market is segmented by Type (High capacity light rail, Low capacity light rail) Application (Intra-city transport, Inter-city transport) Product type (Passenger transportation, Freight transportation)

ABB Ltd., ALSTOM SA, CRRC Corp. Ltd., Hitachi Ltd., Hyundai Motor Group, Kawasaki Heavy Industries Ltd., Kintetsu Group Holdings Ltd., Knorr Bremse AG, Mitsubishi Heavy Ltd., Motherson Group, Mott MacDonald, Parsons Corp., Pesa Group, Schunk GmbH, Siemens AG, Stadler Rail Ag, SYSTRA SA, Thales Group, Wabtec Corp., WSP Global Inc. are a few of the key vendors in the Light Rail market.

Europe will register the highest growth rate of 53.5% among the other regions. Therefore, the Light Rail market in Europe is expected to garner significant business opportunities for the vendors during the forecast period.

Germany, UK, France, Italy, Spain, The Netherlands, China, India, Japan, Australia, South Korea, Indonesia, US, Canada, Mexico, South Africa, UAE, Egypt, Saudi Arabia, Morocco, Brazil, Argentina, Chile

  • Surging urbanization and imperative for efficient mobility is the driving factor this market.

The Light Rail market vendors should focus on grabbing business opportunities from the Type segment as it accounted for the largest market share in the base year.