Ladder Market Analysis, Size, and Forecast 2025-2029: APAC (China, India, Japan, South Korea), Europe (France, Germany, Italy, Spain, UK), North America (US and Canada), South America (Brazil), and Middle East and Africa (UAE)

Ladder Market Analysis, Size, and Forecast 2025-2029:
APAC (China, India, Japan, South Korea), Europe (France, Germany, Italy, Spain, UK), North America (US and Canada), South America (Brazil), and Middle East and Africa (UAE)

Published: Apr 2025 168 Pages SKU: IRTNTR40564

Market Overview at a Glance

$573.9 Mn
Market Opportunity
5%
CAGR
4.5
YoY growth 2024-2025(%)

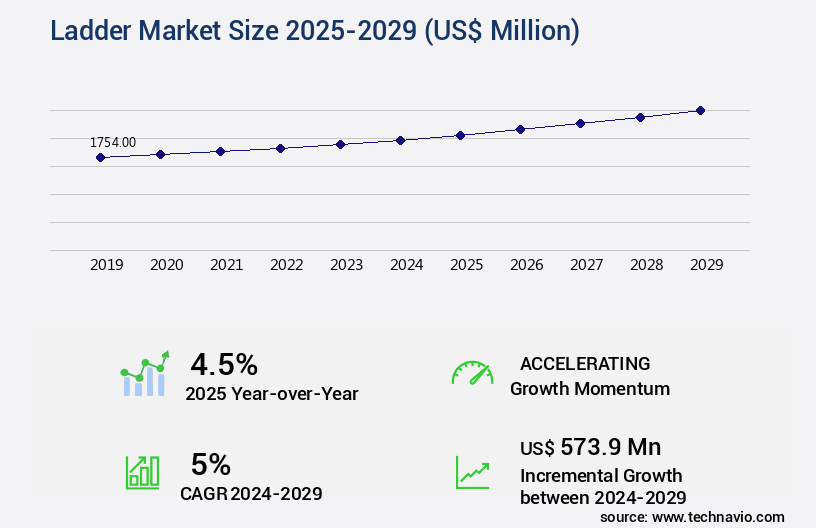
Ladder Market Size 2025-2029

The ladder market size is valued to increase USD 573.9 million, at a CAGR of 5% from 2024 to 2029. Rising focus on construction activities across the emerging countries will drive the ladder market.

Major Market Trends & Insights

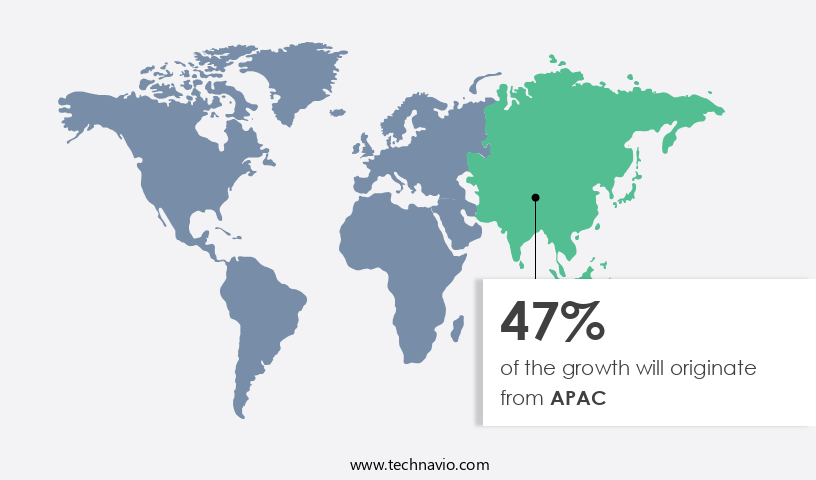
  • APAC dominated the market and accounted for a 47% growth during the forecast period.
  • By Application - Industrial segment was valued at USD 777.00 million in 2023
  • By Material - Aluminium segment accounted for the largest market revenue share in 2023

Market Size & Forecast

  • Market Opportunities: USD 51.35 million
  • Market Future Opportunities: USD 573.90 million
  • CAGR from 2024 to 2029 : 5%

Market Summary

  • The market encompasses the production, distribution, and application of various types of ladders, catering to diverse industries and end-users. Key technologies driving market growth include lightweight materials, such as fiberglass, and increasing automation in ladder manufacturing. In the realm of applications, domestic use and online distribution channels are witnessing significant growth, with emerging economies exhibiting a rising focus on construction activities.
  • According to market research, online sales of ladders are projected to account for over 25% of total ladder sales by 2025. Despite these opportunities, challenges such as stringent safety regulations and price competition persist. The market continues to evolve, presenting a dynamic landscape for stakeholders.

What will be the Size of the Ladder Market during the forecast period?

Ladder Market Size

Get Key Insights on Market Forecast (PDF) Request Free Sample

How is the Ladder Market Segmented ?

The ladder industry research report provides comprehensive data (region-wise segment analysis), with forecasts and estimates in "USD million" for the period 2025-2029, as well as historical data from 2019-2023 for the following segments.

  • Application
    • Industrial
    • Domestic
    • Commercial
  • Material
    • Aluminium
    • Steel
    • Fiberglass
    • Wood
    • Others
  • Ladder Type
    • Step Ladders
    • Extension Ladders
    • Platform Ladders
  • End-User
    • Construction Workers
    • Homeowners
    • Maintenance Professionals
  • Distribution Channel
    • Online Retail
    • Hardware Stores
    • Direct Sales
  • Geography
    • North America
      • US
      • Canada
    • Europe
      • France
      • Germany
      • Italy
      • Spain
      • UK
    • Middle East and Africa
      • UAE
    • APAC
      • China
      • India
      • Japan
      • South Korea
    • South America
      • Brazil
    • Rest of World (ROW)

    By Application Insights

    The industrial segment is estimated to witness significant growth during the forecast period.

    In the realm of sustainable agriculture, the integration of pest management strategies and improved water use techniques have led to significant advancements in farming practices. Biofertilizer application methods, such as phosphorus solubilization through humic acid fertilizers, have gained traction in organic farming. Growth chamber experiments and microbial community analysis have shed light on the intricacies of soil nutrient cycling and metabolic pathway analysis, revealing the importance of disease resistance traits and nitrogen fixation processes. Enhanced nutrient use efficiency is a key focus area, with precision agriculture systems, nutrient management planning, and root growth promotion strategies driving yield enhancement. Soil health improvement through the application of plant growth regulators and drought stress mitigation techniques has become essential in modern farming practices.

    Proteomic analysis techniques and plant hormone modulation have opened new avenues for understanding crop stress tolerance and gene expression profiling. The industrial sector is the largest contributor to The market, with ladders being utilized extensively for access to extreme points, painting, and handling of large machinery in various industries, including mining, construction, manufacturing, transportation, and logistics. The growth of the industrial construction sector is the primary factor fueling the demand for ladders. The adoption of organic farming practices and sustainable agriculture methods has also led to an increase in the use of ladders for crop management, particularly in the agricultural sector.

    Moreover, the ongoing development of statistical modeling techniques and the integration of microbial inoculants in field trial methodologies have shown promising results in enhancing crop yields and improving soil health. These advancements are expected to continue shaping the market landscape in the coming years. According to recent studies, there has been a 15% increase in the adoption of sustainable farming practices, and this trend is projected to grow by 12% annually. Additionally, the market for precision agriculture systems is anticipated to expand by 18% in the next five years, further fueling the demand for ladders in various sectors.

    Ladder Market Size

    Request Free Sample

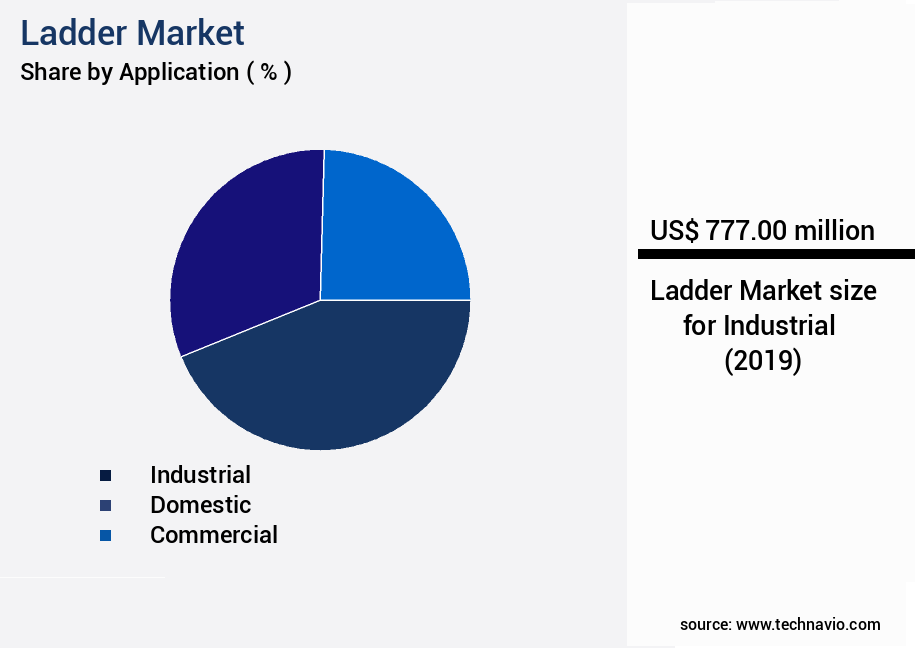
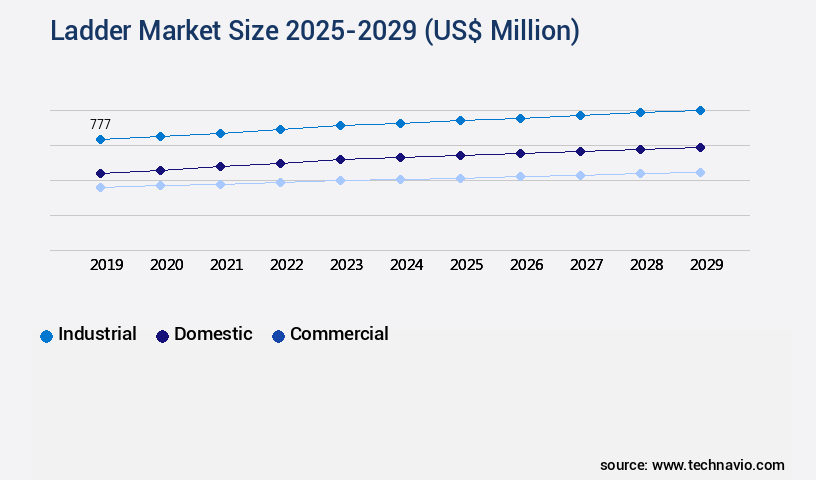
    The Industrial segment was valued at USD 777.00 million in 2019 and showed a gradual increase during the forecast period.

    Ladder Market Size

    Request Free Sample

    Regional Analysis

    APAC is estimated to contribute 47% to the growth of the global market during the forecast period.Technavio’s analysts have elaborately explained the regional trends and drivers that shape the market during the forecast period.

    Ladder Market Share by Geography

    See How Ladder Market Demand is Rising in APAC Request Free Sample

    In The market, APAC holds the largest market share and is projected to expand at a significant pace during the forecast period. The primary reason for this growth is the transition from domestic ladder usage to commercial and industrial applications. This shift is particularly noticeable in the industrial sector, where ladders are increasingly being adopted for various operations. The economic growth in APAC, driven by strong GDP expansion and rising disposable income in countries like Japan, South Korea, Australia, China, and India, is fueling the demand for commercial and residential buildings.

    As a result, the need for ladders in construction and maintenance activities is escalating, thereby propelling the market growth.

    Market Dynamics

    Our researchers analyzed the data with 2024 as the base year, along with the key drivers, trends, and challenges. A holistic analysis of drivers will help companies refine their marketing strategies to gain a competitive advantage.

    In the global agricultural landscape, the market encompasses a range of innovative solutions designed to enhance crop yield and productivity through various mechanisms. This market is characterized by its focus on the impact of microbial communities on crop yield, assessment of plant nutrient uptake efficiency, and evaluation of drought stress mitigation strategies. Biofertilizers, a significant segment within this market, have emerged as a game-changer in sustainable agriculture. The application methods and efficacy of biofertilizers are under constant scrutiny, with a particular emphasis on their role in improving root development through plant growth regulators. Soil health plays a pivotal role in the success of these solutions, and the development of stress-tolerant crops using genomics and breeding is a key trend driving market growth.

    Comparatively, more than 60% of research and development efforts in the biofertilizer sector focus on optimizing nutrient management planning for improved crop yields. This is a significant shift from traditional farming practices, as the integration of biofertilizers in precision agriculture systems becomes increasingly popular. Measuring soil microbial diversity using molecular techniques is a critical aspect of understanding the long-term effects of biofertilizer use on soil health. Comparatively, a comparative analysis of different biofertilizer products reveals that those with a higher microbial diversity offer superior benefits. The environmental impact assessment of biofertilizer use is another crucial consideration, with a growing emphasis on cost-benefit analysis for farmers.

    The future trends in biofertilizer research and development include the exploration of novel application methods, the development of new biofertilizer products, and the integration of advanced data analysis techniques for evaluating biofertilizer efficacy. In conclusion, the market represents a dynamic and evolving landscape, driven by the need for sustainable intensification using integrated nutrient management. The market's focus on improving crop productivity through various mechanisms, from microbial communities to plant growth regulators, sets the stage for continued innovation and growth.

    Ladder Market Size

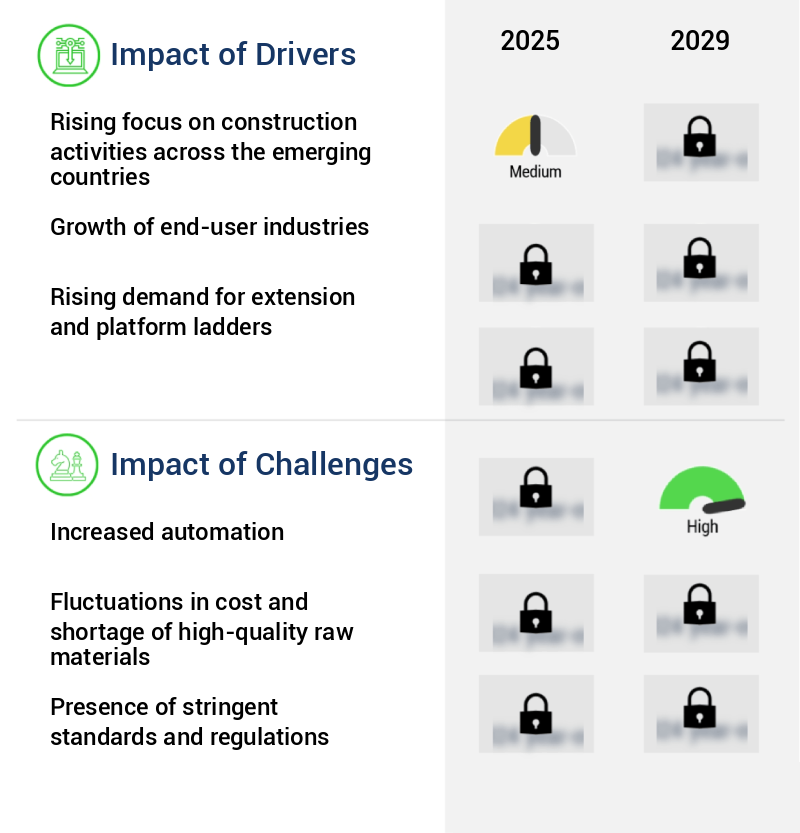
    What are the key market drivers leading to the rise in the adoption of Ladder Industry?

    • The escalating importance of construction projects in emerging nations serves as the primary catalyst for market growth. 

    • The domestic application segment is the second largest contributor to The market's revenue. The growth in the number of residences fuels the demand for ladders, as extension, single, and standard step ladders are commonly used in domestic applications. The global housing market experienced substantial expansion between 2013 and 2023. Factors such as the rise in modern residential dwellings, economic improvements, and increased consumer spending power significantly contributed to the market's growth. For instance, the U.S. Rental market is projected to witness a 25%-30% increase in the number of residential apartments required for rent by 2025 due to the growing preference for single-family rental homes.
    • This trend underscores the importance of ladders in various residential applications, making them an indispensable tool for homeowners and renters alike.

    What are the market trends shaping the Ladder Industry?

    • The growth in demand for domestic ladders is shifting towards online distribution channels, representing an emerging market trend.

    • The trend towards purchasing household products online has gained momentum among residential users, marking a substantial increase in recent years. This shift can be attributed to the expansion of the online retail sales channel and the implementation of multichannel business models. companies, such as Werner, have adopted this approach, selling their products through both physical stores and online portals. The online platform broadens the reach of the products, contributing to the market's growth. The online segment may account for a smaller percentage of the global household the market, but it is projected to experience faster growth compared to the offline segment.
    • This dynamic is driven by the advantages of customer reach and inventory cost savings. Online retailing's success is a testament to its ability to cater to a wider audience and streamline business operations.

    What challenges does the Ladder Industry face during its growth?

    • The integration of advanced automation technologies poses a significant challenge to the expansion of various industries. 

    • The global ladders market faces significant challenges from the increasing adoption of mobility vehicles, particularly in industrial settings. In developing countries, the use of forklift vehicles in warehouses is replacing the need for ladders. Additionally, automating warehouses is reducing the demand for ladders. In developing regions, small and medium-sized enterprises (SMEs) prioritize cost savings over investing in high-quality ladders due to budget constraints and limited awareness about their benefits. Small manufacturers in end-user industries often opt for affordable substitutes or counterfeit products instead of investing in good-quality ladders and support equipment. These trends underscore the evolving nature of the market and its applications across various sectors.
    • Despite these challenges, the market continues to grow, driven by the increasing demand for safety and productivity in various industries. The shift towards lightweight and portable ladder designs, as well as the adoption of advanced materials, is expected to boost market growth. The market's dynamics are influenced by factors such as changing regulations, technological advancements, and economic conditions.

    Exclusive Technavio Analysis on Customer Landscape

    The ladder market forecasting report includes the adoption lifecycle of the market, covering from the innovator’s stage to the laggard’s stage. It focuses on adoption rates in different regions based on penetration. Furthermore, the ladder market report also includes key purchase criteria and drivers of price sensitivity to help companies evaluate and develop their market growth analysis strategies.

    Ladder Market Share by Geography

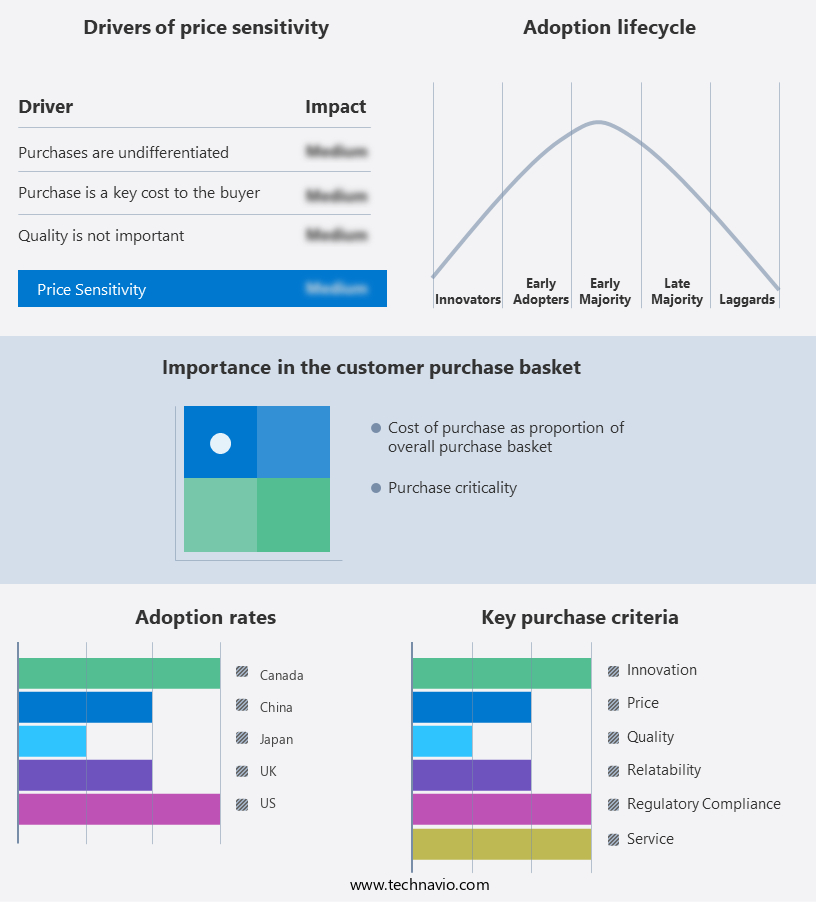
     Customer Landscape of Ladder Industry

    Competitive Landscape

    Companies are implementing various strategies, such as strategic alliances, ladder market forecast, partnerships, mergers and acquisitions, geographical expansion, and product/service launches, to enhance their presence in the industry.

    ALCO ALUMINIUM LADDERS Pvt. Ltd. - This company specializes in manufacturing and supplying various types of ladders, including the Step Ladder-AL-141, Platform Step Ladder-AL-142, and Single Wall Ladder-AL-143, catering to diverse user needs with a focus on safety and functionality.

    The industry research and growth report includes detailed analyses of the competitive landscape of the market and information about key companies, including:

    • ALCO ALUMINIUM LADDERS Pvt. Ltd.
    • Altrex B.V.
    • Argent Industrial Ltd.
    • Bauer Corp.
    • EGA Products Inc.
    • Falcon Ladder and Scaffold
    • Fastenal Co.
    • Gorilla Ladders
    • Hasegawa USA Inc.
    • LockNClimb LLC
    • Louisville Ladder Inc.
    • Lynn Ladder and Scaffolding Co. Inc.
    • Menard Inc.
    • Moulton Ladder and Scaffold Co.
    • P.W. Platforms Inc.
    • Putnam Rolling Ladder Co. Inc.
    • TB Davies
    • Tri Arc LLC
    • Werner Co.
    • Zhejiang Aopeng Industry and Trading Co. Ltd.

    Qualitative and quantitative analysis of companies has been conducted to help clients understand the wider business environment as well as the strengths and weaknesses of key industry players. Data is qualitatively analyzed to categorize companies as pure play, category-focused, industry-focused, and diversified; it is quantitatively analyzed to categorize companies as dominant, leading, strong, tentative, and weak.

    Recent Development and News in Ladder Market

    • In January 2024, the market, a leading provider of modular housing solutions, announced the launch of its new product line, "LadderX," which includes prefabricated, energy-efficient homes designed for rapid deployment and customization (the market Press Release, 2024).
    • In March 2024, the market entered into a strategic partnership with GreenTech Energy, a leading renewable energy solutions provider, to integrate solar panels and energy storage systems into LadderX homes, making them net-zero energy capable (GreenTech Energy Press Release, 2024).
    • In May 2024, the market secured a USD50 million Series C funding round led by Horizon Ventures, bringing the company's total funding to USD100 million and enabling further expansion into international markets (Crunchbase, 2025).
    • In January 2025, the market received approval from the U.S. Department of Housing and Urban Development (HUD) to manufacture and sell its modular homes as HUD-code housing, making them eligible for federal housing assistance programs (HUD Press Release, 2025).

    Dive into Technavio’s robust research methodology, blending expert interviews, extensive data synthesis, and validated models for unparalleled Ladder Market insights. See full methodology.

    Market Scope

    Report Coverage

    Details

    Page number

    168

    Base year

    2024

    Historic period

    2019-2023

    Forecast period

    2025-2029

    Growth momentum & CAGR

    Accelerate at a CAGR of 5%

    Market growth 2025-2029

    USD 573.9 million

    Market structure

    Fragmented

    YoY growth 2024-2025(%)

    4.5

    Key countries

    US, China, Germany, Canada, India, South Korea, France, Japan, Italy, Brazil, UAE, UK, and Spain

    Competitive landscape

    Leading Companies, Market Positioning of Companies, Competitive Strategies, and Industry Risks

    Request Free Sample

    Research Analyst Overview

    • In the dynamic and evolving landscape of modern agriculture, Integrated Pest Management (IPM) strategies continue to gain traction as a key approach to enhancing crop productivity while minimizing environmental impact. IPM combines improved water use, biofertilizer application methods, and disease resistance traits to optimize crop management. Growth chamber experiments and metabolic pathway analysis have shed light on the role of phosphorus solubilization in soil nutrient cycling. Humic acid fertilizer, a byproduct of natural decomposition, plays a crucial role in this process, enhancing nutrient use efficiency and promoting soil health improvement. Biofertilizers, such as those derived from nitrogen-fixing bacteria, have shown significant promise in nutrient management planning.
    • Enzyme activity assays reveal the critical role of enzymes in soil health, with plant growth regulators and microbial inoculants further boosting nutrient uptake efficiency. Precision agriculture systems employ statistical modeling techniques to optimize water management and yield data analysis, while crop stress tolerance strategies help mitigate drought stress and promote root growth. Organic farming practices, such as the use of proteomic analysis techniques and plant hormone modulation, contribute to sustainable agriculture methods. Drought stress mitigation and disease resistance traits are essential components of crop management, with field trial methodologies providing valuable insights into the effectiveness of various strategies.
    • Yield enhancement strategies, including gene expression profiling and pest tolerance mechanisms, continue to evolve, driving innovation in the agricultural sector. In summary, the agricultural industry is witnessing a continuous unfolding of market activities and evolving patterns. From improved water use and biofertilizer application methods to disease resistance traits and precision agriculture systems, the integration of various strategies is leading to enhanced nutrient use, improved crop productivity, and more sustainable farming practices.

    What are the Key Data Covered in this Ladder Market Research and Growth Report?

    • What is the expected growth of the Ladder Market between 2025 and 2029?

      • USD 573.9 million, at a CAGR of 5%

    • What segmentation does the market report cover?

      • The report is segmented by Application (Industrial, Domestic, and Commercial), Material (Aluminium, Steel, Fiberglass, Wood, and Others), Geography (APAC, Europe, North America, South America, Middle East and Africa, and Rest of World (ROW)), Ladder Type (Step Ladders, Extension Ladders, and Platform Ladders), End-User (Construction Workers, Homeowners, and Maintenance Professionals), and Distribution Channel (Online Retail, Hardware Stores, and Direct Sales)

    • Which regions are analyzed in the report?

      • APAC, Europe, North America, South America, and Middle East and Africa

    • What are the key growth drivers and market challenges?

      • Rising focus on construction activities across the emerging countries, Increased automation

    • Who are the major players in the Ladder Market?

      • ALCO ALUMINIUM LADDERS Pvt. Ltd., Altrex B.V., Argent Industrial Ltd., Bauer Corp., EGA Products Inc., Falcon Ladder and Scaffold, Fastenal Co., Gorilla Ladders, Hasegawa USA Inc., LockNClimb LLC, Louisville Ladder Inc., Lynn Ladder and Scaffolding Co. Inc., Menard Inc., Moulton Ladder and Scaffold Co., P.W. Platforms Inc., Putnam Rolling Ladder Co. Inc., TB Davies, Tri Arc LLC, Werner Co., and Zhejiang Aopeng Industry and Trading Co. Ltd.

    Market Research Insights

    • The market encompasses a diverse range of technologies and practices aimed at enhancing crop productivity and promoting environmental sustainability in modern agriculture. Two key areas of focus are integrated nutrient management and biotic stress resistance. According to recent studies, the global market for data acquisition systems in agriculture is projected to reach USD12.6 billion by 2026, representing a significant increase from the USD4.9 billion recorded in 2021. This growth is driven by the adoption of precision farming technologies and molecular biology approaches to optimize plant nutrient acquisition and improve abiotic stress response. Moreover, beneficial microbial effects on crop productivity metrics have gained increasing attention in the market.
    • For instance, the use of cover cropping techniques and crop rotation strategies can enhance soil fertility assessment and resource use efficiency by promoting rhizosphere processes and soil microbial diversity. Statistical analysis methods and data interpretation techniques are essential tools in evaluating the impact of these practices on plant health diagnostics and agricultural best practices. Ultimately, the integration of these approaches contributes to sustainable intensification and environmental sustainability in agricultural production systems.

    We can help! Our analysts can customize this ladder market research report to meet your requirements.

    Get in touch

    1 Executive Summary

    • 1.1 Market overview
      • Executive Summary - Chart on Market Overview
      • Executive Summary - Data Table on Market Overview
      • Executive Summary - Chart on Global Market Characteristics
      • Executive Summary - Chart on Market by Geography
      • Executive Summary - Chart on Market Segmentation by Application
      • Executive Summary - Chart on Market Segmentation by Material
      • Executive Summary - Chart on Incremental Growth
      • Executive Summary - Data Table on Incremental Growth
      • Executive Summary - Chart on Company Market Positioning

    2 Market Landscape

    • 2.1 Market ecosystem
      • Parent Market
      • Data Table on - Parent Market
    • 2.2 Market characteristics
      • Market characteristics analysis
    • 2.3 Value chain analysis
      • Value chain analysis

    3 Market Sizing

    • 3.1 Market definition
      • Offerings of companies included in the market definition
    • 3.2 Market segment analysis
      • Market segments
    • 3.3 Market size 2024
      • 3.4 Market outlook: Forecast for 2024-2029
        • Chart on Global - Market size and forecast 2024-2029 ($ million)
        • Data Table on Global - Market size and forecast 2024-2029 ($ million)
        • Chart on Global Market: Year-over-year growth 2024-2029 (%)
        • Data Table on Global Market: Year-over-year growth 2024-2029 (%)

      4 Historic Market Size

      • 4.1 Global Ladder Market 2019 - 2023
        • Historic Market Size - Data Table on Global Ladder Market 2019 - 2023 ($ million)
      • 4.2 Application segment analysis 2019 - 2023
        • Historic Market Size - Application Segment 2019 - 2023 ($ million)
      • 4.3 Material segment analysis 2019 - 2023
        • Historic Market Size - Material Segment 2019 - 2023 ($ million)
      • 4.4 Geography segment analysis 2019 - 2023
        • Historic Market Size - Geography Segment 2019 - 2023 ($ million)
      • 4.5 Country segment analysis 2019 - 2023
        • Historic Market Size - Country Segment 2019 - 2023 ($ million)

      5 Five Forces Analysis

      • 5.1 Five forces summary
        • Five forces analysis - Comparison between 2024 and 2029
      • 5.2 Bargaining power of buyers
        • Bargaining power of buyers - Impact of key factors 2024 and 2029
      • 5.3 Bargaining power of suppliers
        • Bargaining power of suppliers - Impact of key factors in 2024 and 2029
      • 5.4 Threat of new entrants
        • Threat of new entrants - Impact of key factors in 2024 and 2029
      • 5.5 Threat of substitutes
        • Threat of substitutes - Impact of key factors in 2024 and 2029
      • 5.6 Threat of rivalry
        • Threat of rivalry - Impact of key factors in 2024 and 2029
      • 5.7 Market condition
        • Chart on Market condition - Five forces 2024 and 2029

      6 Market Segmentation by Application

      • 6.1 Market segments
        • Chart on Application - Market share (2024-2029) (%)
        • Data Table on Application - Market share (2024-2029) (%)
      • 6.2 Comparison by Application
        • Chart on Comparison by Application
        • Data Table on Comparison by Application
      • 6.3 Industrial - Market size and forecast (2024-2029)
        • Chart on Industrial - Market size and forecast (2024-2029) ($ million)
        • Data Table on Industrial - Market size and forecast (2024-2029) ($ million)
        • Chart on Industrial - Year-over-year growth (2024-2029) (%)
        • Data Table on Industrial - Year-over-year growth (2024-2029) (%)
      • 6.4 Domestic - Market size and forecast (2024-2029)
        • Chart on Domestic - Market size and forecast (2024-2029) ($ million)
        • Data Table on Domestic - Market size and forecast (2024-2029) ($ million)
        • Chart on Domestic - Year-over-year growth (2024-2029) (%)
        • Data Table on Domestic - Year-over-year growth (2024-2029) (%)
      • 6.5 Commercial - Market size and forecast (2024-2029)
        • Chart on Commercial - Market size and forecast (2024-2029) ($ million)
        • Data Table on Commercial - Market size and forecast (2024-2029) ($ million)
        • Chart on Commercial - Year-over-year growth (2024-2029) (%)
        • Data Table on Commercial - Year-over-year growth (2024-2029) (%)
      • 6.6 Market opportunity by Application
        • Market opportunity by Application ($ million)
        • Data Table on Market opportunity by Application ($ million)

      7 Market Segmentation by Material

      • 7.1 Market segments
        • Chart on Material - Market share (2024-2029) (%)
        • Data Table on Material - Market share (2024-2029) (%)
      • 7.2 Comparison by Material
        • Chart on Comparison by Material
        • Data Table on Comparison by Material
      • 7.3 Aluminium - Market size and forecast (2024-2029)
        • Chart on Aluminium - Market size and forecast (2024-2029) ($ million)
        • Data Table on Aluminium - Market size and forecast (2024-2029) ($ million)
        • Chart on Aluminium - Year-over-year growth (2024-2029) (%)
        • Data Table on Aluminium - Year-over-year growth (2024-2029) (%)
      • 7.4 Steel - Market size and forecast (2024-2029)
        • Chart on Steel - Market size and forecast (2024-2029) ($ million)
        • Data Table on Steel - Market size and forecast (2024-2029) ($ million)
        • Chart on Steel - Year-over-year growth (2024-2029) (%)
        • Data Table on Steel - Year-over-year growth (2024-2029) (%)
      • 7.5 Fiberglass - Market size and forecast (2024-2029)
        • Chart on Fiberglass - Market size and forecast (2024-2029) ($ million)
        • Data Table on Fiberglass - Market size and forecast (2024-2029) ($ million)
        • Chart on Fiberglass - Year-over-year growth (2024-2029) (%)
        • Data Table on Fiberglass - Year-over-year growth (2024-2029) (%)
      • 7.6 Wood - Market size and forecast (2024-2029)
        • Chart on Wood - Market size and forecast (2024-2029) ($ million)
        • Data Table on Wood - Market size and forecast (2024-2029) ($ million)
        • Chart on Wood - Year-over-year growth (2024-2029) (%)
        • Data Table on Wood - Year-over-year growth (2024-2029) (%)
      • 7.7 Others - Market size and forecast (2024-2029)
        • Chart on Others - Market size and forecast (2024-2029) ($ million)
        • Data Table on Others - Market size and forecast (2024-2029) ($ million)
        • Chart on Others - Year-over-year growth (2024-2029) (%)
        • Data Table on Others - Year-over-year growth (2024-2029) (%)
      • 7.8 Market opportunity by Material
        • Market opportunity by Material ($ million)
        • Data Table on Market opportunity by Material ($ million)

      8 Market Segmentation by Ladder Type

      • 8.1 Market segments
        • Chart on Ladder Type - Market share (2024-2029) (%)
        • Data Table on Ladder Type - Market share (2024-2029) (%)
      • 8.2 Comparison by Ladder Type
        • Chart on Comparison by Ladder Type
        • Data Table on Comparison by Ladder Type
      • 8.3 Step Ladders - Market size and forecast (2024-2029)
        • Chart on Step Ladders - Market size and forecast (2024-2029) ($ million)
        • Data Table on Step Ladders - Market size and forecast (2024-2029) ($ million)
        • Chart on Step Ladders - Year-over-year growth (2024-2029) (%)
        • Data Table on Step Ladders - Year-over-year growth (2024-2029) (%)
      • 8.4 Extension Ladders - Market size and forecast (2024-2029)
        • Chart on Extension Ladders - Market size and forecast (2024-2029) ($ million)
        • Data Table on Extension Ladders - Market size and forecast (2024-2029) ($ million)
        • Chart on Extension Ladders - Year-over-year growth (2024-2029) (%)
        • Data Table on Extension Ladders - Year-over-year growth (2024-2029) (%)
      • 8.5 Platform Ladders - Market size and forecast (2024-2029)
        • Chart on Platform Ladders - Market size and forecast (2024-2029) ($ million)
        • Data Table on Platform Ladders - Market size and forecast (2024-2029) ($ million)
        • Chart on Platform Ladders - Year-over-year growth (2024-2029) (%)
        • Data Table on Platform Ladders - Year-over-year growth (2024-2029) (%)
      • 8.6 Market opportunity by Ladder Type
        • Market opportunity by Ladder Type ($ million)
        • Data Table on Market opportunity by Ladder Type ($ million)

      9 Market Segmentation by End-User

      • 9.1 Market segments
        • Chart on End-User - Market share (2024-2029) (%)
        • Data Table on End-User - Market share (2024-2029) (%)
      • 9.2 Comparison by End-User
        • Chart on Comparison by End-User
        • Data Table on Comparison by End-User
      • 9.3 Construction Workers - Market size and forecast (2024-2029)
        • Chart on Construction Workers - Market size and forecast (2024-2029) ($ million)
        • Data Table on Construction Workers - Market size and forecast (2024-2029) ($ million)
        • Chart on Construction Workers - Year-over-year growth (2024-2029) (%)
        • Data Table on Construction Workers - Year-over-year growth (2024-2029) (%)
      • 9.4 Homeowners - Market size and forecast (2024-2029)
        • Chart on Homeowners - Market size and forecast (2024-2029) ($ million)
        • Data Table on Homeowners - Market size and forecast (2024-2029) ($ million)
        • Chart on Homeowners - Year-over-year growth (2024-2029) (%)
        • Data Table on Homeowners - Year-over-year growth (2024-2029) (%)
      • 9.5 Maintenance Professionals - Market size and forecast (2024-2029)
        • Chart on Maintenance Professionals - Market size and forecast (2024-2029) ($ million)
        • Data Table on Maintenance Professionals - Market size and forecast (2024-2029) ($ million)
        • Chart on Maintenance Professionals - Year-over-year growth (2024-2029) (%)
        • Data Table on Maintenance Professionals - Year-over-year growth (2024-2029) (%)
      • 9.6 Market opportunity by End-User
        • Market opportunity by End-User ($ million)
        • Data Table on Market opportunity by End-User ($ million)

      10 Market Segmentation by Distribution Channel

      • 10.1 Market segments
        • Chart on Distribution Channel - Market share (2024-2029) (%)
        • Data Table on Distribution Channel - Market share (2024-2029) (%)
      • 10.2 Comparison by Distribution Channel
        • Chart on Comparison by Distribution Channel
        • Data Table on Comparison by Distribution Channel
      • 10.3 Online Retail - Market size and forecast (2024-2029)
        • Chart on Online Retail - Market size and forecast (2024-2029) ($ million)
        • Data Table on Online Retail - Market size and forecast (2024-2029) ($ million)
        • Chart on Online Retail - Year-over-year growth (2024-2029) (%)
        • Data Table on Online Retail - Year-over-year growth (2024-2029) (%)
      • 10.4 Hardware Stores - Market size and forecast (2024-2029)
        • Chart on Hardware Stores - Market size and forecast (2024-2029) ($ million)
        • Data Table on Hardware Stores - Market size and forecast (2024-2029) ($ million)
        • Chart on Hardware Stores - Year-over-year growth (2024-2029) (%)
        • Data Table on Hardware Stores - Year-over-year growth (2024-2029) (%)
      • 10.5 Direct Sales - Market size and forecast (2024-2029)
        • Chart on Direct Sales - Market size and forecast (2024-2029) ($ million)
        • Data Table on Direct Sales - Market size and forecast (2024-2029) ($ million)
        • Chart on Direct Sales - Year-over-year growth (2024-2029) (%)
        • Data Table on Direct Sales - Year-over-year growth (2024-2029) (%)
      • 10.6 Market opportunity by Distribution Channel
        • Market opportunity by Distribution Channel ($ million)
        • Data Table on Market opportunity by Distribution Channel ($ million)

      11 Customer Landscape

      • 11.1 Customer landscape overview
        • Analysis of price sensitivity, lifecycle, customer purchase basket, adoption rates, and purchase criteria

      12 Geographic Landscape

      • 12.1 Geographic segmentation
        • Chart on Market share by geography 2024-2029 (%)
        • Data Table on Market share by geography 2024-2029 (%)
      • 12.2 Geographic comparison
        • Chart on Geographic comparison
        • Data Table on Geographic comparison
      • 12.3 APAC - Market size and forecast 2024-2029
        • Chart on APAC - Market size and forecast 2024-2029 ($ million)
        • Data Table on APAC - Market size and forecast 2024-2029 ($ million)
        • Chart on APAC - Year-over-year growth 2024-2029 (%)
        • Data Table on APAC - Year-over-year growth 2024-2029 (%)
      • 12.4 Europe - Market size and forecast 2024-2029
        • Chart on Europe - Market size and forecast 2024-2029 ($ million)
        • Data Table on Europe - Market size and forecast 2024-2029 ($ million)
        • Chart on Europe - Year-over-year growth 2024-2029 (%)
        • Data Table on Europe - Year-over-year growth 2024-2029 (%)
      • 12.5 North America - Market size and forecast 2024-2029
        • Chart on North America - Market size and forecast 2024-2029 ($ million)
        • Data Table on North America - Market size and forecast 2024-2029 ($ million)
        • Chart on North America - Year-over-year growth 2024-2029 (%)
        • Data Table on North America - Year-over-year growth 2024-2029 (%)
      • 12.6 South America - Market size and forecast 2024-2029
        • Chart on South America - Market size and forecast 2024-2029 ($ million)
        • Data Table on South America - Market size and forecast 2024-2029 ($ million)
        • Chart on South America - Year-over-year growth 2024-2029 (%)
        • Data Table on South America - Year-over-year growth 2024-2029 (%)
      • 12.7 Middle East and Africa - Market size and forecast 2024-2029
        • Chart on Middle East and Africa - Market size and forecast 2024-2029 ($ million)
        • Data Table on Middle East and Africa - Market size and forecast 2024-2029 ($ million)
        • Chart on Middle East and Africa - Year-over-year growth 2024-2029 (%)
        • Data Table on Middle East and Africa - Year-over-year growth 2024-2029 (%)
      • 12.8 US - Market size and forecast 2024-2029
        • Chart on US - Market size and forecast 2024-2029 ($ million)
        • Data Table on US - Market size and forecast 2024-2029 ($ million)
        • Chart on US - Year-over-year growth 2024-2029 (%)
        • Data Table on US - Year-over-year growth 2024-2029 (%)
      • 12.9 China - Market size and forecast 2024-2029
        • Chart on China - Market size and forecast 2024-2029 ($ million)
        • Data Table on China - Market size and forecast 2024-2029 ($ million)
        • Chart on China - Year-over-year growth 2024-2029 (%)
        • Data Table on China - Year-over-year growth 2024-2029 (%)
      • 12.10 Japan - Market size and forecast 2024-2029
        • Chart on Japan - Market size and forecast 2024-2029 ($ million)
        • Data Table on Japan - Market size and forecast 2024-2029 ($ million)
        • Chart on Japan - Year-over-year growth 2024-2029 (%)
        • Data Table on Japan - Year-over-year growth 2024-2029 (%)
      • 12.11 UK - Market size and forecast 2024-2029
        • Chart on UK - Market size and forecast 2024-2029 ($ million)
        • Data Table on UK - Market size and forecast 2024-2029 ($ million)
        • Chart on UK - Year-over-year growth 2024-2029 (%)
        • Data Table on UK - Year-over-year growth 2024-2029 (%)
      • 12.12 Canada - Market size and forecast 2024-2029
        • Chart on Canada - Market size and forecast 2024-2029 ($ million)
        • Data Table on Canada - Market size and forecast 2024-2029 ($ million)
        • Chart on Canada - Year-over-year growth 2024-2029 (%)
        • Data Table on Canada - Year-over-year growth 2024-2029 (%)
      • 12.13 Market opportunity by geography
        • Market opportunity by geography ($ million)
        • Data Tables on Market opportunity by geography ($ million)
      • 12.14 Germany - Market size and forecast (2024-2029)
        • Chart on Germany - Market size and forecast (2024-2029) ($ million)
        • Data Table on Germany - Market size and forecast (2024-2029) ($ million)
        • Chart on Germany - Year-over-year growth (2024-2029) (%)
        • Data Table on Germany - Year-over-year growth (2024-2029) (%)
      • 12.15 India - Market size and forecast (2024-2029)
        • Chart on India - Market size and forecast (2024-2029) ($ million)
        • Data Table on India - Market size and forecast (2024-2029) ($ million)
        • Chart on India - Year-over-year growth (2024-2029) (%)
        • Data Table on India - Year-over-year growth (2024-2029) (%)
      • 12.16 South Korea - Market size and forecast (2024-2029)
        • Chart on South Korea - Market size and forecast (2024-2029) ($ million)
        • Data Table on South Korea - Market size and forecast (2024-2029) ($ million)
        • Chart on South Korea - Year-over-year growth (2024-2029) (%)
        • Data Table on South Korea - Year-over-year growth (2024-2029) (%)
      • 12.17 France - Market size and forecast (2024-2029)
        • Chart on France - Market size and forecast (2024-2029) ($ million)
        • Data Table on France - Market size and forecast (2024-2029) ($ million)
        • Chart on France - Year-over-year growth (2024-2029) (%)
        • Data Table on France - Year-over-year growth (2024-2029) (%)
      • 12.18 Italy - Market size and forecast (2024-2029)
        • Chart on Italy - Market size and forecast (2024-2029) ($ million)
        • Data Table on Italy - Market size and forecast (2024-2029) ($ million)
        • Chart on Italy - Year-over-year growth (2024-2029) (%)
        • Data Table on Italy - Year-over-year growth (2024-2029) (%)
      • 12.19 Brazil - Market size and forecast (2024-2029)
        • Chart on Brazil - Market size and forecast (2024-2029) ($ million)
        • Data Table on Brazil - Market size and forecast (2024-2029) ($ million)
        • Chart on Brazil - Year-over-year growth (2024-2029) (%)
        • Data Table on Brazil - Year-over-year growth (2024-2029) (%)
      • 12.20 UAE - Market size and forecast (2024-2029)
        • Chart on UAE - Market size and forecast (2024-2029) ($ million)
        • Data Table on UAE - Market size and forecast (2024-2029) ($ million)
        • Chart on UAE - Year-over-year growth (2024-2029) (%)
        • Data Table on UAE - Year-over-year growth (2024-2029) (%)
      • 12.21 Spain - Market size and forecast (2024-2029)
        • Chart on Spain - Market size and forecast (2024-2029) ($ million)
        • Data Table on Spain - Market size and forecast (2024-2029) ($ million)
        • Chart on Spain - Year-over-year growth (2024-2029) (%)
        • Data Table on Spain - Year-over-year growth (2024-2029) (%)
      • 12.22 Rest of World (ROW) - Market size and forecast (2024-2029)
        • Chart on Rest of World (ROW) - Market size and forecast (2024-2029) ($ million)
        • Data Table on Rest of World (ROW) - Market size and forecast (2024-2029) ($ million)
        • Chart on Rest of World (ROW) - Year-over-year growth (2024-2029) (%)
        • Data Table on Rest of World (ROW) - Year-over-year growth (2024-2029) (%)

      13 Drivers, Challenges, and Opportunity/Restraints

      • 13.1 Market drivers
        • 13.2 Market challenges
          • 13.3 Impact of drivers and challenges
            • Impact of drivers and challenges in 2024 and 2029
          • 13.4 Market opportunities/restraints

            14 Competitive Landscape

            • 14.1 Overview
              • 14.2 Competitive Landscape
                • Overview on criticality of inputs and factors of differentiation
              • 14.3 Landscape disruption
                • Overview on factors of disruption
              • 14.4 Industry risks
                • Impact of key risks on business

              15 Competitive Analysis

              • 15.1 Companies profiled
                • Companies covered
              • 15.2 Market positioning of companies
                • Matrix on companies position and classification
              • 15.3 ALCO ALUMINIUM LADDERS Pvt. Ltd.
                • ALCO ALUMINIUM LADDERS Pvt. Ltd. - Overview
                • ALCO ALUMINIUM LADDERS Pvt. Ltd. - Product / Service
                • ALCO ALUMINIUM LADDERS Pvt. Ltd. - Key offerings
              • 15.4 Altrex B.V.
                • Altrex B.V. - Overview
                • Altrex B.V. - Product / Service
                • Altrex B.V. - Key offerings
              • 15.5 Argent Industrial Ltd.
                • Argent Industrial Ltd. - Overview
                • Argent Industrial Ltd. - Product / Service
                • Argent Industrial Ltd. - Key offerings
              • 15.6 Bauer Corp.
                • Bauer Corp. - Overview
                • Bauer Corp. - Product / Service
                • Bauer Corp. - Key offerings
              • 15.7 EGA Products Inc.
                • EGA Products Inc. - Overview
                • EGA Products Inc. - Product / Service
                • EGA Products Inc. - Key offerings
              • 15.8 Falcon Ladder and Scaffold
                • Falcon Ladder and Scaffold - Overview
                • Falcon Ladder and Scaffold - Product / Service
                • Falcon Ladder and Scaffold - Key offerings
              • 15.9 Fastenal Co.
                • Fastenal Co. - Overview
                • Fastenal Co. - Product / Service
                • Fastenal Co. - Key offerings
              • 15.10 Gorilla Ladders
                • Gorilla Ladders - Overview
                • Gorilla Ladders - Product / Service
                • Gorilla Ladders - Key offerings
              • 15.11 Hasegawa USA Inc.
                • Hasegawa USA Inc. - Overview
                • Hasegawa USA Inc. - Product / Service
                • Hasegawa USA Inc. - Key offerings
              • 15.12 LockNClimb LLC
                • LockNClimb LLC - Overview
                • LockNClimb LLC - Product / Service
                • LockNClimb LLC - Key offerings
              • 15.13 Louisville Ladder Inc.
                • Louisville Ladder Inc. - Overview
                • Louisville Ladder Inc. - Product / Service
                • Louisville Ladder Inc. - Key offerings
              • 15.14 Lynn Ladder and Scaffolding Co. Inc.
                • Lynn Ladder and Scaffolding Co. Inc. - Overview
                • Lynn Ladder and Scaffolding Co. Inc. - Product / Service
                • Lynn Ladder and Scaffolding Co. Inc. - Key offerings
              • 15.15 Menard Inc.
                • Menard Inc. - Overview
                • Menard Inc. - Product / Service
                • Menard Inc. - Key offerings
              • 15.16 Moulton Ladder and Scaffold Co.
                • Moulton Ladder and Scaffold Co. - Overview
                • Moulton Ladder and Scaffold Co. - Product / Service
                • Moulton Ladder and Scaffold Co. - Key offerings
              • 15.17 P.W. Platforms Inc.
                • P.W. Platforms Inc. - Overview
                • P.W. Platforms Inc. - Product / Service
                • P.W. Platforms Inc. - Key offerings
              • 15.18 Putnam Rolling Ladder Co. Inc.
                • Putnam Rolling Ladder Co. Inc. - Overview
                • Putnam Rolling Ladder Co. Inc. - Product / Service
                • Putnam Rolling Ladder Co. Inc. - Key offerings
              • 15.19 TB Davies
                • TB Davies - Overview
                • TB Davies - Product / Service
                • TB Davies - Key offerings
              • 15.20 Tri Arc LLC
                • Tri Arc LLC - Overview
                • Tri Arc LLC - Product / Service
                • Tri Arc LLC - Key offerings
              • 15.21 Werner Co.
                • Werner Co. - Overview
                • Werner Co. - Product / Service
                • Werner Co. - Key offerings
              • 15.22 Zhejiang Aopeng Industry and Trading Co. Ltd.
                • Zhejiang Aopeng Industry and Trading Co. Ltd. - Overview
                • Zhejiang Aopeng Industry and Trading Co. Ltd. - Product / Service
                • Zhejiang Aopeng Industry and Trading Co. Ltd. - Key offerings
              • 15.23 ALCO ALUMINIUM LADDERS Pvt. Ltd.
                • ALCO ALUMINIUM LADDERS Pvt. Ltd. - Overview
                • ALCO ALUMINIUM LADDERS Pvt. Ltd. - Product / Service
                • ALCO ALUMINIUM LADDERS Pvt. Ltd. - Key offerings
              • 15.24 Argent Industrial Ltd.
                • Argent Industrial Ltd. - Overview
                • Argent Industrial Ltd. - Product / Service
                • Argent Industrial Ltd. - Key offerings
              • 15.25 Bauer Corp.
                • Bauer Corp. - Overview
                • Bauer Corp. - Product / Service
                • Bauer Corp. - Key offerings
              • 15.26 EGA Products Inc.
                • EGA Products Inc. - Overview
                • EGA Products Inc. - Product / Service
                • EGA Products Inc. - Key offerings
              • 15.27 Falcon Ladder and Scaffold
                • Falcon Ladder and Scaffold - Overview
                • Falcon Ladder and Scaffold - Product / Service
                • Falcon Ladder and Scaffold - Key offerings
              • 15.28 Fastenal Co.
                • Fastenal Co. - Overview
                • Fastenal Co. - Product / Service
                • Fastenal Co. - Key offerings
              • 15.29 Frenehard and Michaux
                • Frenehard and Michaux - Overview
                • Frenehard and Michaux - Product / Service
                • Frenehard and Michaux - Key offerings
              • 15.30 Gorilla Ladders
                • Gorilla Ladders - Overview
                • Gorilla Ladders - Product / Service
                • Gorilla Ladders - Key offerings
              • 15.31 Hasegawa USA Inc.
                • Hasegawa USA Inc. - Overview
                • Hasegawa USA Inc. - Product / Service
                • Hasegawa USA Inc. - Key offerings
              • 15.32 LockNClimb LLC
                • LockNClimb LLC - Overview
                • LockNClimb LLC - Product / Service
                • LockNClimb LLC - Key offerings
              • 15.33 Louisville Ladder Inc.
                • Louisville Ladder Inc. - Overview
                • Louisville Ladder Inc. - Product / Service
                • Louisville Ladder Inc. - Key offerings
              • 15.34 Lynn Ladder and Scaffolding Co. Inc.
                • Lynn Ladder and Scaffolding Co. Inc. - Overview
                • Lynn Ladder and Scaffolding Co. Inc. - Product / Service
                • Lynn Ladder and Scaffolding Co. Inc. - Key offerings
              • 15.35 Menard Inc.
                • Menard Inc. - Overview
                • Menard Inc. - Product / Service
                • Menard Inc. - Key offerings
              • 15.36 Moulton Ladder and Scaffold Co.
                • Moulton Ladder and Scaffold Co. - Overview
                • Moulton Ladder and Scaffold Co. - Product / Service
                • Moulton Ladder and Scaffold Co. - Key offerings
              • 15.37 P.W. Platforms Inc.
                • P.W. Platforms Inc. - Overview
                • P.W. Platforms Inc. - Product / Service
                • P.W. Platforms Inc. - Key offerings
              • 15.38 Putnam Rolling Ladder Co. Inc.
                • Putnam Rolling Ladder Co. Inc. - Overview
                • Putnam Rolling Ladder Co. Inc. - Product / Service
                • Putnam Rolling Ladder Co. Inc. - Key offerings
              • 15.39 TB Davies
                • TB Davies - Overview
                • TB Davies - Product / Service
                • TB Davies - Key offerings
              • 15.40 Tri Arc LLC
                • Tri Arc LLC - Overview
                • Tri Arc LLC - Product / Service
                • Tri Arc LLC - Key offerings
              • 15.41 Werner Co.
                • Werner Co. - Overview
                • Werner Co. - Product / Service
                • Werner Co. - Key offerings
              • 15.42 Zhejiang Aopeng Industry and Trading Co. Ltd.
                • Zhejiang Aopeng Industry and Trading Co. Ltd. - Overview
                • Zhejiang Aopeng Industry and Trading Co. Ltd. - Product / Service
                • Zhejiang Aopeng Industry and Trading Co. Ltd. - Key offerings

              16 Appendix

              • 16.1 Scope of the report
                • 16.2 Inclusions and exclusions checklist
                  • Inclusions checklist
                  • Exclusions checklist
                • 16.3 Currency conversion rates for US$
                  • Currency conversion rates for US$
                • 16.4 Research methodology
                  • Research methodology
                • 16.5 Data procurement
                  • Information sources
                • 16.6 Data validation
                  • Data validation
                • 16.7 Validation techniques employed for market sizing
                  • Validation techniques employed for market sizing
                • 16.8 Data synthesis
                  • Data synthesis
                • 16.9 360 degree market analysis
                  • 360 degree market analysis
                • 16.10 List of abbreviations
                  • List of abbreviations

                Research Methodology

                Technavio presents a detailed picture of the market by way of study, synthesis, and summation of data from multiple sources. The analysts have presented the various facets of the market with a particular focus on identifying the key industry influencers. The data thus presented is comprehensive, reliable, and the result of extensive research, both primary and secondary.

                INFORMATION SOURCES

                Primary sources

                • Manufacturers and suppliers
                • Channel partners
                • Industry experts
                • Strategic decision makers

                Secondary sources

                • Industry journals and periodicals
                • Government data
                • Financial reports of key industry players
                • Historical data
                • Press releases

                DATA ANALYSIS

                Data Synthesis

                • Collation of data
                • Estimation of key figures
                • Analysis of derived insights

                Data Validation

                • Triangulation with data models
                • Reference against proprietary databases
                • Corroboration with industry experts

                REPORT WRITING

                Qualitative

                • Market drivers
                • Market challenges
                • Market trends
                • Five forces analysis

                Quantitative

                • Market size and forecast
                • Market segmentation
                • Geographical insights
                • Competitive landscape

                Interested in this report?

                Get your sample now to see our research methodology and insights!

                Download Now

                Frequently Asked Questions

                Ladder market growth will increase by $ 573.9 mn during 2025-2029.

                The Ladder market is expected to grow at a CAGR of 5% during 2025-2029.

                Ladder market is segmented by Application( Industrial, Domestic, Commercial) Material( Aluminium, Steel, Fiberglass, Wood, Others)

                ALCO ALUMINIUM LADDERS Pvt. Ltd., Altrex B.V., Argent Industrial Ltd., Bauer Corp., EGA Products Inc., Falcon Ladder and Scaffold, Fastenal Co., Gorilla Ladders, Hasegawa USA Inc., LockNClimb LLC, Louisville Ladder Inc., Lynn Ladder and Scaffolding Co. Inc., Menard Inc., Moulton Ladder and Scaffold Co., P.W. Platforms Inc., Putnam Rolling Ladder Co. Inc., TB Davies, Tri Arc LLC, Werner Co., Zhejiang Aopeng Industry and Trading Co. Ltd. are a few of the key vendors in the Ladder market.

                APAC will register the highest growth rate of 47% among the other regions. Therefore, the Ladder market in APAC is expected to garner significant business opportunities for the vendors during the forecast period.

                US, China, Japan, Germany, France, Spain, Canada, India, South Korea, France, Japan, Italy, Brazil, UAE, UK, Spain, Rest of World (ROW)

                • Rising focus on construction activities across the emerging countriesDomestic is the second largest revenue-contributing application segment of the global ladder market. Therefore is the driving factor this market.
                • the growth in the number of residences will increase the demand for ladders. Extension is the driving factor this market.
                • single is the driving factor this market.
                • and standard step ladders are used in domestic applications. The global housing market grew significantly between 2013 and 2023. The high sales of modern residential dwellings and improvements in economic conditions and consumer spending power drove the growth of the global housing market. For instance is the driving factor this market.
                • the number of residential apartments required for rent in the U.S. is expected to increase by 25%-30% by 2025 due to the growing demand for single-family rental homes. Investments in the housing market in the U.S. mostly ensue from the rising demand for single-family units. Moreover is the driving factor this market.
                • in many developing countries is the driving factor this market.
                • such as China is the driving factor this market.
                • Brazil is the driving factor this market.
                • and India is the driving factor this market.
                • rapid urbanization has increased the demand for new housing projects as people migrate to urban locations. For instance is the driving factor this market.
                • in August 2020 is the driving factor this market.
                • Union Minister for Housing and Urban Affairs in India announced the Affordable Rental Housing Complex (ARHC) scheme for urban migrants. The growth of the global housing market is expected to increase the demand for household products such as ladders during the forecast period. is the driving factor this market.

                The Ladder market vendors should focus on grabbing business opportunities from the Industrial segment as it accounted for the largest market share in the base year.