Kiln Furniture Market Analysis, Size, and Forecast 2026-2030: North America (US, Canada, and Mexico), Europe (Germany, UK, and France), APAC (China, Japan, and India), South America (Brazil, Argentina, and Colombia), Middle East and Africa (Saudi Arabia, UAE, and South Africa), and Rest of World (ROW)

Kiln Furniture Market Analysis, Size, and Forecast 2026-2030:
North America (US, Canada, and Mexico), Europe (Germany, UK, and France), APAC (China, Japan, and India), South America (Brazil, Argentina, and Colombia), Middle East and Africa (Saudi Arabia, UAE, and South Africa), and Rest of World (ROW)

Published: Dec 2025 290 Pages SKU: IRTNTR76552

Market Overview at a Glance

$182.3 Mn
Market Opportunity
5.1%
CAGR 2025 - 2030
38.9%
North America Growth
$259 Mn
Ceramic industry segment 2024

Kiln Furniture Market Size 2026-2030

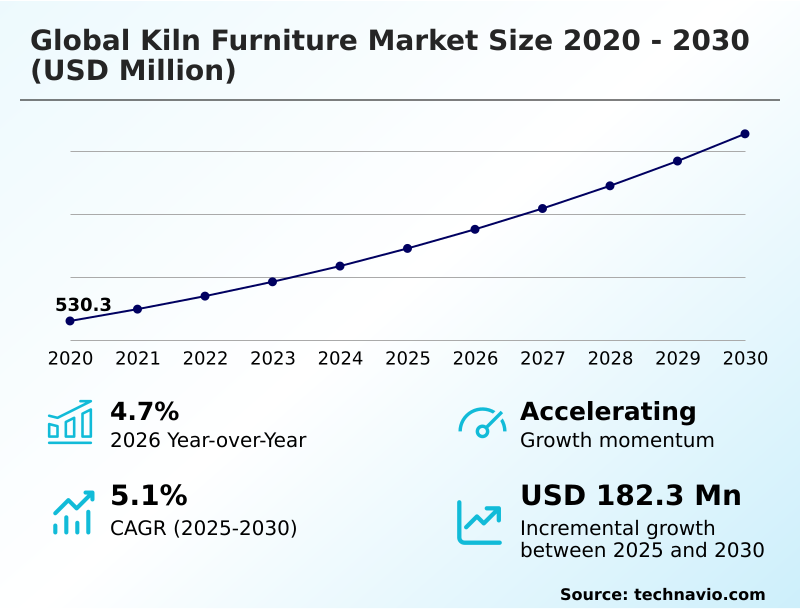
The kiln furniture market size is valued to increase by USD 182.3 million, at a CAGR of 5.1% from 2025 to 2030. Increasing adoption of ceramic products in residential and commercial decor will drive the kiln furniture market.

Major Market Trends & Insights

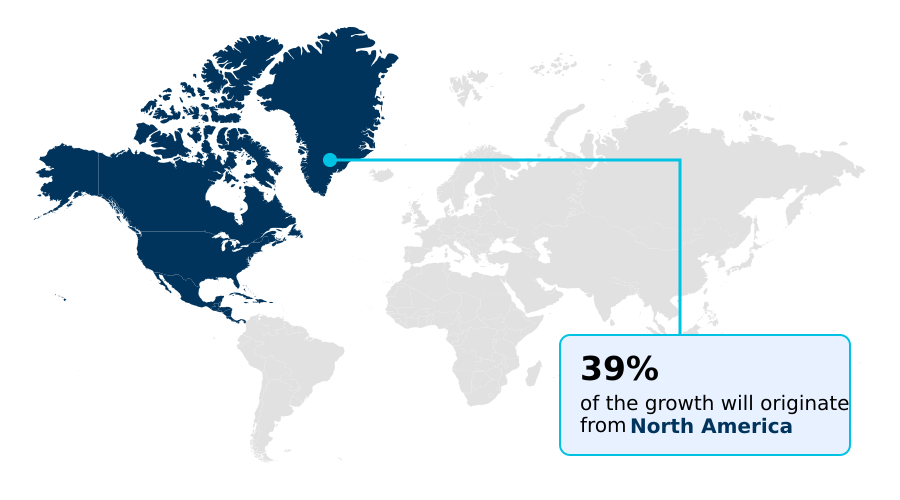
  • North America dominated the market and accounted for a 38.9% growth during the forecast period.
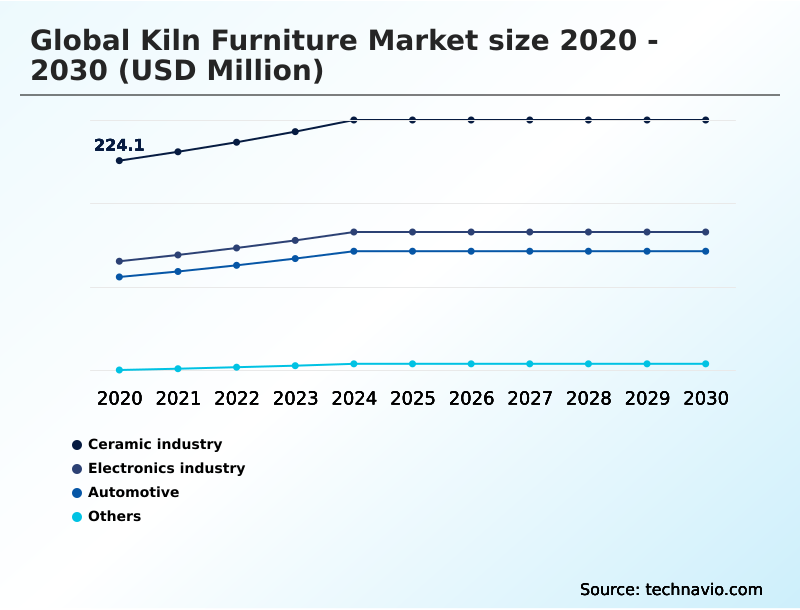
  • By Application - Ceramic industry segment was valued at USD 259 million in 2024
  • By Distribution Channel - Offline segment accounted for the largest market revenue share in 2024

Market Size & Forecast

  • Market Opportunities: USD 297.7 million
  • Market Future Opportunities: USD 182.3 million
  • CAGR from 2025 to 2030 : 5.1%

Market Summary

  • The kiln furniture market is undergoing a significant transformation driven by dual pressures from high-tech manufacturing expansion and industrial decarbonization goals. A key driver is the rising demand from sectors like electric vehicle battery production and semiconductor fabrication, which require advanced components like high-purity setters for semiconductor firing and specialized refractory saggars.
  • This necessitates materials with exceptional thermal shock resistance and chemical inertness to ensure high yields. A major trend is the focus on lightweight kiln furniture energy savings, with manufacturers adopting low thermal mass refractory supports to reduce energy consumption and shorten firing cycle times.
  • For instance, a facility optimizing its industrial kiln operations with lightweight kiln furniture can reduce energy costs by over 15% per cycle. However, the industry faces challenges from volatile raw material prices for refractory ceramics and the high capital expenditure for adopting automated kiln furniture systems.
  • Balancing the need for high-performance, custom kiln furniture for medical implants or aerospace parts with production costs remains a central strategic consideration for market participants.

What will be the Size of the Kiln Furniture Market during the forecast period?

Get Key Insights on Market Forecast (PDF) Request Free Sample

How is the Kiln Furniture Market Segmented?

The kiln furniture industry research report provides comprehensive data (region-wise segment analysis), with forecasts and estimates in "USD million" for the period 2026-2030, as well as historical data from 2020-2024 for the following segments.

  • Application
    • Ceramic industry
    • Electronics industry
    • Automotive
    • Others
  • Distribution channel
    • Offline
    • Online
  • Product type
    • Shelves
    • Posts and pillars
    • Tubes and setters
    • Others
  • Geography
    • North America
      • US
      • Canada
      • Mexico
    • Europe
      • Germany
      • UK
      • France
    • APAC
      • China
      • Japan
      • India
    • South America
      • Brazil
      • Argentina
      • Colombia
    • Middle East and Africa
      • Saudi Arabia
      • UAE
      • South Africa
    • Rest of World (ROW)

By Application Insights

The ceramic industry segment is estimated to witness significant growth during the forecast period.

The ceramic industry segment remains the largest consumer, driven by the need for durable advanced refractory materials.

Products like silicon carbide kiln furniture are favored for their superior thermal shock resistance and high-modulus of rupture, crucial for demanding industrial kiln operations. The segment is also seeing increased use of high-purity zirconia in applications requiring zero-contamination environments.

Effective thermal processing of materials relies on precise thermal uniformity control, a factor that has led to a 20% reduction in product defects for adopters of advanced systems.

This emphasis on quality aligns with industrial energy efficiency mandates and enhances refractory lifecycle management, supporting overall supply chain security.

Request Free Sample

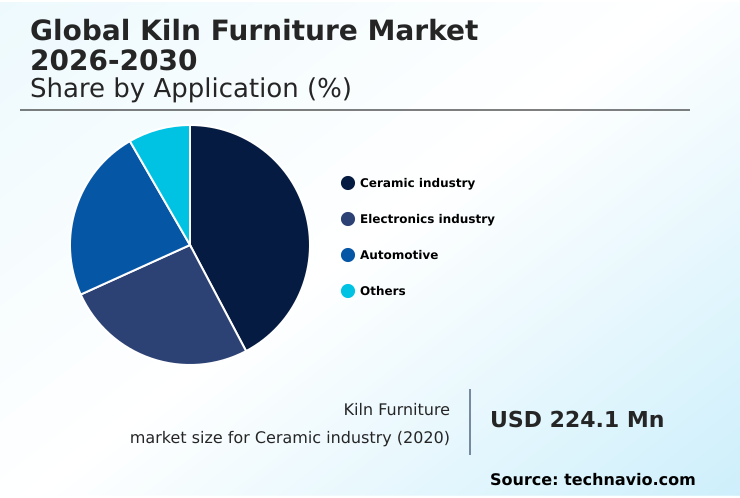
The Ceramic industry segment was valued at USD 259 million in 2024 and showed a gradual increase during the forecast period.

Request Free Sample

Regional Analysis

North America is estimated to contribute 38.9% to the growth of the global market during the forecast period.Technavio’s analysts have elaborately explained the regional trends and drivers that shape the market during the forecast period.

See How Kiln Furniture Market Demand is Rising in North America Request Free Sample

The geographic landscape is shifting, with North America and APAC emerging as key growth centers. In APAC, massive ceramic industry applications drive demand for structural kiln furniture and innovations in kiln car construction, improving load-bearing efficiency.

The region accounts for over 45% of global tile production. In North America, the focus is on kiln fleet modernization for high-tech sectors, including precision glass processing and high-temperature superalloy processing.

This requires high-purity alumina components and advanced designs like hollow-section posts to optimize the payload-to-furniture ratio.

Such firing process optimization enhances output in critical areas like advanced chip packaging and other industrial firing processes, with some facilities reporting a 15% reduction in cycle times.

Market Dynamics

Our researchers analyzed the data with 2025 as the base year, along with the key drivers, trends, and challenges. A holistic analysis of drivers will help companies refine their marketing strategies to gain a competitive advantage.

  • Strategic decision-making in the market is increasingly focused on specialized applications and operational efficiency. The process of optimizing kiln furniture for battery materials, for instance, has become a critical competitive differentiator, particularly with the rise of kiln furniture for solid-state battery manufacturing.
  • Companies are evaluating cordierite vs silicon carbide cost-benefit to achieve lightweight kiln furniture energy savings and reducing firing cycle times with low-mass furniture. The goal is to improve the payload-to-furniture ratio in kilns, a key metric for automation in kiln loading and unloading.
  • In high-tech sectors, the demand for high-purity setters for semiconductor firing and advanced ceramics for aerospace components is driving innovation. Similarly, the healthcare industry requires custom kiln furniture for medical implants and zirconia furniture for dental ceramic firing, where managing thermal shock in ceramic production is paramount.
  • The sustainability agenda is also pushing new frontiers, with research into refractory materials for hydrogen-based steelmaking and refractory solutions for direct lithium extraction. Effective lifecycle management of kiln consumables and a focus on sustainable materials in kiln furniture design are becoming standard.
  • This has led some firms to standardize on high-strength posts for automated stacking and nitride-bonded SiC for precision firing to improve controlling thermal uniformity in large kilns, which can reduce product rejection rates by more than 10% compared to legacy systems. This is particularly crucial for kiln furniture for large format tile production.

What are the key market drivers leading to the rise in the adoption of Kiln Furniture Industry?

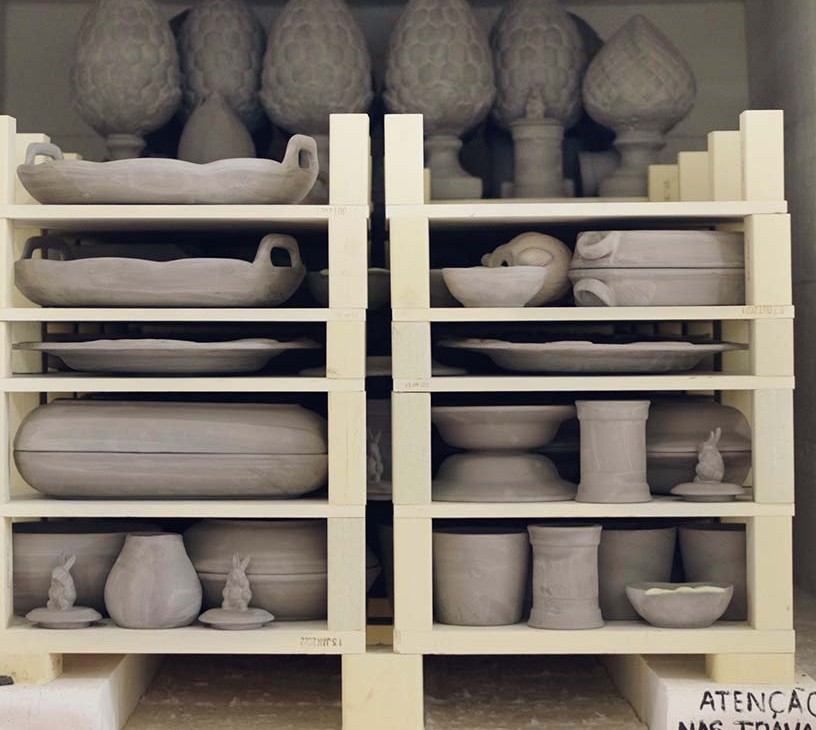
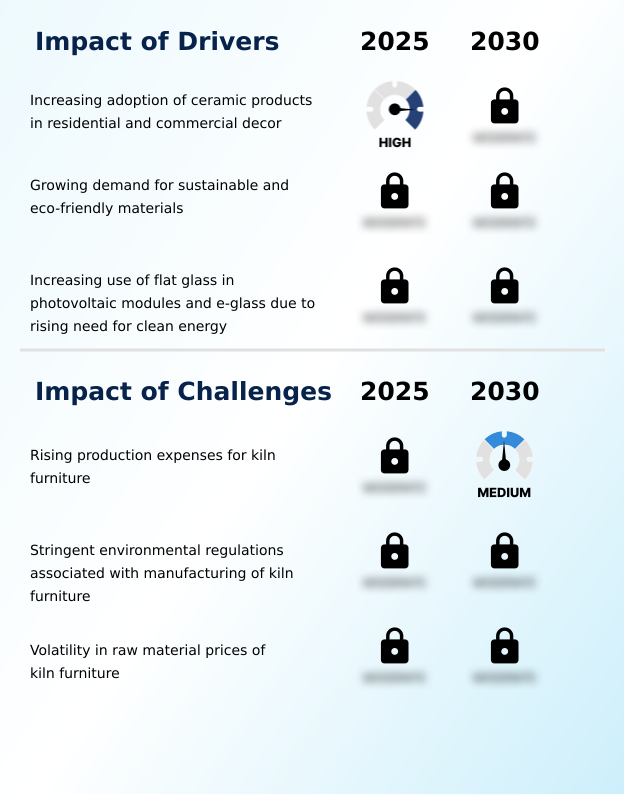
  • The growing adoption of ceramic products in residential and commercial decor is a key driver for the market's growth.

  • The push for industrial decarbonization is a primary market driver, compelling the adoption of green manufacturing solutions and innovative kiln firing technologies.
  • Industries are increasingly utilizing low thermal mass refractory supports and materials like recrystallized silicon carbide to reduce energy consumption during high-temperature sintering processes, achieving energy savings of over 20%.
  • The expansion of automated kiln furniture systems with features like interlocking post designs supports automated handling systems and enhances operational efficiency.
  • Furthermore, demand is surging for specialized components like direct lithium extraction ceramics and those used for cathode active material calcination, which must exhibit superior hot strength retention. These trends align with circular economy principles, promoting sustainability across manufacturing.

What are the market trends shaping the Kiln Furniture Industry?

  • The increasing demand for advanced ceramics is a significant upcoming trend. This is expected to influence industrial manufacturing processes by requiring materials with superior performance in extreme conditions.

  • Technological advancements are reshaping the industry, with a strong focus on advanced material sciences and thermal management strategies. The adoption of advanced technical ceramics, such as nitride-bonded silicon carbide and ceramic matrix composites, is accelerating to meet demands for higher performance.
  • Innovations in lightweight kiln furniture and ceramic rollers and setters are enabling fast-firing cycles, which improves throughput by up to 25%. Manufacturers are also developing custom-engineered ceramic plates from materials like high-purity fused silica to maintain stability under precise kiln atmosphere controls.
  • This shift enhances the performance of kiln consumables and addresses supply chain security by extending component lifecycles, reducing replacement frequency by 15%.

What challenges does the Kiln Furniture Industry face during its growth?

  • Rising production expenses for kiln furniture represent a primary challenge, potentially affecting the industry's growth prospects.

  • Volatility in raw material pricing presents a significant challenge, impacting the cost of refractory ceramics and essential refractory binders and additives. This creates production hurdles for standard products like cordierite kiln furniture, mullite batts, and refractory saggars. While demand for energy-efficient kiln designs and reusable kiln furniture systems is high, manufacturers face a 10% rise in input costs, squeezing margins.
  • Adhering to stringent material purity standards and meeting complex dimensional stability requirements for custom refractory shapes becomes more difficult. Even with advancements in cordierite-mullite compositions and refractory waste recycling initiatives, ensuring consistent refractory product durability remains a primary concern for operators.

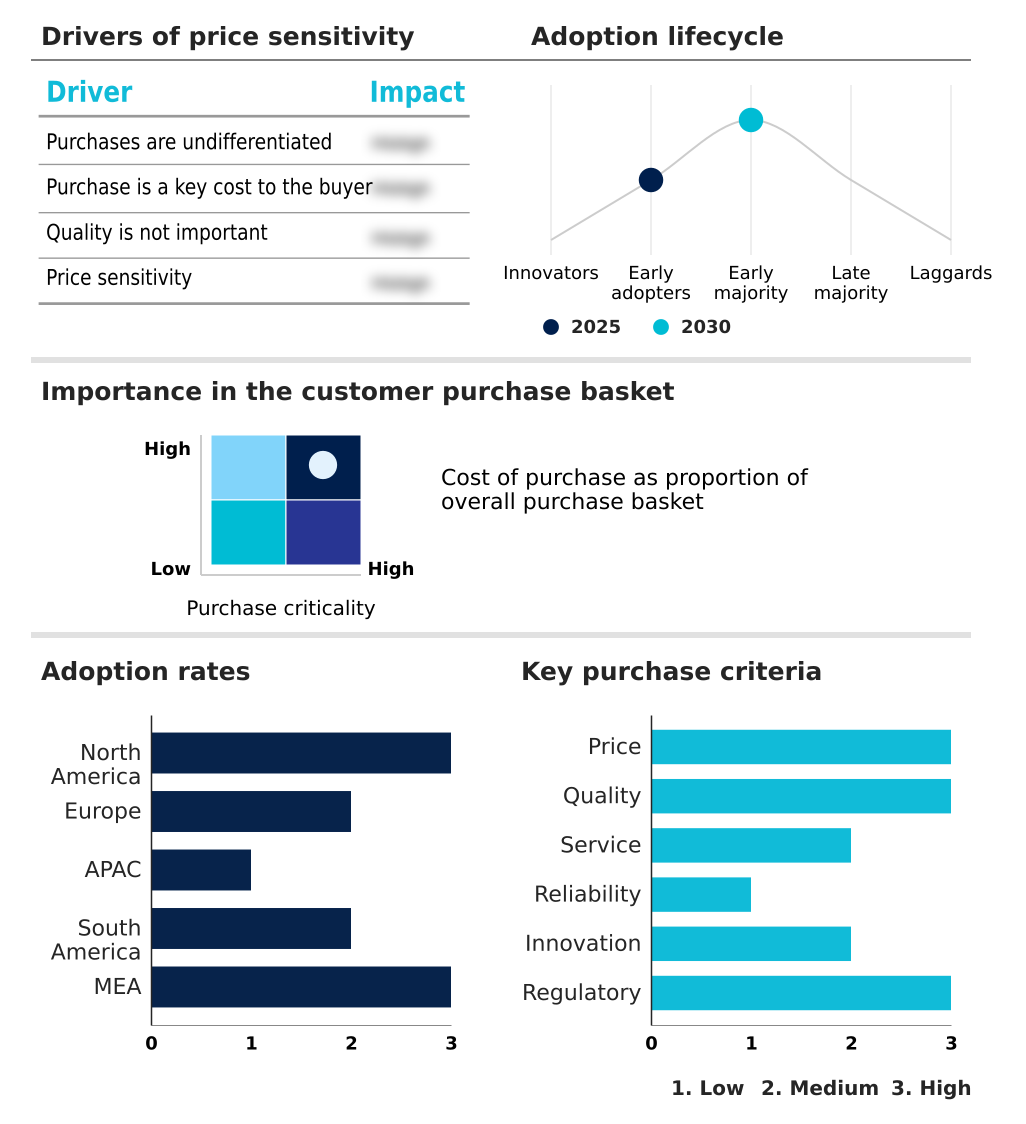
Exclusive Technavio Analysis on Customer Landscape

The kiln furniture market forecasting report includes the adoption lifecycle of the market, covering from the innovator’s stage to the laggard’s stage. It focuses on adoption rates in different regions based on penetration. Furthermore, the kiln furniture market report also includes key purchase criteria and drivers of price sensitivity to help companies evaluate and develop their market growth analysis strategies.

Customer Landscape of Kiln Furniture Industry

Competitive Landscape

Companies are implementing various strategies, such as strategic alliances, kiln furniture market forecast, partnerships, mergers and acquisitions, geographical expansion, and product/service launches, to enhance their presence in the industry.

Anderman and Co. Ltd. - Delivers high-performance refractory solutions, including custom-engineered ceramic components, designed for enhanced thermal stability and durability in demanding industrial firing processes.

The industry research and growth report includes detailed analyses of the competitive landscape of the market and information about key companies, including:

  • Anderman and Co. Ltd.
  • Applied Ceramics
  • Compagnie de Saint Gobain SA
  • Duratec Technical Co. Ltd.
  • Imerys S.A.
  • IPS Ceramics Ltd.
  • NGK Insulators Ltd.
  • Potclays Ltd.
  • Refratechnik Holding
  • Resco Products Inc.
  • Schunk GmbH
  • Shandong Robert New Co. Ltd.
  • Silcarb Recrystallized Pvt. Ltd.
  • Steuler Holding GmbH
  • TechCeramic Co. Ltd.
  • The Pottery Supply House

Qualitative and quantitative analysis of companies has been conducted to help clients understand the wider business environment as well as the strengths and weaknesses of key industry players. Data is qualitatively analyzed to categorize companies as pure play, category-focused, industry-focused, and diversified; it is quantitatively analyzed to categorize companies as dominant, leading, strong, tentative, and weak.

Recent Development and News in Kiln furniture market

  • In April, 2025, Toyota commenced commercial production at its new battery manufacturing plant in North Carolina, increasing demand for high-purity saggars and setters for thermal processing of battery materials.
  • In May, 2025, Saint-Gobain Performance Ceramics and Refractories showcased its advanced range of saggers and rollers designed for lithium-ion battery cathode active material processing at a major industry event.
  • In January, 2025, Kyocera Corp. announced a strategic initiative to divest non-core businesses to focus resources on its semiconductor-related operations, driving demand for high-precision kiln furniture.
  • In November, 2025, Saint-Gobain Ceramics announced a strategic partnership with Eurodia Industrie to deliver integrated material solutions for Direct Lithium Extraction (DLE), utilizing durable ceramic filtration and thermal processing units.

Dive into Technavio’s robust research methodology, blending expert interviews, extensive data synthesis, and validated models for unparalleled Kiln Furniture Market insights. See full methodology.

Market Scope
Page number 290
Base year 2025
Historic period 2020-2024
Forecast period 2026-2030
Growth momentum & CAGR Accelerate at a CAGR of 5.1%
Market growth 2026-2030 USD 182.3 million
Market structure Fragmented
YoY growth 2025-2026(%) 4.7%
Key countries US, Canada, Mexico, Germany, UK, France, Italy, The Netherlands, Spain, China, Japan, India, South Korea, Australia, Indonesia, Brazil, Argentina, Colombia, Saudi Arabia, UAE, South Africa, Israel and Turkey
Competitive landscape Leading Companies, Market Positioning of Companies, Competitive Strategies, and Industry Risks

Request Free Sample

Research Analyst Overview

  • The market is characterized by a rapid evolution in material science, with advanced technical ceramics becoming standard. Innovations in cordierite kiln furniture and silicon carbide kiln furniture are driven by the need for superior thermal shock resistance and hot strength retention.
  • We see a pivot toward specialized materials like high-purity alumina, recrystallized silicon carbide, and nitride-bonded silicon carbide, especially for high-temperature sintering and precision glass processing. The adoption of low thermal mass refractory supports and lightweight kiln furniture is critical for creating energy-efficient kiln designs. In fact, some operators have achieved a 15% reduction in cycle times.
  • Key components like refractory saggars, mullite batts, and ceramic rollers and setters are being redesigned, alongside interlocking post designs and hollow-section posts for automated kiln furniture systems. This optimization of kiln car construction and structural kiln furniture is essential.
  • The development of ceramic matrix composites, high-purity fused silica, and high-purity zirconia supports demanding applications like direct lithium extraction ceramics and high-temperature superalloy processing, ensuring precise thermal uniformity control in industrial kiln operations and improving load-bearing efficiency.
  • The market for cordierite-mullite compositions, custom-engineered ceramic plates, advanced refractory materials, and refractory binders and additives is also expanding to support this complex thermal processing of materials.

What are the Key Data Covered in this Kiln Furniture Market Research and Growth Report?

  • What is the expected growth of the Kiln Furniture Market between 2026 and 2030?

    • USD 182.3 million, at a CAGR of 5.1%

  • What segmentation does the market report cover?

    • The report is segmented by Application (Ceramic industry, Electronics industry, Automotive, and Others), Distribution Channel (Offline, and Online), Product Type (Shelves, Posts and pillars, Tubes and setters, and Others) and Geography (North America, Europe, APAC, South America, Middle East and Africa)

  • Which regions are analyzed in the report?

    • North America, Europe, APAC, South America and Middle East and Africa

  • What are the key growth drivers and market challenges?

    • Increasing adoption of ceramic products in residential and commercial decor, Rising production expenses for kiln furniture

  • Who are the major players in the Kiln Furniture Market?

    • Anderman and Co. Ltd., Applied Ceramics, Compagnie de Saint Gobain SA, Duratec Technical Co. Ltd., Imerys S.A., IPS Ceramics Ltd., NGK Insulators Ltd., Potclays Ltd., Refratechnik Holding, Resco Products Inc., Schunk GmbH, Shandong Robert New Co. Ltd., Silcarb Recrystallized Pvt. Ltd., Steuler Holding GmbH, TechCeramic Co. Ltd. and The Pottery Supply House

Market Research Insights

  • The market's dynamics are shaped by a strategic focus on enhancing refractory product durability and optimizing firing process optimization. The adoption of advanced thermal management strategies has enabled some manufacturers to reduce energy consumption by up to 20%, directly improving operational margins.
  • Furthermore, the implementation of proactive refractory lifecycle management programs has extended the service life of kiln consumables by 30%, minimizing downtime. As industries pivot toward green manufacturing solutions, the demand for reusable kiln furniture systems grows.
  • This shift supports industrial energy efficiency mandates and strengthens supply chain security by reducing dependence on new raw materials, aligning with broader industrial decarbonization objectives.

We can help! Our analysts can customize this kiln furniture market research report to meet your requirements.

Get in touch

1. Executive Summary

1.1 Market overview

Executive Summary - Chart on Market Overview
Executive Summary - Data Table on Market Overview
Executive Summary - Chart on Global Market Characteristics
Executive Summary - Chart on Market by Geography
Executive Summary - Chart on Market Segmentation by Application
Executive Summary - Chart on Market Segmentation by Distribution Channel
Executive Summary - Chart on Market Segmentation by Product Type
Executive Summary - Chart on Incremental Growth
Executive Summary - Data Table on Incremental Growth
Executive Summary - Chart on Company Market Positioning

2. Technavio Analysis

2.1 Analysis of price sensitivity, lifecycle, customer purchase basket, adoption rates, and purchase criteria

2.2 Criticality of inputs and Factors of differentiation

Chart on Overview on criticality of inputs and factors of differentiation

2.3 Factors of disruption

Chart on Overview on factors of disruption

2.4 Impact of drivers and challenges

Chart on Impact of drivers and challenges in 2025 and 2030

3. Market Landscape

3.1 Market ecosystem

Chart on Parent Market
Data Table on - Parent Market

3.2 Market characteristics

Chart on Market characteristics analysis

3.3 Value chain analysis

Chart on Value chain analysis

4. Market Sizing

4.1 Market definition

Data Table on Offerings of companies included in the market definition

4.2 Market segment analysis

Market segments

4.3 Market size 2025

4.4 Market outlook: Forecast for 2025-2030

Chart on Global - Market size and forecast 2025-2030 ($ million)
Data Table on Global - Market size and forecast 2025-2030 ($ million)
Chart on Global Market: Year-over-year growth 2025-2030 (%)
Data Table on Global Market: Year-over-year growth 2025-2030 (%)

5. Historic Market Size

5.1 Global Kiln Furniture Market 2020 - 2024

Historic Market Size - Data Table on Global Kiln Furniture Market 2020 - 2024 ($ million)

5.2 Application segment analysis 2020 - 2024

Historic Market Size - Application Segment 2020 - 2024 ($ million)

5.3 Distribution Channel segment analysis 2020 - 2024

Historic Market Size - Distribution Channel Segment 2020 - 2024 ($ million)

5.4 Product Type segment analysis 2020 - 2024

Historic Market Size - Product Type Segment 2020 - 2024 ($ million)

5.5 Geography segment analysis 2020 - 2024

Historic Market Size - Geography Segment 2020 - 2024 ($ million)

5.6 Country segment analysis 2020 - 2024

Historic Market Size - Country Segment 2020 - 2024 ($ million)

6. Qualitative Analysis

6.1 Impact of AI in global kiln furniture market

7. Five Forces Analysis

7.1 Five forces summary

Five forces analysis - Comparison between 2025 and 2030

7.2 Bargaining power of buyers

Bargaining power of buyers - Impact of key factors 2025 and 2030

7.3 Bargaining power of suppliers

Bargaining power of suppliers - Impact of key factors in 2025 and 2030

7.4 Threat of new entrants

Threat of new entrants - Impact of key factors in 2025 and 2030

7.5 Threat of substitutes

Threat of substitutes - Impact of key factors in 2025 and 2030

7.6 Threat of rivalry

Threat of rivalry - Impact of key factors in 2025 and 2030

7.7 Market condition

Chart on Market condition - Five forces 2025 and 2030

8. Market Segmentation by Application

8.1 Market segments

Chart on Application - Market share 2025-2030 (%)
Data Table on Application - Market share 2025-2030 (%)

8.2 Comparison by Application

Chart on Comparison by Application
Data Table on Comparison by Application

8.3 Ceramic industry - Market size and forecast 2025-2030

Chart on Ceramic industry - Market size and forecast 2025-2030 ($ million)
Data Table on Ceramic industry - Market size and forecast 2025-2030 ($ million)
Chart on Ceramic industry - Year-over-year growth 2025-2030 (%)
Data Table on Ceramic industry - Year-over-year growth 2025-2030 (%)

8.4 Electronics industry - Market size and forecast 2025-2030

Chart on Electronics industry - Market size and forecast 2025-2030 ($ million)
Data Table on Electronics industry - Market size and forecast 2025-2030 ($ million)
Chart on Electronics industry - Year-over-year growth 2025-2030 (%)
Data Table on Electronics industry - Year-over-year growth 2025-2030 (%)

8.5 Automotive - Market size and forecast 2025-2030

Chart on Automotive - Market size and forecast 2025-2030 ($ million)
Data Table on Automotive - Market size and forecast 2025-2030 ($ million)
Chart on Automotive - Year-over-year growth 2025-2030 (%)
Data Table on Automotive - Year-over-year growth 2025-2030 (%)

8.6 Others - Market size and forecast 2025-2030

Chart on Others - Market size and forecast 2025-2030 ($ million)
Data Table on Others - Market size and forecast 2025-2030 ($ million)
Chart on Others - Year-over-year growth 2025-2030 (%)
Data Table on Others - Year-over-year growth 2025-2030 (%)

8.7 Market opportunity by Application

Market opportunity by Application ($ million)
Data Table on Market opportunity by Application ($ million)

9. Market Segmentation by Distribution Channel

9.1 Market segments

Chart on Distribution Channel - Market share 2025-2030 (%)
Data Table on Distribution Channel - Market share 2025-2030 (%)

9.2 Comparison by Distribution Channel

Chart on Comparison by Distribution Channel
Data Table on Comparison by Distribution Channel

9.3 Offline - Market size and forecast 2025-2030

Chart on Offline - Market size and forecast 2025-2030 ($ million)
Data Table on Offline - Market size and forecast 2025-2030 ($ million)
Chart on Offline - Year-over-year growth 2025-2030 (%)
Data Table on Offline - Year-over-year growth 2025-2030 (%)

9.4 Online - Market size and forecast 2025-2030

Chart on Online - Market size and forecast 2025-2030 ($ million)
Data Table on Online - Market size and forecast 2025-2030 ($ million)
Chart on Online - Year-over-year growth 2025-2030 (%)
Data Table on Online - Year-over-year growth 2025-2030 (%)

9.5 Market opportunity by Distribution Channel

Market opportunity by Distribution Channel ($ million)
Data Table on Market opportunity by Distribution Channel ($ million)

10. Market Segmentation by Product Type

10.1 Market segments

Chart on Product Type - Market share 2025-2030 (%)
Data Table on Product Type - Market share 2025-2030 (%)

10.2 Comparison by Product Type

Chart on Comparison by Product Type
Data Table on Comparison by Product Type

10.3 Shelves - Market size and forecast 2025-2030

Chart on Shelves - Market size and forecast 2025-2030 ($ million)
Data Table on Shelves - Market size and forecast 2025-2030 ($ million)
Chart on Shelves - Year-over-year growth 2025-2030 (%)
Data Table on Shelves - Year-over-year growth 2025-2030 (%)

10.4 Posts and pillars - Market size and forecast 2025-2030

Chart on Posts and pillars - Market size and forecast 2025-2030 ($ million)
Data Table on Posts and pillars - Market size and forecast 2025-2030 ($ million)
Chart on Posts and pillars - Year-over-year growth 2025-2030 (%)
Data Table on Posts and pillars - Year-over-year growth 2025-2030 (%)

10.5 Tubes and setters - Market size and forecast 2025-2030

Chart on Tubes and setters - Market size and forecast 2025-2030 ($ million)
Data Table on Tubes and setters - Market size and forecast 2025-2030 ($ million)
Chart on Tubes and setters - Year-over-year growth 2025-2030 (%)
Data Table on Tubes and setters - Year-over-year growth 2025-2030 (%)

10.6 Others - Market size and forecast 2025-2030

Chart on Others - Market size and forecast 2025-2030 ($ million)
Data Table on Others - Market size and forecast 2025-2030 ($ million)
Chart on Others - Year-over-year growth 2025-2030 (%)
Data Table on Others - Year-over-year growth 2025-2030 (%)

10.7 Market opportunity by Product Type

Market opportunity by Product Type ($ million)
Data Table on Market opportunity by Product Type ($ million)

11. Customer Landscape

11.1 Customer landscape overview

Analysis of price sensitivity, lifecycle, customer purchase basket, adoption rates, and purchase criteria

12. Geographic Landscape

12.1 Geographic segmentation

Chart on Market share by geography 2025-2030 (%)
Data Table on Market share by geography 2025-2030 (%)

12.2 Geographic comparison

Chart on Geographic comparison
Data Table on Geographic comparison

12.3 North America - Market size and forecast 2025-2030

Chart on North America - Market size and forecast 2025-2030 ($ million)
Data Table on North America - Market size and forecast 2025-2030 ($ million)
Chart on North America - Year-over-year growth 2025-2030 (%)
Data Table on North America - Year-over-year growth 2025-2030 (%)
Chart on Regional Comparison - North America
Data Table on Regional Comparison - North America

12.3.1 US - Market size and forecast 2025-2030

Chart on US - Market size and forecast 2025-2030 ($ million)
Data Table on US - Market size and forecast 2025-2030 ($ million)
Chart on US - Year-over-year growth 2025-2030 (%)
Data Table on US - Year-over-year growth 2025-2030 (%)

12.3.2 Canada - Market size and forecast 2025-2030

Chart on Canada - Market size and forecast 2025-2030 ($ million)
Data Table on Canada - Market size and forecast 2025-2030 ($ million)
Chart on Canada - Year-over-year growth 2025-2030 (%)
Data Table on Canada - Year-over-year growth 2025-2030 (%)

12.3.3 Mexico - Market size and forecast 2025-2030

Chart on Mexico - Market size and forecast 2025-2030 ($ million)
Data Table on Mexico - Market size and forecast 2025-2030 ($ million)
Chart on Mexico - Year-over-year growth 2025-2030 (%)
Data Table on Mexico - Year-over-year growth 2025-2030 (%)

12.4 Europe - Market size and forecast 2025-2030

Chart on Europe - Market size and forecast 2025-2030 ($ million)
Data Table on Europe - Market size and forecast 2025-2030 ($ million)
Chart on Europe - Year-over-year growth 2025-2030 (%)
Data Table on Europe - Year-over-year growth 2025-2030 (%)
Chart on Regional Comparison - Europe
Data Table on Regional Comparison - Europe

12.4.1 Germany - Market size and forecast 2025-2030

Chart on Germany - Market size and forecast 2025-2030 ($ million)
Data Table on Germany - Market size and forecast 2025-2030 ($ million)
Chart on Germany - Year-over-year growth 2025-2030 (%)
Data Table on Germany - Year-over-year growth 2025-2030 (%)

12.4.2 UK - Market size and forecast 2025-2030

Chart on UK - Market size and forecast 2025-2030 ($ million)
Data Table on UK - Market size and forecast 2025-2030 ($ million)
Chart on UK - Year-over-year growth 2025-2030 (%)
Data Table on UK - Year-over-year growth 2025-2030 (%)

12.4.3 France - Market size and forecast 2025-2030

Chart on France - Market size and forecast 2025-2030 ($ million)
Data Table on France - Market size and forecast 2025-2030 ($ million)
Chart on France - Year-over-year growth 2025-2030 (%)
Data Table on France - Year-over-year growth 2025-2030 (%)

12.4.4 Italy - Market size and forecast 2025-2030

Chart on Italy - Market size and forecast 2025-2030 ($ million)
Data Table on Italy - Market size and forecast 2025-2030 ($ million)
Chart on Italy - Year-over-year growth 2025-2030 (%)
Data Table on Italy - Year-over-year growth 2025-2030 (%)

12.4.5 The Netherlands - Market size and forecast 2025-2030

Chart on The Netherlands - Market size and forecast 2025-2030 ($ million)
Data Table on The Netherlands - Market size and forecast 2025-2030 ($ million)
Chart on The Netherlands - Year-over-year growth 2025-2030 (%)
Data Table on The Netherlands - Year-over-year growth 2025-2030 (%)

12.4.6 Spain - Market size and forecast 2025-2030

Chart on Spain - Market size and forecast 2025-2030 ($ million)
Data Table on Spain - Market size and forecast 2025-2030 ($ million)
Chart on Spain - Year-over-year growth 2025-2030 (%)
Data Table on Spain - Year-over-year growth 2025-2030 (%)

12.5 APAC - Market size and forecast 2025-2030

Chart on APAC - Market size and forecast 2025-2030 ($ million)
Data Table on APAC - Market size and forecast 2025-2030 ($ million)
Chart on APAC - Year-over-year growth 2025-2030 (%)
Data Table on APAC - Year-over-year growth 2025-2030 (%)
Chart on Regional Comparison - APAC
Data Table on Regional Comparison - APAC

12.5.1 China - Market size and forecast 2025-2030

Chart on China - Market size and forecast 2025-2030 ($ million)
Data Table on China - Market size and forecast 2025-2030 ($ million)
Chart on China - Year-over-year growth 2025-2030 (%)
Data Table on China - Year-over-year growth 2025-2030 (%)

12.5.2 Japan - Market size and forecast 2025-2030

Chart on Japan - Market size and forecast 2025-2030 ($ million)
Data Table on Japan - Market size and forecast 2025-2030 ($ million)
Chart on Japan - Year-over-year growth 2025-2030 (%)
Data Table on Japan - Year-over-year growth 2025-2030 (%)

12.5.3 India - Market size and forecast 2025-2030

Chart on India - Market size and forecast 2025-2030 ($ million)
Data Table on India - Market size and forecast 2025-2030 ($ million)
Chart on India - Year-over-year growth 2025-2030 (%)
Data Table on India - Year-over-year growth 2025-2030 (%)

12.5.4 South Korea - Market size and forecast 2025-2030

Chart on South Korea - Market size and forecast 2025-2030 ($ million)
Data Table on South Korea - Market size and forecast 2025-2030 ($ million)
Chart on South Korea - Year-over-year growth 2025-2030 (%)
Data Table on South Korea - Year-over-year growth 2025-2030 (%)

12.5.5 Australia - Market size and forecast 2025-2030

Chart on Australia - Market size and forecast 2025-2030 ($ million)
Data Table on Australia - Market size and forecast 2025-2030 ($ million)
Chart on Australia - Year-over-year growth 2025-2030 (%)
Data Table on Australia - Year-over-year growth 2025-2030 (%)

12.5.6 Indonesia - Market size and forecast 2025-2030

Chart on Indonesia - Market size and forecast 2025-2030 ($ million)
Data Table on Indonesia - Market size and forecast 2025-2030 ($ million)
Chart on Indonesia - Year-over-year growth 2025-2030 (%)
Data Table on Indonesia - Year-over-year growth 2025-2030 (%)

12.6 South America - Market size and forecast 2025-2030

Chart on South America - Market size and forecast 2025-2030 ($ million)
Data Table on South America - Market size and forecast 2025-2030 ($ million)
Chart on South America - Year-over-year growth 2025-2030 (%)
Data Table on South America - Year-over-year growth 2025-2030 (%)
Chart on Regional Comparison - South America
Data Table on Regional Comparison - South America

12.6.1 Brazil - Market size and forecast 2025-2030

Chart on Brazil - Market size and forecast 2025-2030 ($ million)
Data Table on Brazil - Market size and forecast 2025-2030 ($ million)
Chart on Brazil - Year-over-year growth 2025-2030 (%)
Data Table on Brazil - Year-over-year growth 2025-2030 (%)

12.6.2 Argentina - Market size and forecast 2025-2030

Chart on Argentina - Market size and forecast 2025-2030 ($ million)
Data Table on Argentina - Market size and forecast 2025-2030 ($ million)
Chart on Argentina - Year-over-year growth 2025-2030 (%)
Data Table on Argentina - Year-over-year growth 2025-2030 (%)

12.6.3 Colombia - Market size and forecast 2025-2030

Chart on Colombia - Market size and forecast 2025-2030 ($ million)
Data Table on Colombia - Market size and forecast 2025-2030 ($ million)
Chart on Colombia - Year-over-year growth 2025-2030 (%)
Data Table on Colombia - Year-over-year growth 2025-2030 (%)

12.7 Middle East and Africa - Market size and forecast 2025-2030

Chart on Middle East and Africa - Market size and forecast 2025-2030 ($ million)
Data Table on Middle East and Africa - Market size and forecast 2025-2030 ($ million)
Chart on Middle East and Africa - Year-over-year growth 2025-2030 (%)
Data Table on Middle East and Africa - Year-over-year growth 2025-2030 (%)
Chart on Regional Comparison - Middle East and Africa
Data Table on Regional Comparison - Middle East and Africa

12.7.1 Saudi Arabia - Market size and forecast 2025-2030

Chart on Saudi Arabia - Market size and forecast 2025-2030 ($ million)
Data Table on Saudi Arabia - Market size and forecast 2025-2030 ($ million)
Chart on Saudi Arabia - Year-over-year growth 2025-2030 (%)
Data Table on Saudi Arabia - Year-over-year growth 2025-2030 (%)

12.7.2 UAE - Market size and forecast 2025-2030

Chart on UAE - Market size and forecast 2025-2030 ($ million)
Data Table on UAE - Market size and forecast 2025-2030 ($ million)
Chart on UAE - Year-over-year growth 2025-2030 (%)
Data Table on UAE - Year-over-year growth 2025-2030 (%)

12.7.3 South Africa - Market size and forecast 2025-2030

Chart on South Africa - Market size and forecast 2025-2030 ($ million)
Data Table on South Africa - Market size and forecast 2025-2030 ($ million)
Chart on South Africa - Year-over-year growth 2025-2030 (%)
Data Table on South Africa - Year-over-year growth 2025-2030 (%)

12.7.4 Israel - Market size and forecast 2025-2030

Chart on Israel - Market size and forecast 2025-2030 ($ million)
Data Table on Israel - Market size and forecast 2025-2030 ($ million)
Chart on Israel - Year-over-year growth 2025-2030 (%)
Data Table on Israel - Year-over-year growth 2025-2030 (%)

12.7.5 Turkey - Market size and forecast 2025-2030

Chart on Turkey - Market size and forecast 2025-2030 ($ million)
Data Table on Turkey - Market size and forecast 2025-2030 ($ million)
Chart on Turkey - Year-over-year growth 2025-2030 (%)
Data Table on Turkey - Year-over-year growth 2025-2030 (%)

12.8 Market opportunity by geography

Market opportunity by geography ($ million)
Data Tables on Market opportunity by geography ($ million)

13. Drivers, Challenges, and Opportunity

13.1 Market drivers

Increasing adoption of ceramic products in residential and commercial decor
Growing demand for sustainable and eco-friendly materials
Increasing use of flat glass in photovoltaic modules and e-glass due to rising need for clean energy

13.2 Market challenges

Rising production expenses for kiln furniture
Stringent environmental regulations associated with manufacturing of kiln furniture
Volatility in raw material prices of kiln furniture

13.3 Impact of drivers and challenges

Impact of drivers and challenges in 2025 and 2030

13.4 Market opportunities

Increasing demand for advanced ceramics
Technological advancements in kiln furniture
Increasing focus on customization of kiln furniture

14. Competitive Landscape

14.1 Overview

14.2

Overview on criticality of inputs and factors of differentiation

14.3 Landscape disruption

Overview on factors of disruption

14.4 Industry risks

Impact of key risks on business

15. Competitive Analysis

15.1 Companies profiled

Companies covered

15.2 Company ranking index

15.3 Market positioning of companies

Matrix on companies position and classification

15.4 Anderman and Co. Ltd.

Anderman and Co. Ltd. - Overview
Anderman and Co. Ltd. - Product / Service
Anderman and Co. Ltd. - Key offerings
SWOT

15.5 Applied Ceramics

Applied Ceramics - Overview
Applied Ceramics - Product / Service
Applied Ceramics - Key offerings
SWOT

15.6 Compagnie de Saint Gobain SA

Compagnie de Saint Gobain SA - Overview
Compagnie de Saint Gobain SA - Business segments
Compagnie de Saint Gobain SA - Key news
Compagnie de Saint Gobain SA - Key offerings
Compagnie de Saint Gobain SA - Segment focus
SWOT

15.7 Duratec Technical Co. Ltd.

Duratec Technical Co. Ltd. - Overview
Duratec Technical Co. Ltd. - Product / Service
Duratec Technical Co. Ltd. - Key offerings
SWOT

15.8 Imerys S.A.

Imerys S.A. - Overview
Imerys S.A. - Business segments
Imerys S.A. - Key offerings
Imerys S.A. - Segment focus
SWOT

15.9 IPS Ceramics Ltd.

IPS Ceramics Ltd. - Overview
IPS Ceramics Ltd. - Product / Service
IPS Ceramics Ltd. - Key offerings
SWOT

15.10 NGK Insulators Ltd.

NGK Insulators Ltd. - Overview
NGK Insulators Ltd. - Product / Service
NGK Insulators Ltd. - Key offerings
SWOT

15.11 Potclays Ltd.

Potclays Ltd. - Overview
Potclays Ltd. - Product / Service
Potclays Ltd. - Key offerings
SWOT

15.12 Refratechnik Holding

Refratechnik Holding - Overview
Refratechnik Holding - Product / Service
Refratechnik Holding - Key offerings
SWOT

15.13 Resco Products Inc.

Resco Products Inc. - Overview
Resco Products Inc. - Product / Service
Resco Products Inc. - Key offerings
SWOT

15.14 Schunk GmbH

Schunk GmbH - Overview
Schunk GmbH - Product / Service
Schunk GmbH - Key offerings
SWOT

15.15 Silcarb Recrystallized Pvt. Ltd.

Silcarb Recrystallized Pvt. Ltd. - Overview
Silcarb Recrystallized Pvt. Ltd. - Product / Service
Silcarb Recrystallized Pvt. Ltd. - Key offerings
SWOT

15.16 Steuler Holding GmbH

Steuler Holding GmbH - Overview
Steuler Holding GmbH - Product / Service
Steuler Holding GmbH - Key offerings
SWOT

15.17 TechCeramic Co. Ltd.

TechCeramic Co. Ltd. - Overview
TechCeramic Co. Ltd. - Product / Service
TechCeramic Co. Ltd. - Key offerings
SWOT

15.18 The Pottery Supply House

The Pottery Supply House - Overview
The Pottery Supply House - Product / Service
The Pottery Supply House - Key offerings
SWOT

16. Appendix

16.1 Scope of the report

Market definition
Objectives
Notes and caveats

16.2 Inclusions and exclusions checklist

Inclusions checklist
Exclusions checklist

16.3 Currency conversion rates for US$

16.4 Research methodology

16.5 Data procurement

Information sources

16.6 Data validation

16.7 Validation techniques employed for market sizing

16.8 Data synthesis

16.9 360 degree market analysis

16.10 List of abbreviations

Research Methodology

Technavio presents a detailed picture of the market by way of study, synthesis, and summation of data from multiple sources. The analysts have presented the various facets of the market with a particular focus on identifying the key industry influencers. The data thus presented is comprehensive, reliable, and the result of extensive research, both primary and secondary.

INFORMATION SOURCES

Primary sources

  • Manufacturers and suppliers
  • Channel partners
  • Industry experts
  • Strategic decision makers

Secondary sources

  • Industry journals and periodicals
  • Government data
  • Financial reports of key industry players
  • Historical data
  • Press releases

DATA ANALYSIS

Data Synthesis

  • Collation of data
  • Estimation of key figures
  • Analysis of derived insights

Data Validation

  • Triangulation with data models
  • Reference against proprietary databases
  • Corroboration with industry experts

REPORT WRITING

Qualitative

  • Market drivers
  • Market challenges
  • Market trends
  • Five forces analysis

Quantitative

  • Market size and forecast
  • Market segmentation
  • Geographical insights
  • Competitive landscape

Interested in this report?

Get your sample now to see our research methodology and insights!

Download Now

Frequently Asked Questions

Kiln Furniture market growth will increase by USD 182.3 million during 2026-2030.

The Kiln Furniture market is expected to grow at a CAGR of 5.1% during 2026-2030.

Kiln Furniture market is segmented by Application (Ceramic industry, Electronics industry, Automotive, Others) Distribution channel (Offline, Online) Product type (Shelves, Posts and pillars, Tubes and setters, Others)

Anderman and Co. Ltd., Applied Ceramics, Compagnie de Saint Gobain SA, Duratec Technical Co. Ltd., Imerys S.A., IPS Ceramics Ltd., NGK Insulators Ltd., Potclays Ltd., Refratechnik Holding, Resco Products Inc., Schunk GmbH, Shandong Robert New Co. Ltd., Silcarb Recrystallized Pvt. Ltd., Steuler Holding GmbH, TechCeramic Co. Ltd., The Pottery Supply House are a few of the key vendors in the Kiln Furniture market.

North America will register the highest growth rate of 38.9% among the other regions. Therefore, the Kiln Furniture market in North America is expected to garner significant business opportunities for the vendors during the forecast period.

US, Canada, Mexico, Germany, UK, France, Italy, The Netherlands, Spain, China, Japan, India, South Korea, Australia, Indonesia, Brazil, Argentina, Colombia, Saudi Arabia, UAE, South Africa, Israel, Turkey

  • Increasing adoption of ceramic products in residential and commercial decor is the driving factor this market.

The Kiln Furniture market vendors should focus on grabbing business opportunities from the Application segment as it accounted for the largest market share in the base year.