IT Spending In Oil And Gas Industry Market Analysis, Size, and Forecast 2025-2029: North America (US and Canada), Europe (Germany and Russia), Middle East and Africa (UAE), APAC (Australia, China, India, and Japan), and Rest of World (ROW)

IT Spending In Oil And Gas Industry Market Analysis, Size, and Forecast 2025-2029:
North America (US and Canada), Europe (Germany and Russia), Middle East and Africa (UAE), APAC (Australia, China, India, and Japan), and Rest of World (ROW)

Published: May 2025 217 Pages SKU: IRTNTR77536

Market Overview at a Glance

$5.61 B
Market Opportunity
4.6%
CAGR
4.4
YoY growth 2024-2025(%)

It Spending In Oil And Gas Industry Market Size 2025-2029

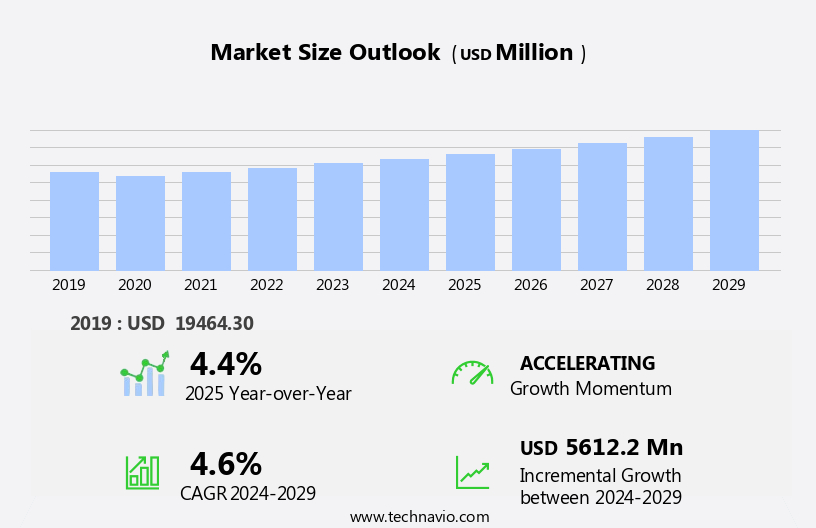
The it spending in oil and gas industry market size is forecast to increase by USD 5.61 billion, at a CAGR of 4.6% between 2024 and 2029.

  • In the Oil and Gas Industry, the relentless pursuit of operational efficiency and productivity has led to a significant increase in IT spending. This trend is driven by the growing adoption of digital technologies, such as IoT sensors, cloud computing, and automation, which enable real-time data analysis and optimization of assets and processes. The need for predictive maintenance is another key factor, as companies seek to minimize downtime and maximize the lifespan of their infrastructure. However, this digital transformation comes with challenges. Cybersecurity threats loom large, as the industry's critical infrastructure and vast amounts of sensitive data make it an attractive target for cybercriminals.
  • The successful implementation of IT projects in the Oil and Gas Industry requires a strategic approach, balancing the benefits of digital innovation with the risks of cyber threats. Companies must invest in robust security measures and adopt best practices to protect their assets and data, while also leveraging technology to drive operational excellence and competitive advantage.

What will be the Size of the It Spending In Oil And Gas Industry Market during the forecast period?

It Spending In Oil And Gas Industry Market Size

Explore in-depth regional segment analysis with market size data - historical 2019-2023 and forecasts 2025-2029 - in the full report.  
Request Free Sample

The Oil and Gas industry market continues to evolve, with dynamic market dynamics shaping the landscape. Operating expenditures (OpEx) are a significant component, with material selection and maintenance management playing crucial roles in flow assurance. IoT sensors and predictive modeling facilitate data analytics, optimizing capital expenditures (CapEx) and enhancing asset integrity management. Corrosion control and carbon capture are essential for environmental compliance, while data visualization streamlines pipeline infrastructure management. Cost reduction strategies are a constant focus, with seismic surveys and midstream operations providing opportunities for fuel efficiency improvements. Enhanced oil recovery and emissions reduction are key areas of innovation, with oilfield services and refining processes adopting machine learning and process optimization.

Remote operations and contract negotiations are facilitated by the digital oilfield, with drilling rigs and reservoir simulation ensuring production optimization. Pipeline integrity and energy efficiency improvements are critical for safety regulations and production platform operations. Renewable energy integration, LNG transportation, and artificial lift are emerging trends, with workforce training and project management essential for successful implementation. Risk assessment is a continuous process, with upstream operations requiring constant production optimization and downstream operations focusing on supply chain management. Blockchain technology, horizontal drilling, gas processing, and hydraulic fracturing are integral to these evolving patterns, driving the industry forward.

How is this It Spending In Oil And Gas Industry Industry segmented?

The it spending in oil and gas industry industry research report provides comprehensive data (region-wise segment analysis), with forecasts and estimates in "USD million" for the period 2025-2029, as well as historical data from 2019-2023 for the following segments.

  • Component
    • Hardware
    • Services
    • Software
  • Application
    • Upstream
    • Downstream
    • Midstream
  • Sector
    • Large enterprises
    • Small and medium enterprises (SMEs)
  • Geography
    • North America
      • US
      • Canada
    • Europe
      • Germany
      • Russia
    • Middle East and Africa
      • UAE
    • APAC
      • Australia
      • China
      • India
      • Japan
    • Rest of World (ROW)

    By Component Insights

    The hardware segment is estimated to witness significant growth during the forecast period.

    The IT spending market in the oil and gas industry is experiencing significant evolution, fueled by digital transformation and the pursuit of operational efficiency. A key area of investment is hardware, with a focus on robust computing infrastructure, such as high-performance servers, scalable data storage solutions, and secure networking equipment. Servers are essential for managing the massive data generated from exploration, production, refining, and distribution processes. The adoption of cloud computing and edge computing is driving investments in specialized servers optimized for seismic processing and reservoir simulation, catering to the intricate computational demands of the industry.

    These advancements bolster decision-making capabilities and optimize operations through the integration of IoT sensors, predictive modeling, data analytics, and real-time data visualization. Capital expenditures also extend to maintenance management, flow assurance, corrosion control, carbon capture, environmental compliance, asset integrity management, and cost reduction strategies. Digital technologies, such as machine learning, process optimization, remote operations, and blockchain technology, are increasingly integrated into various aspects of upstream and downstream operations, including midstream operations, enhanced oil recovery, emissions reduction, oilfield services, refining processes, safety regulations, production platforms, renewable energy integration, LNG transportation, artificial lift, well completion, workforce training, project management, risk assessment, upstream operations, production optimization, fuel efficiency, LNG liquefaction, and supply chain management.

    The oil and gas industry's IT spending landscape is marked by a continuous focus on innovation and the implementation of advanced technologies to improve efficiency, reduce costs, and ensure regulatory compliance.

    It Spending In Oil And Gas Industry Market Size

    Request Free Sample

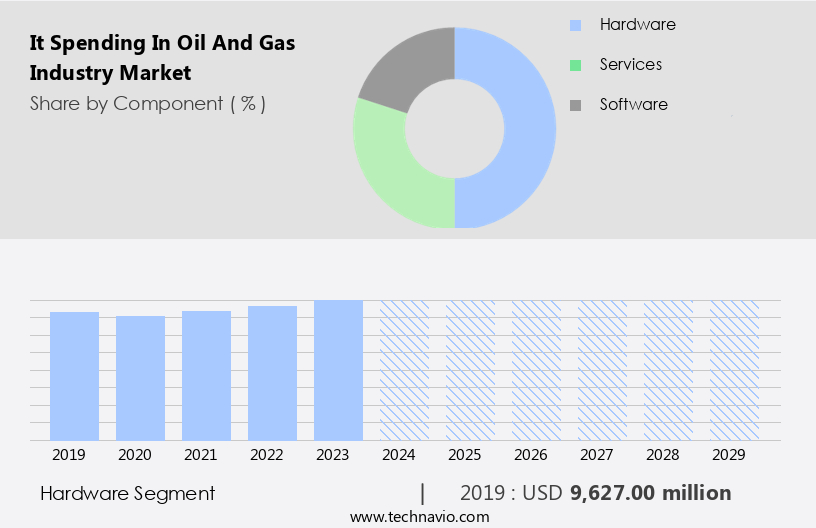
    The Hardware segment was valued at USD 9.63 billion in 2019 and showed a gradual increase during the forecast period.

    Regional Analysis

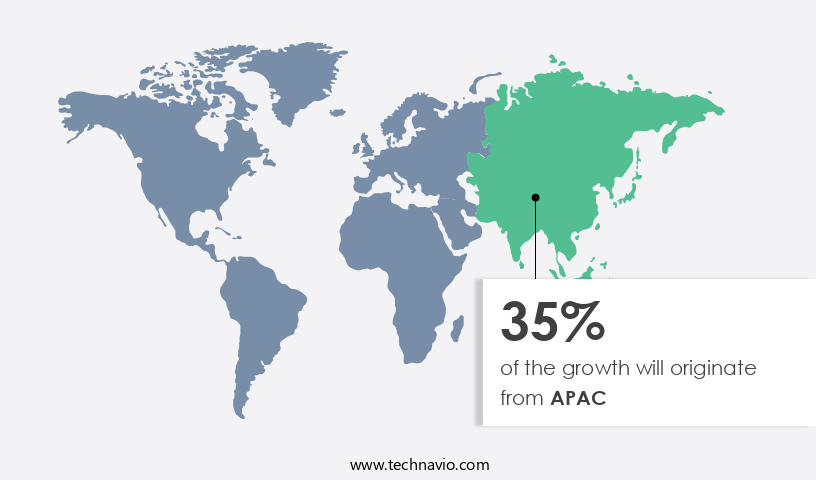
    APAC is estimated to contribute 35% to the growth of the global market during the forecast period.Technavio’s analysts have elaborately explained the regional trends and drivers that shape the market during the forecast period.

    It Spending In Oil And Gas Industry Market Share by Geography

     Request Free Sample

    In the Oil and Gas Industry Market, various entities play a pivotal role in shaping the industry's dynamics and trends. Operating expenditure is focused on maintenance management, material selection, and flow assurance to ensure optimal production. IoT sensors and predictive modeling facilitate real-time monitoring, while data analytics and data visualization enable informed decision-making. Capital expenditure is allocated to corrosion control, carbon capture, and environmental compliance to minimize risks and enhance sustainability. Asset integrity management and cost reduction strategies are essential for pipeline infrastructure and midstream operations. Seismic surveys and upstream operations employ enhanced oil recovery techniques to maximize reserves.

    Downstream operations incorporate renewable energy integration, LNG transportation, and refining processes to meet evolving energy demands. Safety regulations, production platforms, and workforce training ensure operational excellence and adherence to industry standards. Emissions reduction, artificial lift, and well completion technologies improve fuel efficiency and reduce environmental impact. Machine learning, process optimization, and remote operations streamline operations and enhance productivity. Contract negotiations, digital oilfield, drilling rigs, reservoir simulation, and pipeline integrity are crucial elements of project management and risk assessment. Energy efficiency improvements, hydraulic fracturing, and health and safety are integral to the industry's ongoing evolution. The Oil and Gas Industry Market continues to adapt and innovate, driven by the integration of these entities.

    Market Dynamics

    Our researchers analyzed the data with 2024 as the base year, along with the key drivers, trends, and challenges. A holistic analysis of drivers will help companies refine their marketing strategies to gain a competitive advantage.

    In the dynamic and technology-driven oil and gas industry, IT spending plays a pivotal role in optimizing operations, enhancing productivity, and ensuring safety and compliance. IT solutions are integral to exploring new reserves, managing drilling and production processes, and maintaining supply chain efficiency. Key areas of IT investment include data analytics for predictive maintenance, automation for streamlining workflows, cloud computing for scalability, cybersecurity for data protection, and IoT for real-time monitoring. Additionally, IT is crucial for digital transformation, enabling collaboration, and improving decision-making through advanced analytics and AI. The oil and gas industry's IT landscape is continually evolving, with a focus on innovation, sustainability, and cost optimization.

    What are the key market drivers leading to the rise in the adoption of It Spending In Oil And Gas Industry Industry?

    • The primary catalyst driving market growth is the expanding implementation of digital technologies, which significantly enhances operational efficiency and productivity. 

    • The IT spending in the oil and gas industry market is witnessing significant growth due to the increasing implementation of digital technologies. Operational efficiency and productivity are the primary drivers of this investment, as the industry faces challenges such as fluctuating commodity prices, rising operational costs, and evolving regulatory pressures. In response, companies are adopting digital solutions to optimize workflows, streamline operations, and improve overall efficiency. One critical area where digital technologies are making a significant impact is in exploration and production. Advanced data analytics tools, fueled by artificial intelligence and machine learning, enable companies to analyze vast amounts of geological, seismic, and operational data to identify promising drilling locations, optimize placement, and enhance reservoir management techniques.
    • These technologies also play a crucial role in midstream operations, including pipeline infrastructure, gas storage, and asset integrity management. Moreover, digital technologies are essential in enhancing oilfield services, such as well logging and enhanced oil recovery, as well as refining processes. Safety regulations also necessitate the adoption of digital technologies to ensure compliance and maintain safety standards on production platforms. Emissions reduction is another area where digital technologies are making a substantial impact, with companies leveraging data analytics and automation to optimize processes and reduce emissions. In summary, the oil and gas industry's IT spending market is experiencing a surge due to the adoption of digital technologies to optimize operations, reduce costs, and improve overall efficiency.
    • The implementation of these technologies is transforming various aspects of the industry, from exploration and production to midstream operations, oilfield services, and refining processes.

    What are the market trends shaping the It Spending In Oil And Gas Industry Industry?

    • The requirement for maximizing asset utilization and implementing predictive maintenance is gaining significant traction in the current market. This trend reflects the increasing importance of optimizing resources and minimizing downtime through advanced technologies and data-driven insights.

    • The oil and gas industry is implementing IT solutions to optimize asset performance and minimize downtime, as aging infrastructure and remote operations necessitate more stringent safety regulations. Predictive maintenance, driven by artificial intelligence, machine learning, and IoT technologies, enables organizations to anticipate equipment failures, preventing costly disruptions and enhancing operational efficiency. Transitioning from reactive or scheduled maintenance to proactive strategies, oil and gas companies integrate predictive maintenance into their workflows. Traditional maintenance methods, which rely on fixed schedules or manual inspections, often result in unnecessary downtime and increased costs. Upstream operations, including well completion and production optimization, benefit from IT advancements.
    • Downstream processes, such as LNG liquefaction and supply chain management, also experience improvements through technology integration. Risk assessment and project management are essential components of digital transformation in the industry. Renewable energy integration and LNG transportation are areas of focus for companies seeking to increase fuel efficiency and reduce environmental impact. Workforce training and skill development are crucial for effective implementation of IT solutions. As the industry continues to evolve, organizations must prioritize IT investments to remain competitive and efficient.

    What challenges does the It Spending In Oil And Gas Industry Industry face during its growth?

    • The cybersecurity threat to IT infrastructure in the oil and gas industry poses a significant challenge to industry growth, necessitating substantial investments to safeguard against potential data breaches and system disruptions. 

    • In the oil and gas industry market in 2024, IT spending is prioritized towards enhancing operational efficiency, optimizing processes, and ensuring cybersecurity. The industry's increasing reliance on technologies like horizontal drilling, gas processing, hydraulic fracturing, and machine learning necessitates significant IT investments. Cybersecurity is a major concern due to the interconnected digital systems used for operational control, data management, and remote monitoring. A breach could lead to operational disruptions, financial losses, environmental damage, and public safety threats. To mitigate these risks, companies invest in advanced cybersecurity solutions such as firewalls, intrusion detection systems, endpoint protection, and security information and event management (SIEM) solutions.
    • Moreover, IT spending is directed towards process optimization, including drilling rig automation and reservoir simulation, and remote operations management. Gas processing and pipeline integrity are also areas of focus for IT investment, with energy efficiency improvements being a key priority. Blockchain technology is increasingly being adopted for contract negotiations and supply chain management, providing transparency and security. In conclusion, the oil and gas industry's IT spending in 2024 is geared towards enhancing operational efficiency, optimizing processes, ensuring cybersecurity, and adopting emerging technologies like blockchain. Companies are investing in advanced IT solutions to improve drilling operations, optimize gas processing, enhance pipeline integrity, and reduce environmental impact.

    Exclusive Customer Landscape

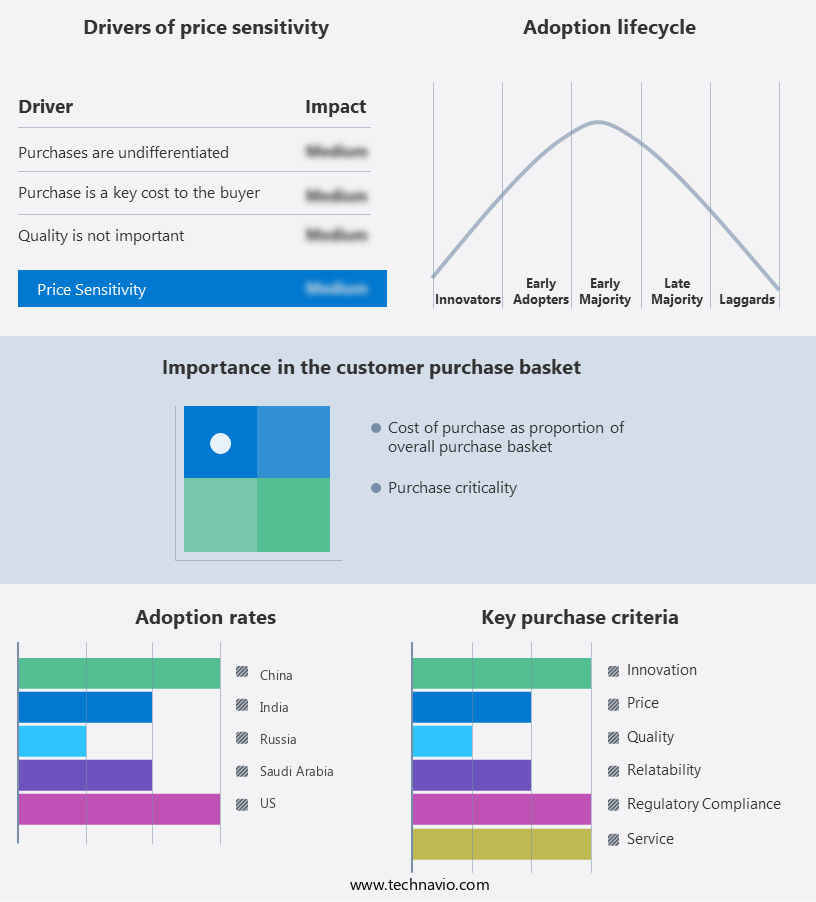
    The it spending in oil and gas industry market forecasting report includes the adoption lifecycle of the market, covering from the innovator’s stage to the laggard’s stage. It focuses on adoption rates in different regions based on penetration. Furthermore, the it spending in oil and gas industry market report also includes key purchase criteria and drivers of price sensitivity to help companies evaluate and develop their market growth analysis strategies.

    It Spending In Oil And Gas Industry Market Share by Geography

     Customer Landscape

    Key Companies & Market Insights

    Companies are implementing various strategies, such as strategic alliances, it spending in oil and gas industry market forecast, partnerships, mergers and acquisitions, geographical expansion, and product/service launches, to enhance their presence in the industry.

    ABB Ltd. - The IT spending solutions we provide to the oil and gas sector prioritize digitalization, automation, and electrification. Our offerings aim to enhance operational efficiency for energy companies, thereby reducing their environmental footprint. Simultaneously, we facilitate the emergence of new, sustainable energy value chains. By leveraging advanced technologies, we help the industry adapt to evolving market demands and sustainability goals. Our solutions are designed to streamline processes, optimize resources, and promote innovation.

    The industry research and growth report includes detailed analyses of the competitive landscape of the market and information about key companies, including:

    • ABB Ltd.
    • Accenture PLC
    • ALE International
    • Capgemini Service SAS
    • CGI Inc.
    • Cisco Systems Inc.
    • Dell Technologies Inc.
    • General Electric Co.
    • HCL Technologies Ltd.
    • Huawei Technologies Co. Ltd.
    • Indra Sistemas SA
    • Infosys Ltd.
    • International Business Machines Corp.
    • Microsoft Corp.
    • Oracle Corp.
    • SAP SE
    • Siemens AG
    • Tata Consultancy Services Ltd.
    • Tech Mahindra Ltd.
    • Wipro Ltd.

    Qualitative and quantitative analysis of companies has been conducted to help clients understand the wider business environment as well as the strengths and weaknesses of key industry players. Data is qualitatively analyzed to categorize companies as pure play, category-focused, industry-focused, and diversified; it is quantitatively analyzed to categorize companies as dominant, leading, strong, tentative, and weak.

    Recent Development and News in It Spending In Oil And Gas Industry Market

    • In January 2024, Schlumberger, a leading oilfield services company, announced the launch of its new digital platform, Omniflow, designed to optimize oil and gas production through real-time data analysis and predictive maintenance. This innovation aimed to enhance operational efficiency and reduce costs for clients (Schlumberger press release).
    • In March 2024, Chevron and Microsoft entered into a strategic partnership to digitally transform Chevron's upstream business through Microsoft's Azure cloud platform. The collaboration aimed to improve operational efficiency, reduce costs, and enhance safety through advanced analytics, machine learning, and artificial intelligence (Chevron press release).
    • In May 2024, Baker Hughes, a GE company, completed the acquisition of MasTec's oil and gas services business, expanding its capabilities in engineering, procurement, construction, and installation services. The acquisition was valued at approximately USD1.5 billion and was expected to strengthen Baker Hughes' presence in the North American market (Baker Hughes press release).
    • In April 2025, the United States Department of the Interior announced the finalization of a new five-year oil and gas leasing program, offering 77 million acres for exploration and development. This initiative aimed to support domestic energy production, create jobs, and generate revenue for public schools and other federal and state programs (Department of the Interior press release).

    Research Analyst Overview

    • In the oil and gas industry, technology spending is on the rise, driven by the need for greater efficiency, sustainability, and safety. Pump technology and compressor technology are key areas of investment, with digital twins and simulation software enabling predictive maintenance and optimization. Fracking fluids and completion fluids are being enhanced with environmentally friendly additives to reduce CO2 emissions. Wastewater treatment and water management solutions are crucial for minimizing environmental impact. Energy storage, renewable energy sources, and wind power integration are shaping the future of the industry. Hydrogen production and safety equipment are essential components of the transition to cleaner energy sources.
    • The adoption of cloud computing, big data analytics, and AI applications is revolutionizing risk management and operational efficiency. Subsea engineering, virtual reality, and augmented reality are transforming offshore drilling and maintenance. Sustainability initiatives are driving investments in geothermal energy, solar power integration, and methane emissions reduction. Polymer flooding, drone technology, and valve technology are enhancing production capabilities and improving operational safety. The oil and gas industry is embracing technology to address environmental concerns and optimize operations. From drilling to refining, digital innovation is fueling efficiency, safety, and sustainability.

    Dive into Technavio’s robust research methodology, blending expert interviews, extensive data synthesis, and validated models for unparalleled It Spending In Oil And Gas Industry Market insights. See full methodology.

    Market Scope

    Report Coverage

    Details

    Page number

    217

    Base year

    2024

    Historic period

    2019-2023

    Forecast period

    2025-2029

    Growth momentum & CAGR

    Accelerate at a CAGR of 4.6%

    Market growth 2025-2029

    USD 5612.2 million

    Market structure

    Fragmented

    YoY growth 2024-2025(%)

    4.4

    Key countries

    US, China, India, Saudi Arabia, Japan, Russia, Canada, Australia, Germany, and UAE

    Competitive landscape

    Leading Companies, Market Positioning of Companies, Competitive Strategies, and Industry Risks

    Request Free Sample

    What are the Key Data Covered in this It Spending In Oil And Gas Industry Market Research and Growth Report?

    • CAGR of the It Spending In Oil And Gas Industry industry during the forecast period
    • Detailed information on factors that will drive the growth and forecasting between 2025 and 2029
    • Precise estimation of the size of the market and its contribution of the industry in focus to the parent market
    • Accurate predictions about upcoming growth and trends and changes in consumer behaviour
    • Growth of the market across APAC, North America, Europe, Middle East and Africa, and South America
    • Thorough analysis of the market’s competitive landscape and detailed information about companies
    • Comprehensive analysis of factors that will challenge the it spending in oil and gas industry market growth of industry companies

    We can help! Our analysts can customize this it spending in oil and gas industry market research report to meet your requirements.

    Get in touch


    1 Executive Summary

    • 1.1 Market overview
      • Executive Summary - Chart on Market Overview
      • Executive Summary - Data Table on Market Overview
      • Executive Summary - Chart on Global Market Characteristics
      • Executive Summary - Chart on Market by Geography
      • Executive Summary - Chart on Market Segmentation by Component
      • Executive Summary - Chart on Market Segmentation by Application
      • Executive Summary - Chart on Market Segmentation by Sector
      • Executive Summary - Chart on Incremental Growth
      • Executive Summary - Data Table on Incremental Growth
      • Executive Summary - Chart on Company Market Positioning

    2 Technavio Analysis

    • 2.1 Analysis of price sensitivity, lifecycle, customer purchase basket, adoption rates, and purchase criteria
      • Analysis of price sensitivity, lifecycle, customer purchase basket, adoption rates, and purchase criteria
    • 2.2 Criticality of inputs and Factors of differentiation
      • Overview on criticality of inputs and factors of differentiation
    • 2.3 Factors of disruption
      • Overview on factors of disruption
    • 2.4 Impact of drivers and challenges
      • Impact of drivers and challenges in 2024 and 2029

    3 Market Landscape

    • 3.1 Market ecosystem
      • Parent Market
      • Data Table on - Parent Market
    • 3.2 Market characteristics
      • Market characteristics analysis
    • 3.3 Value chain analysis
      • Value chain analysis

    4 Market Sizing

    • 4.1 Market definition
      • Offerings of companies included in the market definition
    • 4.2 Market segment analysis
      • Market segments
    • 4.3 Market size 2024
      • 4.4 Market outlook: Forecast for 2024-2029
        • Chart on Global - Market size and forecast 2024-2029 ($ million)
        • Data Table on Global - Market size and forecast 2024-2029 ($ million)
        • Chart on Global Market: Year-over-year growth 2024-2029 (%)
        • Data Table on Global Market: Year-over-year growth 2024-2029 (%)

      5 Historic Market Size

      • 5.1 Global IT Spending In Oil And Gas Industry Market 2019 - 2023
        • Historic Market Size - Data Table on Global IT Spending In Oil And Gas Industry Market 2019 - 2023 ($ million)
      • 5.2 Component segment analysis 2019 - 2023
        • Historic Market Size - Component Segment 2019 - 2023 ($ million)
      • 5.3 Application segment analysis 2019 - 2023
        • Historic Market Size - Application Segment 2019 - 2023 ($ million)
      • 5.4 Sector segment analysis 2019 - 2023
        • Historic Market Size - Sector Segment 2019 - 2023 ($ million)
      • 5.5 Geography segment analysis 2019 - 2023
        • Historic Market Size - Geography Segment 2019 - 2023 ($ million)
      • 5.6 Country segment analysis 2019 - 2023
        • Historic Market Size - Country Segment 2019 - 2023 ($ million)

      6 Qualitative Analysis

      • 6.1 The AI impact on global IT spending in oil and gas industry market

        7 Five Forces Analysis

        • 7.1 Five forces summary
          • Five forces analysis - Comparison between 2024 and 2029
        • 7.2 Bargaining power of buyers
          • Bargaining power of buyers - Impact of key factors 2024 and 2029
        • 7.3 Bargaining power of suppliers
          • Bargaining power of suppliers - Impact of key factors in 2024 and 2029
        • 7.4 Threat of new entrants
          • Threat of new entrants - Impact of key factors in 2024 and 2029
        • 7.5 Threat of substitutes
          • Threat of substitutes - Impact of key factors in 2024 and 2029
        • 7.6 Threat of rivalry
          • Threat of rivalry - Impact of key factors in 2024 and 2029
        • 7.7 Market condition
          • Chart on Market condition - Five forces 2024 and 2029

        8 Market Segmentation by Component

        • 8.1 Market segments
          • Chart on Component - Market share 2024-2029 (%)
          • Data Table on Component - Market share 2024-2029 (%)
        • 8.2 Comparison by Component
          • Chart on Comparison by Component
          • Data Table on Comparison by Component
        • 8.3 Hardware - Market size and forecast 2024-2029
          • Chart on Hardware - Market size and forecast 2024-2029 ($ million)
          • Data Table on Hardware - Market size and forecast 2024-2029 ($ million)
          • Chart on Hardware - Year-over-year growth 2024-2029 (%)
          • Data Table on Hardware - Year-over-year growth 2024-2029 (%)
        • 8.4 Services - Market size and forecast 2024-2029
          • Chart on Services - Market size and forecast 2024-2029 ($ million)
          • Data Table on Services - Market size and forecast 2024-2029 ($ million)
          • Chart on Services - Year-over-year growth 2024-2029 (%)
          • Data Table on Services - Year-over-year growth 2024-2029 (%)
        • 8.5 Software - Market size and forecast 2024-2029
          • Chart on Software - Market size and forecast 2024-2029 ($ million)
          • Data Table on Software - Market size and forecast 2024-2029 ($ million)
          • Chart on Software - Year-over-year growth 2024-2029 (%)
          • Data Table on Software - Year-over-year growth 2024-2029 (%)
        • 8.6 Market opportunity by Component
          • Market opportunity by Component ($ million)
          • Data Table on Market opportunity by Component ($ million)

        9 Market Segmentation by Application

        • 9.1 Market segments
          • Chart on Application - Market share 2024-2029 (%)
          • Data Table on Application - Market share 2024-2029 (%)
        • 9.2 Comparison by Application
          • Chart on Comparison by Application
          • Data Table on Comparison by Application
        • 9.3 Upstream - Market size and forecast 2024-2029
          • Chart on Upstream - Market size and forecast 2024-2029 ($ million)
          • Data Table on Upstream - Market size and forecast 2024-2029 ($ million)
          • Chart on Upstream - Year-over-year growth 2024-2029 (%)
          • Data Table on Upstream - Year-over-year growth 2024-2029 (%)
        • 9.4 Downstream - Market size and forecast 2024-2029
          • Chart on Downstream - Market size and forecast 2024-2029 ($ million)
          • Data Table on Downstream - Market size and forecast 2024-2029 ($ million)
          • Chart on Downstream - Year-over-year growth 2024-2029 (%)
          • Data Table on Downstream - Year-over-year growth 2024-2029 (%)
        • 9.5 Midstream - Market size and forecast 2024-2029
          • Chart on Midstream - Market size and forecast 2024-2029 ($ million)
          • Data Table on Midstream - Market size and forecast 2024-2029 ($ million)
          • Chart on Midstream - Year-over-year growth 2024-2029 (%)
          • Data Table on Midstream - Year-over-year growth 2024-2029 (%)
        • 9.6 Market opportunity by Application
          • Market opportunity by Application ($ million)
          • Data Table on Market opportunity by Application ($ million)

        10 Market Segmentation by Sector

        • 10.1 Market segments
          • Chart on Sector - Market share 2024-2029 (%)
          • Data Table on Sector - Market share 2024-2029 (%)
        • 10.2 Comparison by Sector
          • Chart on Comparison by Sector
          • Data Table on Comparison by Sector
        • 10.3 Large enterprises - Market size and forecast 2024-2029
          • Chart on Large enterprises - Market size and forecast 2024-2029 ($ million)
          • Data Table on Large enterprises - Market size and forecast 2024-2029 ($ million)
          • Chart on Large enterprises - Year-over-year growth 2024-2029 (%)
          • Data Table on Large enterprises - Year-over-year growth 2024-2029 (%)
        • 10.4 Small and medium enterprises (SMEs) - Market size and forecast 2024-2029
          • Chart on Small and medium enterprises (SMEs) - Market size and forecast 2024-2029 ($ million)
          • Data Table on Small and medium enterprises (SMEs) - Market size and forecast 2024-2029 ($ million)
          • Chart on Small and medium enterprises (SMEs) - Year-over-year growth 2024-2029 (%)
          • Data Table on Small and medium enterprises (SMEs) - Year-over-year growth 2024-2029 (%)
        • 10.5 Market opportunity by Sector
          • Market opportunity by Sector ($ million)
          • Data Table on Market opportunity by Sector ($ million)

        11 Customer Landscape

        • 11.1 Customer landscape overview
          • Analysis of price sensitivity, lifecycle, customer purchase basket, adoption rates, and purchase criteria

        12 Geographic Landscape

        • 12.1 Geographic segmentation
          • Chart on Market share by geography 2024-2029 (%)
          • Data Table on Market share by geography 2024-2029 (%)
        • 12.2 Geographic comparison
          • Chart on Geographic comparison
          • Data Table on Geographic comparison
        • 12.3 APAC - Market size and forecast 2024-2029
          • Chart on APAC - Market size and forecast 2024-2029 ($ million)
          • Data Table on APAC - Market size and forecast 2024-2029 ($ million)
          • Chart on APAC - Year-over-year growth 2024-2029 (%)
          • Data Table on APAC - Year-over-year growth 2024-2029 (%)
        • 12.4 North America - Market size and forecast 2024-2029
          • Chart on North America - Market size and forecast 2024-2029 ($ million)
          • Data Table on North America - Market size and forecast 2024-2029 ($ million)
          • Chart on North America - Year-over-year growth 2024-2029 (%)
          • Data Table on North America - Year-over-year growth 2024-2029 (%)
        • 12.5 Europe - Market size and forecast 2024-2029
          • Chart on Europe - Market size and forecast 2024-2029 ($ million)
          • Data Table on Europe - Market size and forecast 2024-2029 ($ million)
          • Chart on Europe - Year-over-year growth 2024-2029 (%)
          • Data Table on Europe - Year-over-year growth 2024-2029 (%)
        • 12.6 Middle East and Africa - Market size and forecast 2024-2029
          • Chart on Middle East and Africa - Market size and forecast 2024-2029 ($ million)
          • Data Table on Middle East and Africa - Market size and forecast 2024-2029 ($ million)
          • Chart on Middle East and Africa - Year-over-year growth 2024-2029 (%)
          • Data Table on Middle East and Africa - Year-over-year growth 2024-2029 (%)
        • 12.7 South America - Market size and forecast 2024-2029
          • Chart on South America - Market size and forecast 2024-2029 ($ million)
          • Data Table on South America - Market size and forecast 2024-2029 ($ million)
          • Chart on South America - Year-over-year growth 2024-2029 (%)
          • Data Table on South America - Year-over-year growth 2024-2029 (%)
        • 12.8 US - Market size and forecast 2024-2029
          • Chart on US - Market size and forecast 2024-2029 ($ million)
          • Data Table on US - Market size and forecast 2024-2029 ($ million)
          • Chart on US - Year-over-year growth 2024-2029 (%)
          • Data Table on US - Year-over-year growth 2024-2029 (%)
        • 12.9 China - Market size and forecast 2024-2029
          • Chart on China - Market size and forecast 2024-2029 ($ million)
          • Data Table on China - Market size and forecast 2024-2029 ($ million)
          • Chart on China - Year-over-year growth 2024-2029 (%)
          • Data Table on China - Year-over-year growth 2024-2029 (%)
        • 12.10 India - Market size and forecast 2024-2029
          • Chart on India - Market size and forecast 2024-2029 ($ million)
          • Data Table on India - Market size and forecast 2024-2029 ($ million)
          • Chart on India - Year-over-year growth 2024-2029 (%)
          • Data Table on India - Year-over-year growth 2024-2029 (%)
        • 12.11 Saudi Arabia - Market size and forecast 2024-2029
          • Chart on Saudi Arabia - Market size and forecast 2024-2029 ($ million)
          • Data Table on Saudi Arabia - Market size and forecast 2024-2029 ($ million)
          • Chart on Saudi Arabia - Year-over-year growth 2024-2029 (%)
          • Data Table on Saudi Arabia - Year-over-year growth 2024-2029 (%)
        • 12.12 Japan - Market size and forecast 2024-2029
          • Chart on Japan - Market size and forecast 2024-2029 ($ million)
          • Data Table on Japan - Market size and forecast 2024-2029 ($ million)
          • Chart on Japan - Year-over-year growth 2024-2029 (%)
          • Data Table on Japan - Year-over-year growth 2024-2029 (%)
        • 12.13 Russia - Market size and forecast 2024-2029
          • Chart on Russia - Market size and forecast 2024-2029 ($ million)
          • Data Table on Russia - Market size and forecast 2024-2029 ($ million)
          • Chart on Russia - Year-over-year growth 2024-2029 (%)
          • Data Table on Russia - Year-over-year growth 2024-2029 (%)
        • 12.14 Canada - Market size and forecast 2024-2029
          • Chart on Canada - Market size and forecast 2024-2029 ($ million)
          • Data Table on Canada - Market size and forecast 2024-2029 ($ million)
          • Chart on Canada - Year-over-year growth 2024-2029 (%)
          • Data Table on Canada - Year-over-year growth 2024-2029 (%)
        • 12.15 Australia - Market size and forecast 2024-2029
          • Chart on Australia - Market size and forecast 2024-2029 ($ million)
          • Data Table on Australia - Market size and forecast 2024-2029 ($ million)
          • Chart on Australia - Year-over-year growth 2024-2029 (%)
          • Data Table on Australia - Year-over-year growth 2024-2029 (%)
        • 12.16 Germany - Market size and forecast 2024-2029
          • Chart on Germany - Market size and forecast 2024-2029 ($ million)
          • Data Table on Germany - Market size and forecast 2024-2029 ($ million)
          • Chart on Germany - Year-over-year growth 2024-2029 (%)
          • Data Table on Germany - Year-over-year growth 2024-2029 (%)
        • 12.17 UAE - Market size and forecast 2024-2029
          • Chart on UAE - Market size and forecast 2024-2029 ($ million)
          • Data Table on UAE - Market size and forecast 2024-2029 ($ million)
          • Chart on UAE - Year-over-year growth 2024-2029 (%)
          • Data Table on UAE - Year-over-year growth 2024-2029 (%)
        • 12.18 Market opportunity by geography
          • Market opportunity by geography ($ million)
          • Data Tables on Market opportunity by geography ($ million)

        13 Drivers, Challenges, and Opportunity/Restraints

        • 13.1 Market drivers
          • 13.2 Market challenges
            • 13.3 Impact of drivers and challenges
              • Impact of drivers and challenges in 2024 and 2029
            • 13.4 Market opportunities/restraints

              14 Competitive Landscape

              • 14.1 Overview
                • 14.2 Competitive Landscape
                  • Overview on criticality of inputs and factors of differentiation
                • 14.3 Landscape disruption
                  • Overview on factors of disruption
                • 14.4 Industry risks
                  • Impact of key risks on business

                15 Competitive Analysis

                • 15.1 Companies profiled
                  • Companies covered
                • 15.2 Company ranking index
                  • Company ranking index
                • 15.3 Market positioning of companies
                  • Matrix on companies position and classification
                • 15.4 ABB Ltd.
                  • ABB Ltd. - Overview
                  • ABB Ltd. - Business segments
                  • ABB Ltd. - Key news
                  • ABB Ltd. - Key offerings
                  • ABB Ltd. - Segment focus
                  • SWOT
                • 15.5 Capgemini Service SAS
                  • Capgemini Service SAS - Overview
                  • Capgemini Service SAS - Business segments
                  • Capgemini Service SAS - Key news
                  • Capgemini Service SAS - Key offerings
                  • Capgemini Service SAS - Segment focus
                  • SWOT
                • 15.6 CGI Inc.
                  • CGI Inc. - Overview
                  • CGI Inc. - Business segments
                  • CGI Inc. - Key news
                  • CGI Inc. - Key offerings
                  • CGI Inc. - Segment focus
                  • SWOT
                • 15.7 Cisco Systems Inc.
                  • Cisco Systems Inc. - Overview
                  • Cisco Systems Inc. - Business segments
                  • Cisco Systems Inc. - Key news
                  • Cisco Systems Inc. - Key offerings
                  • Cisco Systems Inc. - Segment focus
                  • SWOT
                • 15.8 Dell Technologies Inc.
                  • Dell Technologies Inc. - Overview
                  • Dell Technologies Inc. - Business segments
                  • Dell Technologies Inc. - Key news
                  • Dell Technologies Inc. - Key offerings
                  • Dell Technologies Inc. - Segment focus
                  • SWOT
                • 15.9 General Electric Co.
                  • General Electric Co. - Overview
                  • General Electric Co. - Business segments
                  • General Electric Co. - Key news
                  • General Electric Co. - Key offerings
                  • General Electric Co. - Segment focus
                  • SWOT
                • 15.10 HCL Technologies Ltd.
                  • HCL Technologies Ltd. - Overview
                  • HCL Technologies Ltd. - Business segments
                  • HCL Technologies Ltd. - Key news
                  • HCL Technologies Ltd. - Key offerings
                  • HCL Technologies Ltd. - Segment focus
                  • SWOT
                • 15.11 Huawei Technologies Co. Ltd.
                  • Huawei Technologies Co. Ltd. - Overview
                  • Huawei Technologies Co. Ltd. - Product / Service
                  • Huawei Technologies Co. Ltd. - Key news
                  • Huawei Technologies Co. Ltd. - Key offerings
                  • SWOT
                • 15.12 Indra Sistemas SA
                  • Indra Sistemas SA - Overview
                  • Indra Sistemas SA - Business segments
                  • Indra Sistemas SA - Key news
                  • Indra Sistemas SA - Key offerings
                  • Indra Sistemas SA - Segment focus
                  • SWOT
                • 15.13 International Business Machines Corp.
                  • International Business Machines Corp. - Overview
                  • International Business Machines Corp. - Business segments
                  • International Business Machines Corp. - Key news
                  • International Business Machines Corp. - Key offerings
                  • International Business Machines Corp. - Segment focus
                  • SWOT
                • 15.14 Oracle Corp.
                  • Oracle Corp. - Overview
                  • Oracle Corp. - Business segments
                  • Oracle Corp. - Key news
                  • Oracle Corp. - Key offerings
                  • Oracle Corp. - Segment focus
                  • SWOT
                • 15.15 SAP SE
                  • SAP SE - Overview
                  • SAP SE - Business segments
                  • SAP SE - Key news
                  • SAP SE - Key offerings
                  • SAP SE - Segment focus
                  • SWOT
                • 15.16 Siemens AG
                  • Siemens AG - Overview
                  • Siemens AG - Business segments
                  • Siemens AG - Key news
                  • Siemens AG - Key offerings
                  • Siemens AG - Segment focus
                  • SWOT
                • 15.17 Tata Consultancy Services Ltd.
                  • Tata Consultancy Services Ltd. - Overview
                  • Tata Consultancy Services Ltd. - Business segments
                  • Tata Consultancy Services Ltd. - Key news
                  • Tata Consultancy Services Ltd. - Key offerings
                  • Tata Consultancy Services Ltd. - Segment focus
                  • SWOT
                • 15.18 Tech Mahindra Ltd.
                  • Tech Mahindra Ltd. - Overview
                  • Tech Mahindra Ltd. - Business segments
                  • Tech Mahindra Ltd. - Key news
                  • Tech Mahindra Ltd. - Key offerings
                  • Tech Mahindra Ltd. - Segment focus
                  • SWOT

                16 Appendix

                • 16.1 Scope of the report
                  • 16.2 Inclusions and exclusions checklist
                    • Inclusions checklist
                    • Exclusions checklist
                  • 16.3 Currency conversion rates for US$
                    • Currency conversion rates for US$
                  • 16.4 Research methodology
                    • Research methodology
                  • 16.5 Data procurement
                    • Information sources
                  • 16.6 Data validation
                    • Data validation
                  • 16.7 Validation techniques employed for market sizing
                    • Validation techniques employed for market sizing
                  • 16.8 Data synthesis
                    • Data synthesis
                  • 16.9 360 degree market analysis
                    • 360 degree market analysis
                  • 16.10 List of abbreviations
                    • List of abbreviations

                  Research Methodology

                  Technavio presents a detailed picture of the market by way of study, synthesis, and summation of data from multiple sources. The analysts have presented the various facets of the market with a particular focus on identifying the key industry influencers. The data thus presented is comprehensive, reliable, and the result of extensive research, both primary and secondary.

                  INFORMATION SOURCES

                  Primary sources

                  • Manufacturers and suppliers
                  • Channel partners
                  • Industry experts
                  • Strategic decision makers

                  Secondary sources

                  • Industry journals and periodicals
                  • Government data
                  • Financial reports of key industry players
                  • Historical data
                  • Press releases

                  DATA ANALYSIS

                  Data Synthesis

                  • Collation of data
                  • Estimation of key figures
                  • Analysis of derived insights

                  Data Validation

                  • Triangulation with data models
                  • Reference against proprietary databases
                  • Corroboration with industry experts

                  REPORT WRITING

                  Qualitative

                  • Market drivers
                  • Market challenges
                  • Market trends
                  • Five forces analysis

                  Quantitative

                  • Market size and forecast
                  • Market segmentation
                  • Geographical insights
                  • Competitive landscape

                  Interested in this report?

                  Get your sample now to see our research methodology and insights!

                  Download Now

                  Frequently Asked Questions

                  It Spending In Oil And Gas Industry market growth will increase by $ 5612.2 mn during 2025-2029.

                  The It Spending In Oil And Gas Industry market is expected to grow at a CAGR of 4.6% during 2025-2029.

                  It Spending In Oil And Gas Industry market is segmented by Component( Hardware, Services, Software) Application( Upstream, Downstream, Midstream) Sector( Large enterprises, Small and medium enterprises (SMEs), Middle East and Africa, Europe, South America)

                  ABB Ltd., Accenture PLC, ALE International, Capgemini Service SAS, CGI Inc., Cisco Systems Inc., Dell Technologies Inc., General Electric Co., HCL Technologies Ltd., Huawei Technologies Co. Ltd., Indra Sistemas SA, Infosys Ltd., International Business Machines Corp., Microsoft Corp., Oracle Corp., SAP SE, Siemens AG, Tata Consultancy Services Ltd., Tech Mahindra Ltd., Wipro Ltd. are a few of the key vendors in the It Spending In Oil And Gas Industry market.

                  APAC will register the highest growth rate of 35% among the other regions. Therefore, the It Spending In Oil And Gas Industry market in APAC is expected to garner significant business opportunities for the vendors during the forecast period.

                  US, China, India, Saudi Arabia, Japan, Russia, Canada, Australia, Germany, UAE

                  • Increasing adoption of digital technologies to enhance operational efficiency and productivityThe global IT spending in oil and gas industry market continues to be driven by the increasing adoption of digital technologies aimed at enhancing operational efficiency and productivity. With ongoing challenges such as fluctuating commodity prices is the driving factor this market.
                  • rising operational costs is the driving factor this market.
                  • and evolving regulatory pressures is the driving factor this market.
                  • companies are leveraging digital solutions to streamline operations is the driving factor this market.
                  • optimize workflows is the driving factor this market.
                  • and improve overall efficiency. This trend is fueling significant investments in IT infrastructure is the driving factor this market.
                  • software applications is the driving factor this market.
                  • and data analytics platforms tailored to the specific needs of the sector.One key area where digital technologies are making a substantial impact is in the optimization of exploration and production activities. Advanced data analytics tools powered by artificial intelligence and machine learning enable companies to analyze vast amounts of geological is the driving factor this market.
                  • seismic is the driving factor this market.
                  • and operational data to identify promising drilling locations is the driving factor this market.
                  • optimize placement is the driving factor this market.
                  • and enhance reservoir management techniques. By leveraging these insights is the driving factor this market.
                  • oil and gas companies can improve exploration success rates is the driving factor this market.
                  • increase production yields is the driving factor this market.
                  • and maximize the value of their assets.Moreover is the driving factor this market.
                  • digital technologies are revolutionizing asset management and maintenance practices within the industry. Through the deployment of sensor networks is the driving factor this market.
                  • IoT devices is the driving factor this market.
                  • and predictive analytics solutions is the driving factor this market.
                  • companies can monitor the health and performance of critical assets such as drilling equipment is the driving factor this market.
                  • pipelines is the driving factor this market.
                  • and refineries in real time. By proactively identifying potential issues and scheduling maintenance activities based on actual asset conditions is the driving factor this market.
                  • operators can minimize downtime is the driving factor this market.
                  • reduce maintenance costs is the driving factor this market.
                  • and extend the lifespan of their infrastructure assets.The adoption of digital technologies is also driving improvements in supply chain management and logistics within the oil and gas sector. Integrated software solutions enable companies to optimize inventory levels is the driving factor this market.
                  • streamline procurement processes is the driving factor this market.
                  • and track the movement of materials and equipment across complex supply chains. This enhanced visibility and control over supply chain operations help companies minimize delays is the driving factor this market.
                  • reduce costs is the driving factor this market.
                  • and ensure timely delivery of goods and services to support ongoing operations.Furthermore is the driving factor this market.
                  • digital technologies are empowering remote monitoring and control capabilities is the driving factor this market.
                  • enabling companies to manage operations across vast and geographically dispersed assets more efficiently. Through the use of remote sensing is the driving factor this market.
                  • unmanned aerial vehicles (UAVs) is the driving factor this market.
                  • and satellite imagery is the driving factor this market.
                  • operators can monitor infrastructure integrity is the driving factor this market.
                  • detect environmental hazards is the driving factor this market.
                  • and respond rapidly to emergency situations is the driving factor this market.
                  • enhancing overall safety and environmental stewardship. Therefore is the driving factor this market.
                  • the increasing adoption of digital technologies to enhance operational efficiency and productivity is expected to drive the growth of the global IT spending in oil and gas industry market during the forecast period. is the driving factor this market.

                  The It Spending In Oil And Gas Industry market vendors should focus on grabbing business opportunities from the Hardware segment as it accounted for the largest market share in the base year.