Isobutyl Benzene Market Analysis, Size, and Forecast 2026-2030: APAC (China, Japan, and India), Europe (Germany, UK, and France), North America (US, Canada, and Mexico), Middle East and Africa (Saudi Arabia, UAE, and South Africa), South America (Brazil, Argentina, and Colombia), and Rest of World (ROW)

Isobutyl Benzene Market Analysis, Size, and Forecast 2026-2030:
APAC (China, Japan, and India), Europe (Germany, UK, and France), North America (US, Canada, and Mexico), Middle East and Africa (Saudi Arabia, UAE, and South Africa), South America (Brazil, Argentina, and Colombia), and Rest of World (ROW)

Published: Dec 2025 299 Pages SKU: IRTNTR45352

Market Overview at a Glance

$22.87 Mn
Market Opportunity
5.6%
CAGR 2025 - 2030
46.2%
APAC Growth
$29.60 Mn
Coating segment 2024

Isobutyl Benzene Market Size 2026-2030

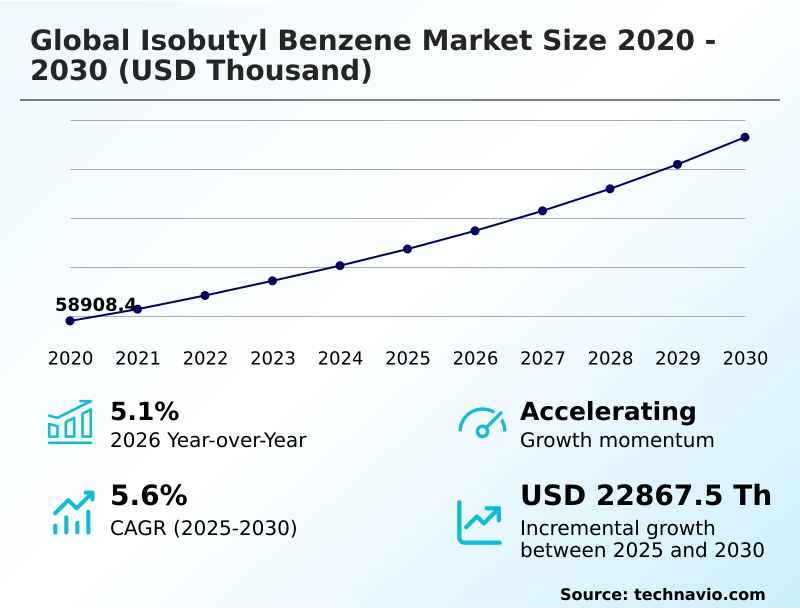
The isobutyl benzene market size is valued to increase by USD 22.87 million, at a CAGR of 5.6% from 2025 to 2030. Increasing demand for ibuprofen will drive the isobutyl benzene market.

Major Market Trends & Insights

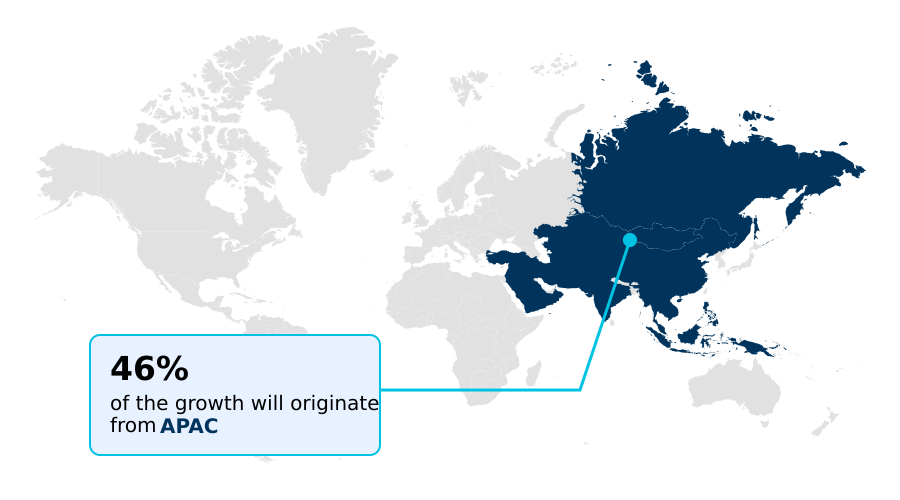
  • APAC dominated the market and accounted for a 46.2% growth during the forecast period.
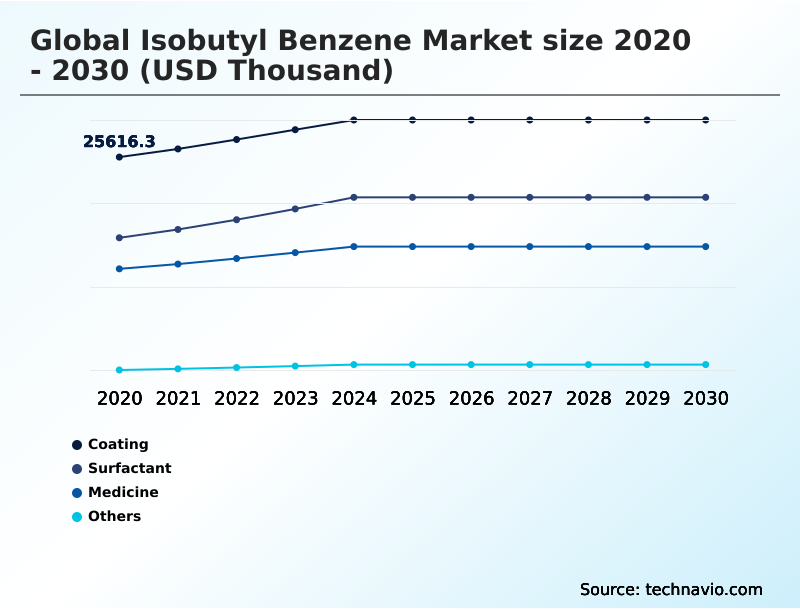
  • By Application - Coating segment was valued at USD 29.60 million in 2024
  • By End-user - Pharmaceuticals segment accounted for the largest market revenue share in 2024

Market Size & Forecast

  • Market Opportunities:
  • Market Future Opportunities: USD 22.87 million
  • CAGR from 2025 to 2030 : 5.6%

Market Summary

  • The isobutyl benzene market is fundamentally tied to the production of essential medicines, serving as a foundational intermediate chemical. This colorless, volatile liquid is synthesized through the alkylation of benzene with isobutylene, a process critical for producing the precursor to ibuprofen, a globally utilized non-steroidal anti-inflammatory drug.
  • Its primary application in pain management and anti-pyretic therapies anchors market demand, making supply chain stability a strategic priority for pharmaceutical manufacturers. Beyond medicine, it finds use in perfumery and surface coatings. A key trend is the backward integration by pharmaceutical firms to secure a stable supply of high-purity pharmaceutical-grade material.
  • For instance, a drug manufacturer might invest in its own catalytic process facility to control the synthesis of 4-isobutylacetophenone, mitigating risks from feedstock cost volatility. However, the market faces challenges from fluctuating crude oil prices, which affect raw material costs, and stringent regulations governing the handling of this volatile organic compound.
  • Growth is driven by the expanding global need for analgesics, particularly in emerging economies with rising healthcare access. This dynamic necessitates continuous innovation in production to enhance efficiency and meet strict purity standards.

What will be the Size of the Isobutyl Benzene Market during the forecast period?

Get Key Insights on Market Forecast (PDF) Request Free Sample

How is the Isobutyl Benzene Market Segmented?

The isobutyl benzene industry research report provides comprehensive data (region-wise segment analysis), with forecasts and estimates in "USD thousand" for the period 2026-2030, as well as historical data from 2020-2024 for the following segments.

  • Application
    • Coating
    • Surfactant
    • Medicine
    • Others
  • End-user
    • Pharmaceuticals
    • Chemical
    • Textile industry
    • Others
  • Grade type
    • Grade 1
    • Grade 2
    • Grade 3
  • Geography
    • APAC
      • China
      • Japan
      • India
    • Europe
      • Germany
      • UK
      • France
    • North America
      • US
      • Canada
      • Mexico
    • Middle East and Africa
      • Saudi Arabia
      • UAE
      • South Africa
    • South America
      • Brazil
      • Argentina
      • Colombia
    • Rest of World (ROW)

By Application Insights

The coating segment is estimated to witness significant growth during the forecast period.

The coating segment leverages isobutyl benzene as a high-performance solvent and intermediate for industrial paints.

Its properties, derived from the reaction of benzene with isobutylene using acid catalysts, make it a valued coalescing agent in automotive and architectural applications, ensuring film uniformity and enhancing durability.

While it also serves as a precursor for some fragrance chemical synthesis, its primary non-pharmaceutical role is here.

The industry's push toward stricter environmental governance standards for volatile organic compound (VOC) emissions presents a challenge, demanding asset optimization and formulation innovation. Producers focus on operational resilience, balancing performance with compliance.

Optimized use in formulations has been shown to reduce coating defects by more than 10%, a critical factor for high-value finishes. This specialty chemical application remains vital where performance justifies its use.

Request Free Sample

The Coating segment was valued at USD 29.60 million in 2024 and showed a gradual increase during the forecast period.

Request Free Sample

Regional Analysis

APAC is estimated to contribute 46.2% to the growth of the global market during the forecast period.Technavio’s analysts have elaborately explained the regional trends and drivers that shape the market during the forecast period.

See How Isobutyl Benzene Market Demand is Rising in APAC Request Free Sample

The geographic landscape of the isobutyl benzene market is dominated by APAC, which accounts for over 46% of incremental growth and exhibits the fastest expansion rate.

This region, led by India and China, serves as the global manufacturing hub for high-purity isobutyl benzene, driven by cost advantages in petrochemical feedstock and a strong bulk drug production ecosystem.

In contrast, Europe faces de-industrialization risk due to high energy costs, though it remains a key consumer of pharmaceutical-grade material. North America is focused on reinforcing sovereign manufacturing capability and supply chain integrity to reduce import reliance.

Downstream integration is a common strategy across regions to control the organic synthesis value chain. The Middle East is leveraging its feedstock advantage to build out its specialty chemical capacity, representing a nascent but strategic growth area.

Market Dynamics

Our researchers analyzed the data with 2025 as the base year, along with the key drivers, trends, and challenges. A holistic analysis of drivers will help companies refine their marketing strategies to gain a competitive advantage.

  • Strategic planning in the isobutyl benzene market requires a deep understanding of its diverse applications and operational complexities. The primary demand stems from its use in isobutyl benzene for pharmaceutical synthesis, especially as a precursor in the cost-effective ibuprofen synthesis route and its broader role in isobutyl benzene role in NSAID synthesis.
  • The quality of high purity isobutyl benzene applications is paramount here. However, opportunities also exist in isobutyl benzene in fine chemical manufacturing, where it serves as an alkylbenzene sulfonate surfactant precursor or an industrial solvent properties of isobutyl benzene. Managing feedstock costs in production is a central challenge due to the volatility impact on isobutyl benzene price.
  • This has spurred a focus on isobutyl benzene production process efficiency and exploring sustainable isobutyl benzene production methods. Companies are adopting backward integration in isobutyl benzene manufacturing to enhance supply chain resilience for chemical intermediates. Decisions often hinge on iso-butyl benzene purity grade comparison versus cost.
  • Furthermore, regulatory standards for isobutyl benzene handling and concerns over the environmental impact of voc emissions are shaping operational protocols, making expertise in health and safety in chemical handling a competitive differentiator. Optimizing friedel-crafts acylation yield remains a key technical goal. The market's future hinges on balancing these demand drivers for analgesic precursors with manufacturing and compliance pressures.
  • Firms in APAC, which represent over 46% of the market's incremental growth, are leading in balancing these factors.

What are the key market drivers leading to the rise in the adoption of Isobutyl Benzene Industry?

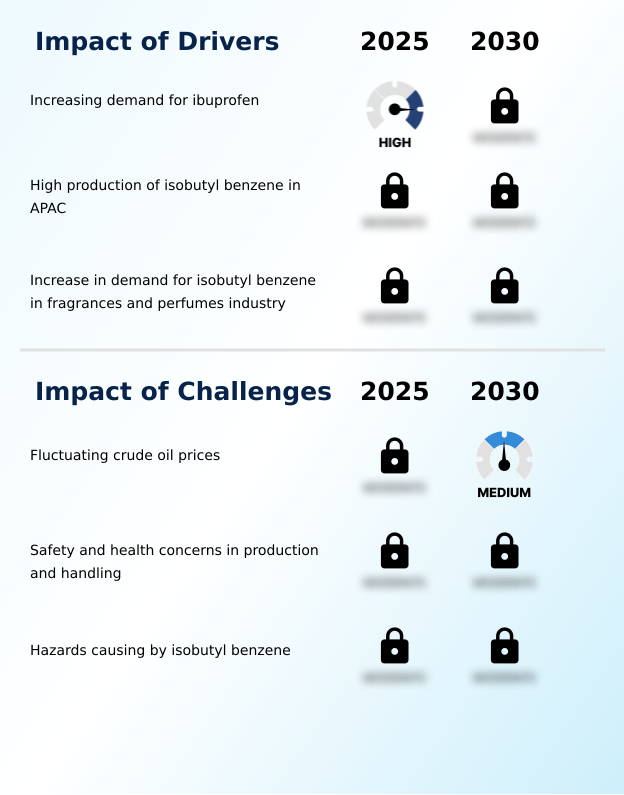
  • The primary market driver is the consistently rising global demand for ibuprofen, for which isobutyl benzene is an essential precursor.

  • Key market drivers include the rising demand for ibuprofen and the strategic consolidation of production in APAC. This region's dominance in bulk drug production offers cost advantages and ensures feedstock security.
  • The synthesis process, involving friedel-crafts acylation to produce 4-isobutylacetophenone, is being optimized by regional players, some of whom have lowered production costs by 15%.
  • Simultaneously, the growing fine chemicals industry is fueling demand for isobutyl benzene in personal care fragrances and household product additives. This diversification mitigates risks from feedstock cost volatility and strengthens supply chain resilience.
  • Adherence to green chemistry principles is also becoming a driver, with sustainable production methods providing a competitive advantage. The dual demand from pharmaceuticals and consumer goods, with the latter growing at nearly 5% annually, provides structural momentum.

What are the market trends shaping the Isobutyl Benzene Industry?

  • The increasing utilization of isobutyl benzene within the pharmaceutical industry stands out as a prominent market trend. This is driven by its critical role in producing essential medicines.

  • A prominent trend is the expanding use of isobutyl benzene as a primary chemical building block in the pharmaceutical sector, particularly for ibuprofen API manufacturing. Its unique alkylbenzene structure makes it an indispensable specialty chemical for producing active pharmaceutical ingredients (APIs).
  • The rising demand for analgesic medications and over-the-counter drug synthesis, driven by aging populations and self-medication practices, underpins this trend. Leading manufacturers are reporting efficiency gains of up to 12% through process enhancements aimed at this segment. Consequently, the production of generic medicines production and various pain management formulations relies heavily on a stable supply of these aromatic intermediates.
  • This deep integration into the pharmaceutical value chain is solidifying the market's growth trajectory, with API-related consumption accounting for over 70% of total volume.

What challenges does the Isobutyl Benzene Industry face during its growth?

  • The persistent fluctuation in crude oil prices presents a key challenge, directly impacting feedstock costs and market stability.

  • The market faces significant challenges, primarily from feedstock price volatility and stringent safety regulations. As an aromatic hydrocarbon, isobutyl benzene production via alkylation of benzene is directly impacted by crude oil price swings, which can increase production costs by over 20% in volatile periods. Ensuring safety in handling this mono-alkyl benzene, a key ibuprofen synthesis intermediate, elevates operational expenses.
  • Strict regulatory compliance standards for this non-steroidal anti-inflammatory drug precursor require significant investment in safety infrastructure, acting as a barrier to capacity expansion. This pressure is driving firms toward process optimization and sustainable sourcing to mitigate risks. However, achieving cost-effective compliance remains a hurdle, with safety-related expenses constituting up to 10% of operational budgets for some producers.

Exclusive Technavio Analysis on Customer Landscape

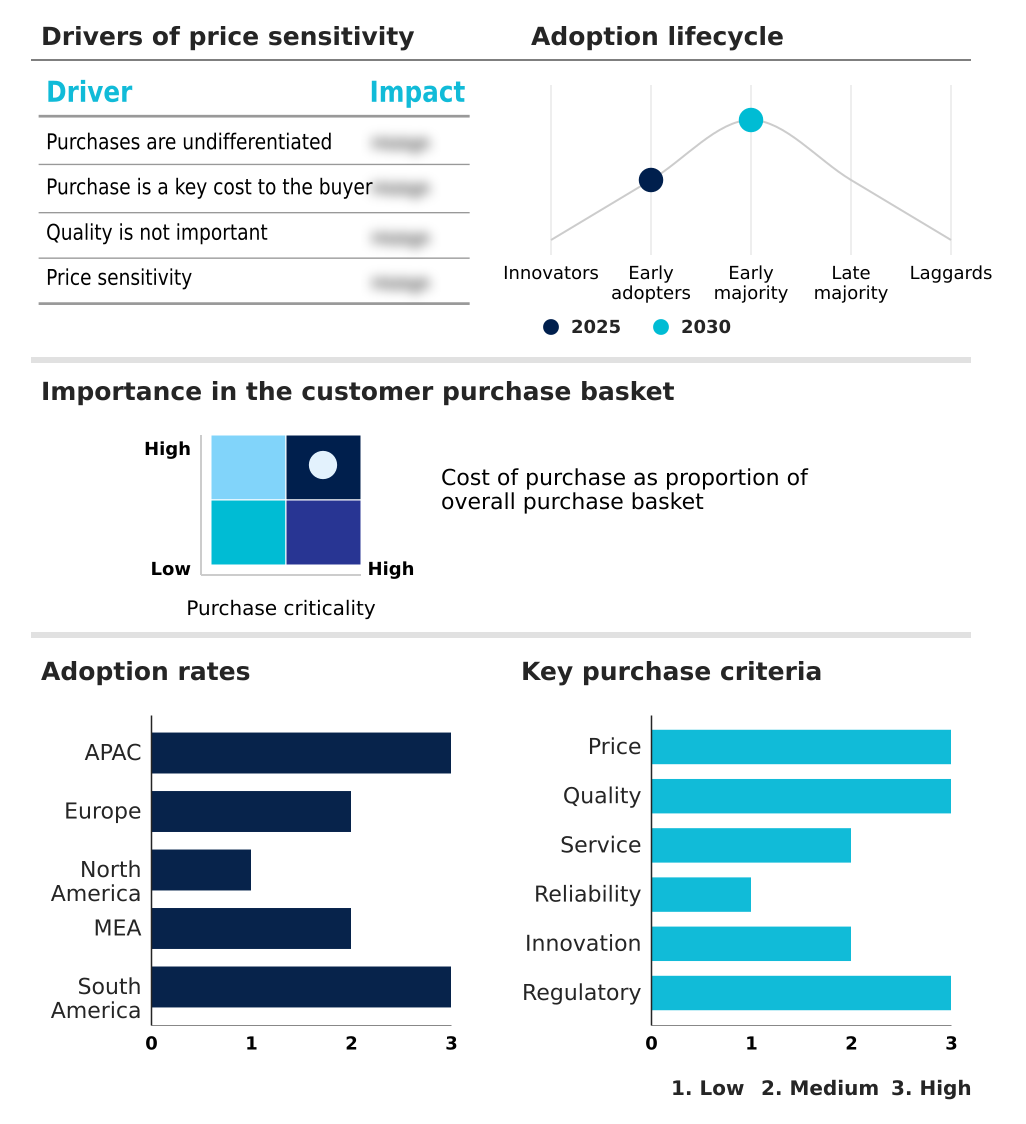
The isobutyl benzene market forecasting report includes the adoption lifecycle of the market, covering from the innovator’s stage to the laggard’s stage. It focuses on adoption rates in different regions based on penetration. Furthermore, the isobutyl benzene market report also includes key purchase criteria and drivers of price sensitivity to help companies evaluate and develop their market growth analysis strategies.

Customer Landscape of Isobutyl Benzene Industry

Competitive Landscape

Companies are implementing various strategies, such as strategic alliances, isobutyl benzene market forecast, partnerships, mergers and acquisitions, geographical expansion, and product/service launches, to enhance their presence in the industry.

Alfa Chemistry - Analysis indicates a focus on providing high-purity isobutyl benzene and related specialty chemical intermediates for pharmaceutical synthesis and industrial applications, emphasizing consistent quality and supply reliability.

The industry research and growth report includes detailed analyses of the competitive landscape of the market and information about key companies, including:

  • Alfa Chemistry
  • Alpha Chemika
  • BASF SE
  • Elchemy
  • INEOS Group Holdings S.A.
  • IOL Chemicals and Pharma Ltd.
  • LGC Ltd.
  • Loba Chemie Pvt. Ltd.
  • Merck and Co. Inc.
  • Otto Chemie Pvt. Ltd.
  • Ralington Pharma LLP
  • S D Fine Chem Ltd.
  • Shandong Xinhua Pharma Ltd.
  • SI Group Inc.
  • Sinopec Shanghai Co. Ltd.
  • Thermo Fisher Scientific Inc.
  • Tokyo Chemical Co. Ltd.
  • Vinati Organics Ltd.
  • Vizag Chemical International

Qualitative and quantitative analysis of companies has been conducted to help clients understand the wider business environment as well as the strengths and weaknesses of key industry players. Data is qualitatively analyzed to categorize companies as pure play, category-focused, industry-focused, and diversified; it is quantitatively analyzed to categorize companies as dominant, leading, strong, tentative, and weak.

Recent Development and News in Isobutyl benzene market

  • In September 2024, SI Group announced its intention to cease manufacturing operations at its production facility in Singapore to optimize its global footprint in response to changing market economics.
  • In September 2025, Mangalore Refinery and Petrochemicals Limited (MRPL) announced it is setting up a 200 TPA pilot demo plant for isobutyl benzene using a patented in-house synthesis route.
  • In April 2025, IOL Chemicals and Pharmaceuticals Limited received approval from China's Center for Drug Evaluation to export its ibuprofen API to the Chinese market, opening a significant new consumer base.
  • In May 2025, Vinati Organics Ltd. reported that its isobutyl benzene volumes declined by approximately 27% in fiscal year 2025 compared to fiscal year 2024, signaling global demand-side challenges.

Dive into Technavio’s robust research methodology, blending expert interviews, extensive data synthesis, and validated models for unparalleled Isobutyl Benzene Market insights. See full methodology.

Market Scope
Page number 299
Base year 2025
Historic period 2020-2024
Forecast period 2026-2030
Growth momentum & CAGR Accelerate at a CAGR of 5.6%
Market growth 2026-2030 USD 22867.5 thousand
Market structure Fragmented
YoY growth 2025-2026(%) 5.1%
Key countries China, Japan, India, South Korea, Australia, Indonesia, Germany, UK, France, Italy, The Netherlands, Spain, US, Canada, Mexico, Saudi Arabia, UAE, South Africa, Israel, Turkey, Brazil, Argentina and Colombia
Competitive landscape Leading Companies, Market Positioning of Companies, Competitive Strategies, and Industry Risks

Request Free Sample

Research Analyst Overview

  • The isobutyl benzene market is defined by its critical role as an ibuprofen synthesis intermediate and a versatile chemical building block in organic synthesis. The core manufacturing route involves the alkylation of benzene with isobutylene using acid catalysts in a catalytic process known as friedel-crafts acylation, yielding 4-isobutylacetophenone.
  • This mono-alkyl benzene serves as a key non-steroidal anti-inflammatory drug precursor, with demand for pharmaceutical-grade material driving production standards. Its alkylbenzene structure also makes it a valuable specialty chemical for producing aromatic intermediates and fragrance chemical compounds. Major producers are focusing on feedstock security for this vital petrochemical feedstock to ensure stable bulk drug production.
  • A key strategic consideration is the shift towards green chemistry to manage the lifecycle of this aromatic hydrocarbon, which is classified as a volatile organic compound. Firms successfully integrating sustainable practices have reported a 15% improvement in resource efficiency. The market's health is inextricably linked to the supply chain for active pharmaceutical ingredients, where high-purity inputs are non-negotiable.

What are the Key Data Covered in this Isobutyl Benzene Market Research and Growth Report?

  • What is the expected growth of the Isobutyl Benzene Market between 2026 and 2030?

    • USD 22.87 million, at a CAGR of 5.6%

  • What segmentation does the market report cover?

    • The report is segmented by Application (Coating, Surfactant, Medicine, and Others), End-user (Pharmaceuticals, Chemical, Textile industry, and Others), Grade Type (Grade 1, Grade 2, and Grade 3) and Geography (APAC, Europe, North America, Middle East and Africa, South America)

  • Which regions are analyzed in the report?

    • APAC, Europe, North America, Middle East and Africa and South America

  • What are the key growth drivers and market challenges?

    • Increasing demand for ibuprofen, Fluctuating crude oil prices

  • Who are the major players in the Isobutyl Benzene Market?

    • Alfa Chemistry, Alpha Chemika, BASF SE, Elchemy, INEOS Group Holdings S.A., IOL Chemicals and Pharma Ltd., LGC Ltd., Loba Chemie Pvt. Ltd., Merck and Co. Inc., Otto Chemie Pvt. Ltd., Ralington Pharma LLP, S D Fine Chem Ltd., Shandong Xinhua Pharma Ltd., SI Group Inc., Sinopec Shanghai Co. Ltd., Thermo Fisher Scientific Inc., Tokyo Chemical Co. Ltd., Vinati Organics Ltd. and Vizag Chemical International

Market Research Insights

  • The isobutyl benzene market is shaped by intense competitive dynamics and a focus on operational resilience. With high price sensitivity among buyers, producers face pressure to implement cost containment initiatives, as procurement is a key cost for downstream users. This is compounded by the high capex and labor required for production, making asset optimization critical.
  • Strategies like backward integration and downstream integration are increasingly common, with some firms achieving a 15% reduction in supply chain costs. While de-industrialization risk looms in high-cost regions, the push for sovereign manufacturing capability in others creates new opportunities. Companies that master process optimization and secure supply chain integrity are better positioned.
  • The market sees a 20% higher investment in facilities compliant with stringent environmental governance standards, reflecting a shift toward long-term sustainability.

We can help! Our analysts can customize this isobutyl benzene market research report to meet your requirements.

Get in touch

1. Executive Summary

1.1 Market overview

Executive Summary - Chart on Market Overview
Executive Summary - Data Table on Market Overview
Executive Summary - Chart on Global Market Characteristics
Executive Summary - Chart on Market by Geography
Executive Summary - Chart on Market Segmentation by Application
Executive Summary - Chart on Market Segmentation by End-user
Executive Summary - Chart on Market Segmentation by Grade Type
Executive Summary - Chart on Incremental Growth
Executive Summary - Data Table on Incremental Growth
Executive Summary - Chart on Company Market Positioning

2. Technavio Analysis

2.1 Analysis of price sensitivity, lifecycle, customer purchase basket, adoption rates, and purchase criteria

2.2 Criticality of inputs and Factors of differentiation

Chart on Overview on criticality of inputs and factors of differentiation

2.3 Factors of disruption

Chart on Overview on factors of disruption

2.4 Impact of drivers and challenges

Chart on Impact of drivers and challenges in 2025 and 2030

3. Market Landscape

3.1 Market ecosystem

Chart on Parent Market
Data Table on - Parent Market

3.2 Market characteristics

Chart on Market characteristics analysis

3.3 Value chain analysis

Chart on Value chain analysis

4. Market Sizing

4.1 Market definition

Data Table on Offerings of companies included in the market definition

4.2 Market segment analysis

Market segments

4.3 Market size 2025

4.4 Market outlook: Forecast for 2025-2030

Chart on Global - Market size and forecast 2025-2030 ($ thousand)
Data Table on Global - Market size and forecast 2025-2030 ($ thousand)
Chart on Global Market: Year-over-year growth 2025-2030 (%)
Data Table on Global Market: Year-over-year growth 2025-2030 (%)

5. Historic Market Size

5.1 Global Isobutyl Benzene Market 2020 - 2024

Historic Market Size - Data Table on Global Isobutyl Benzene Market 2020 - 2024 ($ thousand)

5.2 Application segment analysis 2020 - 2024

Historic Market Size - Application Segment 2020 - 2024 ($ thousand)

5.3 End-user segment analysis 2020 - 2024

Historic Market Size - End-user Segment 2020 - 2024 ($ thousand)

5.4 Grade Type segment analysis 2020 - 2024

Historic Market Size - Grade Type Segment 2020 - 2024 ($ thousand)

5.5 Geography segment analysis 2020 - 2024

Historic Market Size - Geography Segment 2020 - 2024 ($ thousand)

5.6 Country segment analysis 2020 - 2024

Historic Market Size - Country Segment 2020 - 2024 ($ thousand)

6. Qualitative Analysis

6.1 The AI impact on Global Isobutyl Benzene Market

7. Five Forces Analysis

7.1 Five forces summary

Five forces analysis - Comparison between 2025 and 2030

7.2 Bargaining power of buyers

Bargaining power of buyers - Impact of key factors 2025 and 2030

7.3 Bargaining power of suppliers

Bargaining power of suppliers - Impact of key factors in 2025 and 2030

7.4 Threat of new entrants

Threat of new entrants - Impact of key factors in 2025 and 2030

7.5 Threat of substitutes

Threat of substitutes - Impact of key factors in 2025 and 2030

7.6 Threat of rivalry

Threat of rivalry - Impact of key factors in 2025 and 2030

7.7 Market condition

Chart on Market condition - Five forces 2025 and 2030

8. Market Segmentation by Application

8.1 Market segments

Chart on Application - Market share 2025-2030 (%)
Data Table on Application - Market share 2025-2030 (%)

8.2 Comparison by Application

Chart on Comparison by Application
Data Table on Comparison by Application

8.3 Coating - Market size and forecast 2025-2030

Chart on Coating - Market size and forecast 2025-2030 ($ thousand)
Data Table on Coating - Market size and forecast 2025-2030 ($ thousand)
Chart on Coating - Year-over-year growth 2025-2030 (%)
Data Table on Coating - Year-over-year growth 2025-2030 (%)

8.4 Surfactant - Market size and forecast 2025-2030

Chart on Surfactant - Market size and forecast 2025-2030 ($ thousand)
Data Table on Surfactant - Market size and forecast 2025-2030 ($ thousand)
Chart on Surfactant - Year-over-year growth 2025-2030 (%)
Data Table on Surfactant - Year-over-year growth 2025-2030 (%)

8.5 Medicine - Market size and forecast 2025-2030

Chart on Medicine - Market size and forecast 2025-2030 ($ thousand)
Data Table on Medicine - Market size and forecast 2025-2030 ($ thousand)
Chart on Medicine - Year-over-year growth 2025-2030 (%)
Data Table on Medicine - Year-over-year growth 2025-2030 (%)

8.6 Others - Market size and forecast 2025-2030

Chart on Others - Market size and forecast 2025-2030 ($ thousand)
Data Table on Others - Market size and forecast 2025-2030 ($ thousand)
Chart on Others - Year-over-year growth 2025-2030 (%)
Data Table on Others - Year-over-year growth 2025-2030 (%)

8.7 Market opportunity by Application

Market opportunity by Application ($ thousand)
Data Table on Market opportunity by Application ($ thousand)

9. Market Segmentation by End-user

9.1 Market segments

Chart on End-user - Market share 2025-2030 (%)
Data Table on End-user - Market share 2025-2030 (%)

9.2 Comparison by End-user

Chart on Comparison by End-user
Data Table on Comparison by End-user

9.3 Pharmaceuticals - Market size and forecast 2025-2030

Chart on Pharmaceuticals - Market size and forecast 2025-2030 ($ thousand)
Data Table on Pharmaceuticals - Market size and forecast 2025-2030 ($ thousand)
Chart on Pharmaceuticals - Year-over-year growth 2025-2030 (%)
Data Table on Pharmaceuticals - Year-over-year growth 2025-2030 (%)

9.4 Chemical - Market size and forecast 2025-2030

Chart on Chemical - Market size and forecast 2025-2030 ($ thousand)
Data Table on Chemical - Market size and forecast 2025-2030 ($ thousand)
Chart on Chemical - Year-over-year growth 2025-2030 (%)
Data Table on Chemical - Year-over-year growth 2025-2030 (%)

9.5 Textile industry - Market size and forecast 2025-2030

Chart on Textile industry - Market size and forecast 2025-2030 ($ thousand)
Data Table on Textile industry - Market size and forecast 2025-2030 ($ thousand)
Chart on Textile industry - Year-over-year growth 2025-2030 (%)
Data Table on Textile industry - Year-over-year growth 2025-2030 (%)

9.6 Others - Market size and forecast 2025-2030

Chart on Others - Market size and forecast 2025-2030 ($ thousand)
Data Table on Others - Market size and forecast 2025-2030 ($ thousand)
Chart on Others - Year-over-year growth 2025-2030 (%)
Data Table on Others - Year-over-year growth 2025-2030 (%)

9.7 Market opportunity by End-user

Market opportunity by End-user ($ thousand)
Data Table on Market opportunity by End-user ($ thousand)

10. Market Segmentation by Grade Type

10.1 Market segments

Chart on Grade Type - Market share 2025-2030 (%)
Data Table on Grade Type - Market share 2025-2030 (%)

10.2 Comparison by Grade Type

Chart on Comparison by Grade Type
Data Table on Comparison by Grade Type

10.3 Grade 1 - Market size and forecast 2025-2030

Chart on Grade 1 - Market size and forecast 2025-2030 ($ thousand)
Data Table on Grade 1 - Market size and forecast 2025-2030 ($ thousand)
Chart on Grade 1 - Year-over-year growth 2025-2030 (%)
Data Table on Grade 1 - Year-over-year growth 2025-2030 (%)

10.4 Grade 2 - Market size and forecast 2025-2030

Chart on Grade 2 - Market size and forecast 2025-2030 ($ thousand)
Data Table on Grade 2 - Market size and forecast 2025-2030 ($ thousand)
Chart on Grade 2 - Year-over-year growth 2025-2030 (%)
Data Table on Grade 2 - Year-over-year growth 2025-2030 (%)

10.5 Grade 3 - Market size and forecast 2025-2030

Chart on Grade 3 - Market size and forecast 2025-2030 ($ thousand)
Data Table on Grade 3 - Market size and forecast 2025-2030 ($ thousand)
Chart on Grade 3 - Year-over-year growth 2025-2030 (%)
Data Table on Grade 3 - Year-over-year growth 2025-2030 (%)

10.6 Market opportunity by Grade Type

Market opportunity by Grade Type ($ thousand)
Data Table on Market opportunity by Grade Type ($ thousand)

11. Customer Landscape

11.1 Customer landscape overview

Analysis of price sensitivity, lifecycle, customer purchase basket, adoption rates, and purchase criteria

12. Geographic Landscape

12.1 Geographic segmentation

Chart on Market share by geography 2025-2030 (%)
Data Table on Market share by geography 2025-2030 (%)

12.2 Geographic comparison

Chart on Geographic comparison
Data Table on Geographic comparison

12.3 APAC - Market size and forecast 2025-2030

Chart on APAC - Market size and forecast 2025-2030 ($ thousand)
Data Table on APAC - Market size and forecast 2025-2030 ($ thousand)
Chart on APAC - Year-over-year growth 2025-2030 (%)
Data Table on APAC - Year-over-year growth 2025-2030 (%)
Chart on Regional Comparison - APAC
Data Table on Regional Comparison - APAC

12.3.1 China - Market size and forecast 2025-2030

Chart on China - Market size and forecast 2025-2030 ($ thousand)
Data Table on China - Market size and forecast 2025-2030 ($ thousand)
Chart on China - Year-over-year growth 2025-2030 (%)
Data Table on China - Year-over-year growth 2025-2030 (%)

12.3.2 Japan - Market size and forecast 2025-2030

Chart on Japan - Market size and forecast 2025-2030 ($ thousand)
Data Table on Japan - Market size and forecast 2025-2030 ($ thousand)
Chart on Japan - Year-over-year growth 2025-2030 (%)
Data Table on Japan - Year-over-year growth 2025-2030 (%)

12.3.3 India - Market size and forecast 2025-2030

Chart on India - Market size and forecast 2025-2030 ($ thousand)
Data Table on India - Market size and forecast 2025-2030 ($ thousand)
Chart on India - Year-over-year growth 2025-2030 (%)
Data Table on India - Year-over-year growth 2025-2030 (%)

12.3.4 South Korea - Market size and forecast 2025-2030

Chart on South Korea - Market size and forecast 2025-2030 ($ thousand)
Data Table on South Korea - Market size and forecast 2025-2030 ($ thousand)
Chart on South Korea - Year-over-year growth 2025-2030 (%)
Data Table on South Korea - Year-over-year growth 2025-2030 (%)

12.3.5 Australia - Market size and forecast 2025-2030

Chart on Australia - Market size and forecast 2025-2030 ($ thousand)
Data Table on Australia - Market size and forecast 2025-2030 ($ thousand)
Chart on Australia - Year-over-year growth 2025-2030 (%)
Data Table on Australia - Year-over-year growth 2025-2030 (%)

12.3.6 Indonesia - Market size and forecast 2025-2030

Chart on Indonesia - Market size and forecast 2025-2030 ($ thousand)
Data Table on Indonesia - Market size and forecast 2025-2030 ($ thousand)
Chart on Indonesia - Year-over-year growth 2025-2030 (%)
Data Table on Indonesia - Year-over-year growth 2025-2030 (%)

12.4 Europe - Market size and forecast 2025-2030

Chart on Europe - Market size and forecast 2025-2030 ($ thousand)
Data Table on Europe - Market size and forecast 2025-2030 ($ thousand)
Chart on Europe - Year-over-year growth 2025-2030 (%)
Data Table on Europe - Year-over-year growth 2025-2030 (%)
Chart on Regional Comparison - Europe
Data Table on Regional Comparison - Europe

12.4.1 Germany - Market size and forecast 2025-2030

Chart on Germany - Market size and forecast 2025-2030 ($ thousand)
Data Table on Germany - Market size and forecast 2025-2030 ($ thousand)
Chart on Germany - Year-over-year growth 2025-2030 (%)
Data Table on Germany - Year-over-year growth 2025-2030 (%)

12.4.2 UK - Market size and forecast 2025-2030

Chart on UK - Market size and forecast 2025-2030 ($ thousand)
Data Table on UK - Market size and forecast 2025-2030 ($ thousand)
Chart on UK - Year-over-year growth 2025-2030 (%)
Data Table on UK - Year-over-year growth 2025-2030 (%)

12.4.3 France - Market size and forecast 2025-2030

Chart on France - Market size and forecast 2025-2030 ($ thousand)
Data Table on France - Market size and forecast 2025-2030 ($ thousand)
Chart on France - Year-over-year growth 2025-2030 (%)
Data Table on France - Year-over-year growth 2025-2030 (%)

12.4.4 Italy - Market size and forecast 2025-2030

Chart on Italy - Market size and forecast 2025-2030 ($ thousand)
Data Table on Italy - Market size and forecast 2025-2030 ($ thousand)
Chart on Italy - Year-over-year growth 2025-2030 (%)
Data Table on Italy - Year-over-year growth 2025-2030 (%)

12.4.5 The Netherlands - Market size and forecast 2025-2030

Chart on The Netherlands - Market size and forecast 2025-2030 ($ thousand)
Data Table on The Netherlands - Market size and forecast 2025-2030 ($ thousand)
Chart on The Netherlands - Year-over-year growth 2025-2030 (%)
Data Table on The Netherlands - Year-over-year growth 2025-2030 (%)

12.4.6 Spain - Market size and forecast 2025-2030

Chart on Spain - Market size and forecast 2025-2030 ($ thousand)
Data Table on Spain - Market size and forecast 2025-2030 ($ thousand)
Chart on Spain - Year-over-year growth 2025-2030 (%)
Data Table on Spain - Year-over-year growth 2025-2030 (%)

12.5 North America - Market size and forecast 2025-2030

Chart on North America - Market size and forecast 2025-2030 ($ thousand)
Data Table on North America - Market size and forecast 2025-2030 ($ thousand)
Chart on North America - Year-over-year growth 2025-2030 (%)
Data Table on North America - Year-over-year growth 2025-2030 (%)
Chart on Regional Comparison - North America
Data Table on Regional Comparison - North America

12.5.1 US - Market size and forecast 2025-2030

Chart on US - Market size and forecast 2025-2030 ($ thousand)
Data Table on US - Market size and forecast 2025-2030 ($ thousand)
Chart on US - Year-over-year growth 2025-2030 (%)
Data Table on US - Year-over-year growth 2025-2030 (%)

12.5.2 Canada - Market size and forecast 2025-2030

Chart on Canada - Market size and forecast 2025-2030 ($ thousand)
Data Table on Canada - Market size and forecast 2025-2030 ($ thousand)
Chart on Canada - Year-over-year growth 2025-2030 (%)
Data Table on Canada - Year-over-year growth 2025-2030 (%)

12.5.3 Mexico - Market size and forecast 2025-2030

Chart on Mexico - Market size and forecast 2025-2030 ($ thousand)
Data Table on Mexico - Market size and forecast 2025-2030 ($ thousand)
Chart on Mexico - Year-over-year growth 2025-2030 (%)
Data Table on Mexico - Year-over-year growth 2025-2030 (%)

12.6 Middle East and Africa - Market size and forecast 2025-2030

Chart on Middle East and Africa - Market size and forecast 2025-2030 ($ thousand)
Data Table on Middle East and Africa - Market size and forecast 2025-2030 ($ thousand)
Chart on Middle East and Africa - Year-over-year growth 2025-2030 (%)
Data Table on Middle East and Africa - Year-over-year growth 2025-2030 (%)
Chart on Regional Comparison - Middle East and Africa
Data Table on Regional Comparison - Middle East and Africa

12.6.1 Saudi Arabia - Market size and forecast 2025-2030

Chart on Saudi Arabia - Market size and forecast 2025-2030 ($ thousand)
Data Table on Saudi Arabia - Market size and forecast 2025-2030 ($ thousand)
Chart on Saudi Arabia - Year-over-year growth 2025-2030 (%)
Data Table on Saudi Arabia - Year-over-year growth 2025-2030 (%)

12.6.2 UAE - Market size and forecast 2025-2030

Chart on UAE - Market size and forecast 2025-2030 ($ thousand)
Data Table on UAE - Market size and forecast 2025-2030 ($ thousand)
Chart on UAE - Year-over-year growth 2025-2030 (%)
Data Table on UAE - Year-over-year growth 2025-2030 (%)

12.6.3 South Africa - Market size and forecast 2025-2030

Chart on South Africa - Market size and forecast 2025-2030 ($ thousand)
Data Table on South Africa - Market size and forecast 2025-2030 ($ thousand)
Chart on South Africa - Year-over-year growth 2025-2030 (%)
Data Table on South Africa - Year-over-year growth 2025-2030 (%)

12.6.4 Israel - Market size and forecast 2025-2030

Chart on Israel - Market size and forecast 2025-2030 ($ thousand)
Data Table on Israel - Market size and forecast 2025-2030 ($ thousand)
Chart on Israel - Year-over-year growth 2025-2030 (%)
Data Table on Israel - Year-over-year growth 2025-2030 (%)

12.6.5 Turkey - Market size and forecast 2025-2030

Chart on Turkey - Market size and forecast 2025-2030 ($ thousand)
Data Table on Turkey - Market size and forecast 2025-2030 ($ thousand)
Chart on Turkey - Year-over-year growth 2025-2030 (%)
Data Table on Turkey - Year-over-year growth 2025-2030 (%)

12.7 South America - Market size and forecast 2025-2030

Chart on South America - Market size and forecast 2025-2030 ($ thousand)
Data Table on South America - Market size and forecast 2025-2030 ($ thousand)
Chart on South America - Year-over-year growth 2025-2030 (%)
Data Table on South America - Year-over-year growth 2025-2030 (%)
Chart on Regional Comparison - South America
Data Table on Regional Comparison - South America

12.7.1 Brazil - Market size and forecast 2025-2030

Chart on Brazil - Market size and forecast 2025-2030 ($ thousand)
Data Table on Brazil - Market size and forecast 2025-2030 ($ thousand)
Chart on Brazil - Year-over-year growth 2025-2030 (%)
Data Table on Brazil - Year-over-year growth 2025-2030 (%)

12.7.2 Argentina - Market size and forecast 2025-2030

Chart on Argentina - Market size and forecast 2025-2030 ($ thousand)
Data Table on Argentina - Market size and forecast 2025-2030 ($ thousand)
Chart on Argentina - Year-over-year growth 2025-2030 (%)
Data Table on Argentina - Year-over-year growth 2025-2030 (%)

12.7.3 Colombia - Market size and forecast 2025-2030

Chart on Colombia - Market size and forecast 2025-2030 ($ thousand)
Data Table on Colombia - Market size and forecast 2025-2030 ($ thousand)
Chart on Colombia - Year-over-year growth 2025-2030 (%)
Data Table on Colombia - Year-over-year growth 2025-2030 (%)

12.8 Market opportunity by geography

Market opportunity by geography ($ thousand)
Data Tables on Market opportunity by geography ($ thousand)

13. Drivers, Challenges, and Opportunity

13.1 Market drivers

Increasing demand for ibuprofen
High production of isobutyl benzene in APAC
Increase in demand for isobutyl benzene in fragrances and perfumes industry

13.2 Market challenges

Fluctuating crude oil prices
Safety and health concerns in production and handling
Hazards causing by isobutyl benzene

13.3 Impact of drivers and challenges

Impact of drivers and challenges in 2025 and 2030

13.4 Market opportunities

Increase in use of isobutyl benzene in pharmaceutical industry
Capacity expansion of isobutyl benzene facilities
Increasing cases of migraine fueling demand for ibuprofen

14. Competitive Landscape

14.1 Overview

14.2

Overview on criticality of inputs and factors of differentiation

14.3 Landscape disruption

Overview on factors of disruption

14.4 Industry risks

Impact of key risks on business

15. Competitive Analysis

15.1 Companies profiled

Companies covered

15.2 Company ranking index

15.3 Market positioning of companies

Matrix on companies position and classification

15.4 Alfa Chemistry

Alfa Chemistry - Overview
Alfa Chemistry - Product / Service
Alfa Chemistry - Key offerings
SWOT

15.5 Alpha Chemika

Alpha Chemika - Overview
Alpha Chemika - Product / Service
Alpha Chemika - Key offerings
SWOT

15.6 Elchemy

Elchemy - Overview
Elchemy - Product / Service
Elchemy - Key offerings
SWOT

15.7 INEOS Group Holdings S.A.

INEOS Group Holdings S.A. - Overview
INEOS Group Holdings S.A. - Product / Service
INEOS Group Holdings S.A. - Key news
INEOS Group Holdings S.A. - Key offerings
SWOT

15.8 IOL Chemicals and Pharma Ltd.

IOL Chemicals and Pharma Ltd. - Overview
IOL Chemicals and Pharma Ltd. - Business segments
IOL Chemicals and Pharma Ltd. - Key offerings
IOL Chemicals and Pharma Ltd. - Segment focus
SWOT

15.9 LGC Ltd.

LGC Ltd. - Overview
LGC Ltd. - Product / Service
LGC Ltd. - Key offerings
SWOT

15.10 Loba Chemie Pvt. Ltd.

Loba Chemie Pvt. Ltd. - Overview
Loba Chemie Pvt. Ltd. - Product / Service
Loba Chemie Pvt. Ltd. - Key offerings
SWOT

15.11 Otto Chemie Pvt. Ltd.

Otto Chemie Pvt. Ltd. - Overview
Otto Chemie Pvt. Ltd. - Product / Service
Otto Chemie Pvt. Ltd. - Key offerings
SWOT

15.12 Ralington Pharma LLP

Ralington Pharma LLP - Overview
Ralington Pharma LLP - Product / Service
Ralington Pharma LLP - Key offerings
SWOT

15.13 Shandong Xinhua Pharma Ltd.

Shandong Xinhua Pharma Ltd. - Overview
Shandong Xinhua Pharma Ltd. - Product / Service
Shandong Xinhua Pharma Ltd. - Key offerings
SWOT

15.14 Sinopec Shanghai Co. Ltd.

Sinopec Shanghai Co. Ltd. - Overview
Sinopec Shanghai Co. Ltd. - Business segments
Sinopec Shanghai Co. Ltd. - Key news
Sinopec Shanghai Co. Ltd. - Key offerings
Sinopec Shanghai Co. Ltd. - Segment focus
SWOT

15.15 Thermo Fisher Scientific Inc.

Thermo Fisher Scientific Inc. - Overview
Thermo Fisher Scientific Inc. - Business segments
Thermo Fisher Scientific Inc. - Key news
Thermo Fisher Scientific Inc. - Key offerings
Thermo Fisher Scientific Inc. - Segment focus
SWOT

15.16 Tokyo Chemical Co. Ltd.

Tokyo Chemical Co. Ltd. - Overview
Tokyo Chemical Co. Ltd. - Product / Service
Tokyo Chemical Co. Ltd. - Key offerings
SWOT

15.17 Vinati Organics Ltd.

Vinati Organics Ltd. - Overview
Vinati Organics Ltd. - Business segments
Vinati Organics Ltd. - Key offerings
Vinati Organics Ltd. - Segment focus
SWOT

15.18 Vizag Chemical International

Vizag Chemical International - Overview
Vizag Chemical International - Product / Service
Vizag Chemical International - Key offerings
SWOT

16. Appendix

16.1 Scope of the report

Market definition
Objectives
Notes and caveats

16.2 Inclusions and exclusions checklist

Inclusions checklist
Exclusions checklist

16.3 Currency conversion rates for US$

16.4 Research methodology

16.5 Data procurement

Information sources

16.6 Data validation

16.7 Validation techniques employed for market sizing

16.8 Data synthesis

16.9 360 degree market analysis

16.10 List of abbreviations

Research Methodology

Technavio presents a detailed picture of the market by way of study, synthesis, and summation of data from multiple sources. The analysts have presented the various facets of the market with a particular focus on identifying the key industry influencers. The data thus presented is comprehensive, reliable, and the result of extensive research, both primary and secondary.

INFORMATION SOURCES

Primary sources

  • Manufacturers and suppliers
  • Channel partners
  • Industry experts
  • Strategic decision makers

Secondary sources

  • Industry journals and periodicals
  • Government data
  • Financial reports of key industry players
  • Historical data
  • Press releases

DATA ANALYSIS

Data Synthesis

  • Collation of data
  • Estimation of key figures
  • Analysis of derived insights

Data Validation

  • Triangulation with data models
  • Reference against proprietary databases
  • Corroboration with industry experts

REPORT WRITING

Qualitative

  • Market drivers
  • Market challenges
  • Market trends
  • Five forces analysis

Quantitative

  • Market size and forecast
  • Market segmentation
  • Geographical insights
  • Competitive landscape

Interested in this report?

Get your sample now to see our research methodology and insights!

Download Now

Frequently Asked Questions

Isobutyl Benzene market growth will increase by USD 22867.5 thousand thousand during 2026-2030.

The Isobutyl Benzene market is expected to grow at a CAGR of 5.6% during 2026-2030.

Isobutyl Benzene market is segmented by Application (Coating, Surfactant, Medicine, Others) End-user (Pharmaceuticals, Chemical, Textile industry, Others) Grade type (Grade 1, Grade 2, Grade 3)

Alfa Chemistry, Alpha Chemika, BASF SE, Elchemy, INEOS Group Holdings S.A., IOL Chemicals and Pharma Ltd., LGC Ltd., Loba Chemie Pvt. Ltd., Merck and Co. Inc., Otto Chemie Pvt. Ltd., Ralington Pharma LLP, S D Fine Chem Ltd., Shandong Xinhua Pharma Ltd., SI Group Inc., Sinopec Shanghai Co. Ltd., Thermo Fisher Scientific Inc., Tokyo Chemical Co. Ltd., Vinati Organics Ltd., Vizag Chemical International are a few of the key vendors in the Isobutyl Benzene market.

APAC will register the highest growth rate of 46.2% among the other regions. Therefore, the Isobutyl Benzene market in APAC is expected to garner significant business opportunities for the vendors during the forecast period.

China, Japan, India, South Korea, Australia, Indonesia, Germany, UK, France, Italy, The Netherlands, Spain, US, Canada, Mexico, Saudi Arabia, UAE, South Africa, Israel, Turkey, Brazil, Argentina, Colombia

  • Increasing demand for ibuprofen is the driving factor this market.

The Isobutyl Benzene market vendors should focus on grabbing business opportunities from the Application segment as it accounted for the largest market share in the base year.