Ion Exchange Membranes Market Analysis, Size, and Forecast 2026-2030: APAC (China, Japan, and India), North America (US, Canada, and Mexico), Europe (Germany, France, and UK), Middle East and Africa (Saudi Arabia, UAE, and South Africa), South America (Brazil and Argentina), and Rest of World (ROW)

Ion Exchange Membranes Market Analysis, Size, and Forecast 2026-2030:
APAC (China, Japan, and India), North America (US, Canada, and Mexico), Europe (Germany, France, and UK), Middle East and Africa (Saudi Arabia, UAE, and South Africa), South America (Brazil and Argentina), and Rest of World (ROW)

Published: Apr 2026 323 Pages SKU: IRTNTR71525

Market Overview at a Glance

$151.88 Mn
Market Opportunity
2.7%
CAGR 2025 - 2030
54.7%
APAC Growth
$353.43 Mn
Hydrocarbon membrane segment 2024

Ion Exchange Membranes Market Size 2026-2030

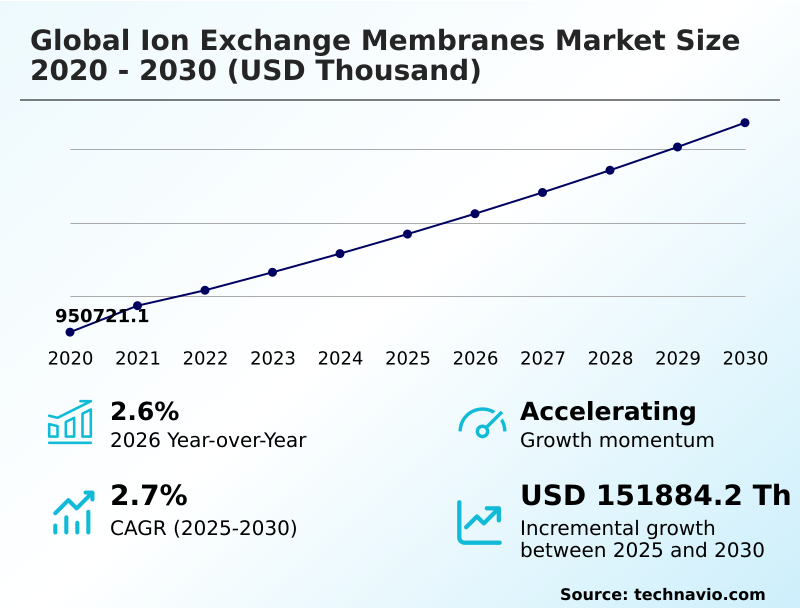
The ion exchange membranes market size is valued to increase by USD 151.88 million, at a CAGR of 2.7% from 2025 to 2030. Rising demand for water treatment and desalination will drive the ion exchange membranes market.

Major Market Trends & Insights

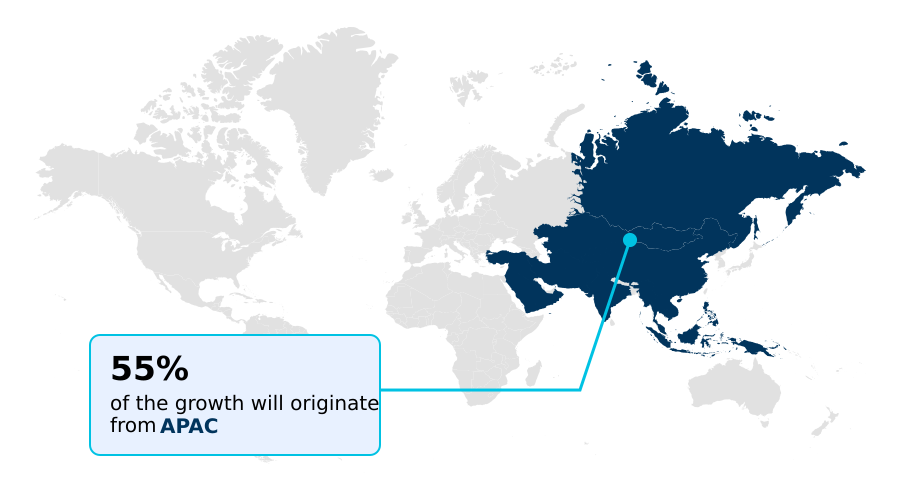
  • APAC dominated the market and accounted for a 54.7% growth during the forecast period.
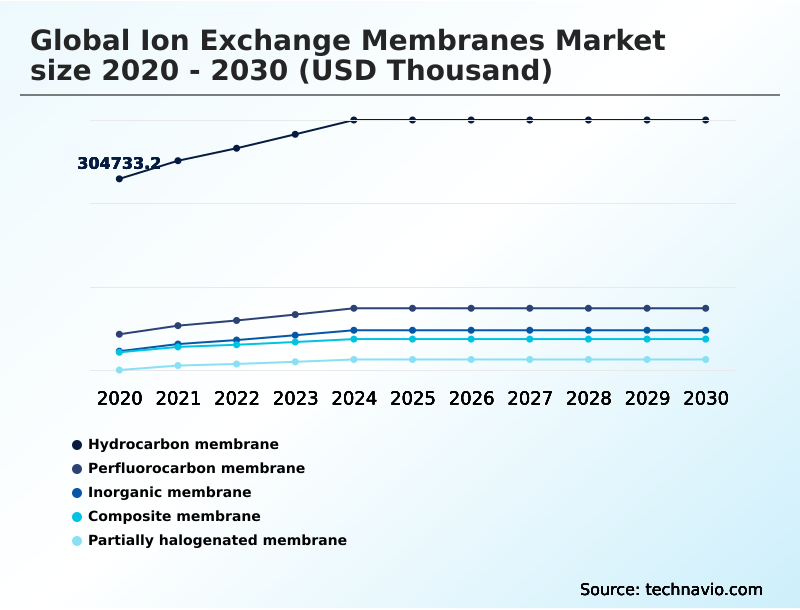
  • By Material - Hydrocarbon membrane segment was valued at USD 353.43 million in 2024
  • By Application - Water treatment segment accounted for the largest market revenue share in 2024

Market Size & Forecast

  • Market Opportunities:
  • Market Future Opportunities: USD 151.88 million
  • CAGR from 2025 to 2030 : 2.7%

Market Summary

  • The ion exchange membranes market is expanding, driven by the critical need for efficient separation technologies in water treatment and clean energy sectors. The demand for ultra-pure water generation in electronics and pharmaceuticals, coupled with the global push for green hydrogen production via water electrolysis, underpins market momentum. Key advancements focus on developing materials with superior ionic conductivity and permselectivity.
  • Innovations in polymer matrix structures, including both hydrocarbon membrane and composite membrane designs, aim to enhance mechanical strength and chemical stability. For instance, a facility implementing advanced membranes for resource recovery from waste can improve ion selectivity by 15%, significantly increasing the purity of reclaimed materials.
  • However, challenges related to fouling resistance and the high cost of materials like perfluorocarbon membrane types persist. The industry is responding with research into more durable and cost-effective ion-conducting polymers, including those with improved sulfonation techniques, to enable broader adoption in applications like redox flow battery systems and electrodialysis, ensuring long-term viability and performance.

What will be the Size of the Ion Exchange Membranes Market during the forecast period?

Get Key Insights on Market Forecast (PDF) Request Free Sample

How is the Ion Exchange Membranes Market Segmented?

The ion exchange membranes industry research report provides comprehensive data (region-wise segment analysis), with forecasts and estimates in "USD thousand" for the period 2026-2030, as well as historical data from 2020-2024 for the following segments.

  • Material
    • Hydrocarbon membrane
    • Perfluorocarbon membrane
    • Inorganic membrane
    • Composite membrane
    • Partially halogenated membrane
  • Application
    • Water treatment
    • Electrolysis
    • Storage batteries
    • Electrodialysis
    • Others
  • Type
    • Cation
    • Anion
    • Amphoteric ion
    • Bipolar ion
    • Mosaic ion
  • Geography
    • APAC
      • China
      • Japan
      • India
    • North America
      • US
      • Canada
      • Mexico
    • Europe
      • Germany
      • France
      • UK
    • Middle East and Africa
      • Saudi Arabia
      • UAE
      • South Africa
    • South America
      • Brazil
      • Argentina
    • Rest of World (ROW)

By Material Insights

The hydrocarbon membrane segment is estimated to witness significant growth during the forecast period.

The hydrocarbon membrane segment is expanding due to demand for cost-effective alternatives to conventional materials. Composed of polyaromatic ion-conducting polymers, these membranes offer balanced performance for water treatment and electrodialysis.

As regulatory scrutiny grows, alternatives like composite membrane and inorganic membrane structures gain traction. Innovations using techniques like cross-linking enhance their chemical stability and permselectivity.

However, long-term durability in highly alkaline environments for applications like water splitting or acid-base production remains a development focus, with some materials showing a 10% improvement in lifespan.

Request Free Sample

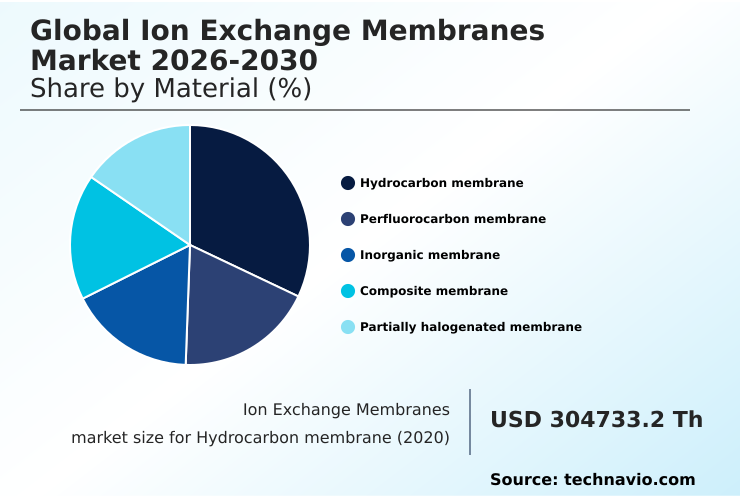
The Hydrocarbon membrane segment was valued at USD 353.43 million in 2024 and showed a gradual increase during the forecast period.

Request Free Sample

Regional Analysis

APAC is estimated to contribute 54.7% to the growth of the global market during the forecast period.Technavio’s analysts have elaborately explained the regional trends and drivers that shape the market during the forecast period.

See How Ion Exchange Membranes Market Demand is Rising in APAC Request Free Sample

APAC commands 54.7% of incremental growth, driven by industrial water treatment. The region's demand for cation exchange membrane and anion exchange membrane technologies is high, especially for the chlor-alkali process and electro-deionization. North America, at 28.78%, focuses on green energy.

Europe emphasizes materials science, improving ionic conductivity in perfluorocarbon membrane types through nanoscale phase separation. Across regions, electrodialysis is adopted for specialized applications, with advancements in monovalent selective ion exchange enabling more precise industrial separations.

Market Dynamics

Our researchers analyzed the data with 2025 as the base year, along with the key drivers, trends, and challenges. A holistic analysis of drivers will help companies refine their marketing strategies to gain a competitive advantage.

  • The strategic implementation of advanced ion exchange membranes is reshaping industrial processes by enabling highly specific and efficient separations. The use of ion exchange membranes for fuel cells, for instance, is fundamental to the clean energy transition, requiring materials with exceptional proton conductivity and durability.
  • Similarly, anion exchange membranes in electrolysis are paving the way for cost-effective green hydrogen by allowing the use of earth-abundant catalysts. In the chemical industry, bipolar membranes for acid-base production are transforming waste streams into valuable commodities, supporting circular economy principles.
  • For large-scale water purification, composite membranes for water treatment offer a blend of high flux and mechanical strength, outperforming older technologies in contaminant removal by a significant margin. The advancement of membranes for redox flow battery systems is also critical for grid-scale energy storage, where membrane stability directly impacts battery longevity.
  • Furthermore, selective membrane technologies for resource recovery are enabling industries to extract valuable materials from complex waste effluents. The push for high-performance membranes for green hydrogen and membranes in chlor-alkali electrolysis process continues to drive materials innovation.
  • Meanwhile, hydrocarbon membranes for electrodialysis applications and perfluorinated membranes for harsh chemical environments cater to specialized industrial needs, demonstrating the technology's versatility and importance.

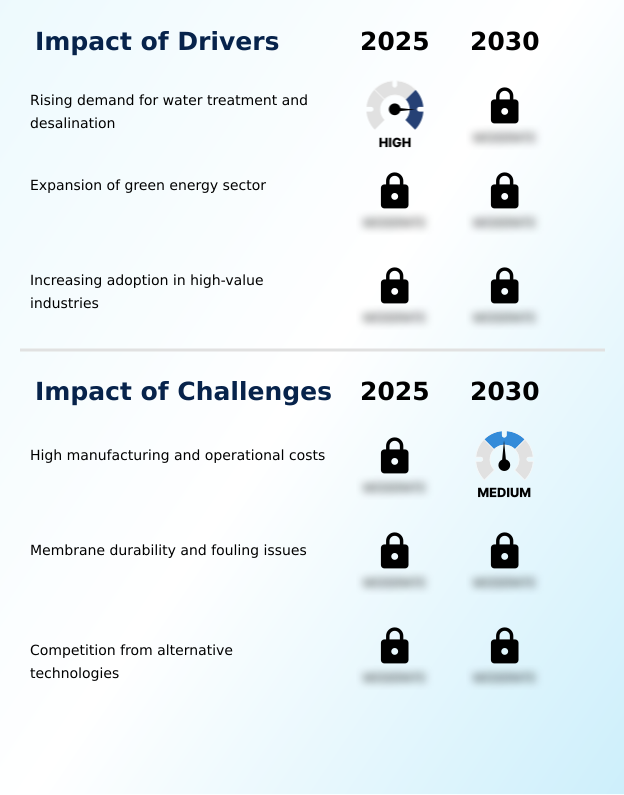
What are the key market drivers leading to the rise in the adoption of Ion Exchange Membranes Industry?

  • The escalating global demand for advanced water treatment and desalination technologies is a primary driver of market expansion.

  • The escalating need for clean water propels demand for advanced purification technologies. Systems for brackish water desalination and ultra-pure water generation are critical, driving adoption.
  • These materials, including proton exchange membrane types, are integral to achieving zero-liquid discharge goals and facilitate efficient demineralization. A push for circularity creates demand for electrochemical separation for resource recovery from waste.
  • In energy, efficient water electrolysis remains a significant driver, with improved ion selectivity in membranes reducing energy consumption by up to 12%.

What are the market trends shaping the Ion Exchange Membranes Industry?

  • An intensified focus on membranes engineered for green hydrogen production and large-scale energy storage solutions is shaping the market's trajectory.

  • A predominant trend is the deployment of membranes engineered for green energy, especially for green hydrogen production and redox flow battery systems where advanced ionomer materials are critical. Innovations in bipolar membrane and mosaic membrane technologies are enabling more efficient water dissociation.
  • In parallel, materials designed as a fuel cell separator or battery separator membrane within a membrane electrode assembly are seeing performance improvements, with enhanced designs boosting efficiency over 15% in next-generation systems.

What challenges does the Ion Exchange Membranes Industry face during its growth?

  • High manufacturing and operational costs present a significant challenge, potentially constraining broader market adoption and growth.

  • A key challenge remains the high manufacturing cost and operational durability. Issues related to fouling resistance and long-term stability impact total cost of ownership. Enhancing the mechanical strength of the polymer matrix is crucial for extending operational life.
  • The stability of the polymer backbone and its functional groups, such as sulfonic acid groups or quaternary ammonium ions, is vital in aggressive chemical environments. Imperfect sulfonation processes can lead to performance degradation, impacting system reliability and increasing maintenance costs by up to 20% over a system's lifecycle.

Exclusive Technavio Analysis on Customer Landscape

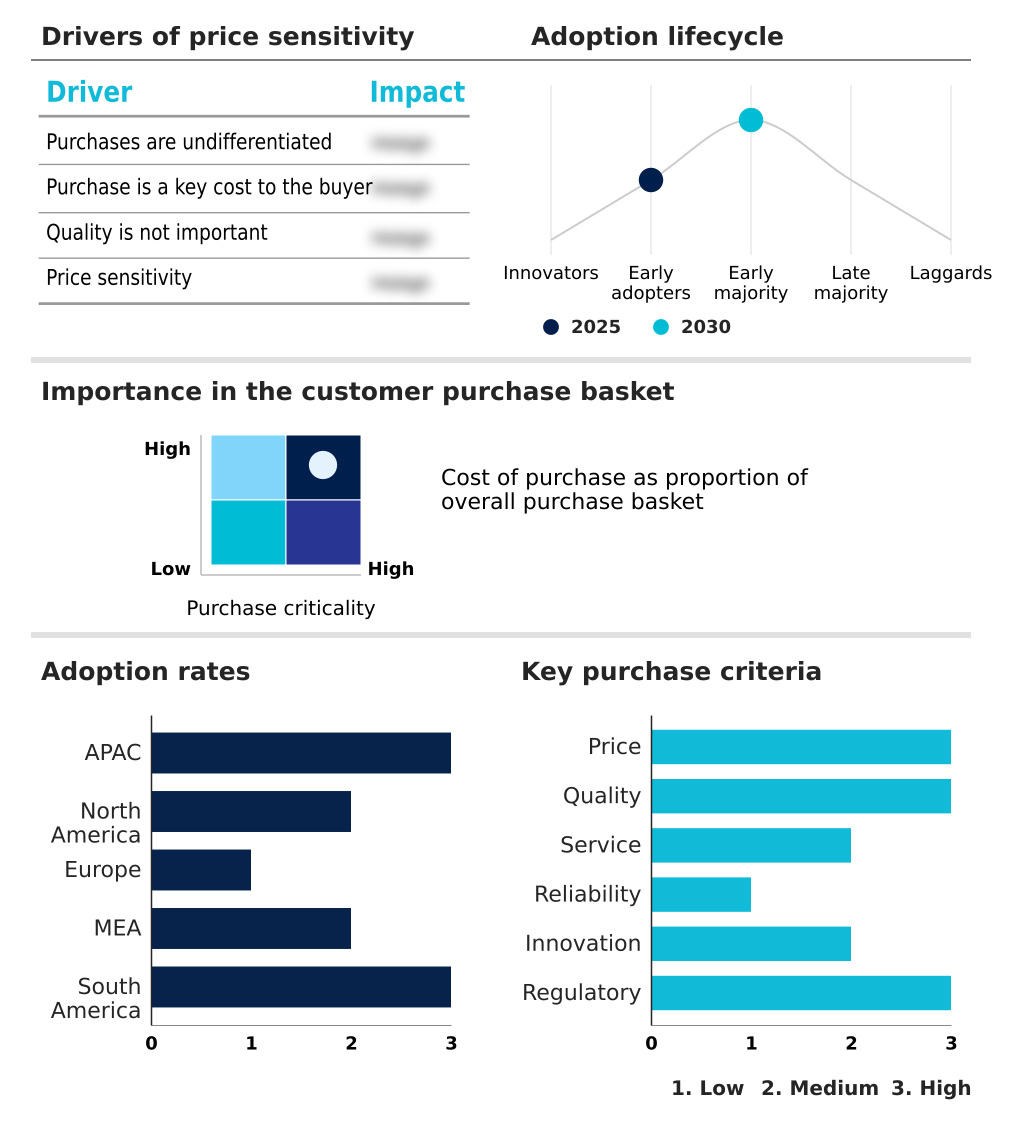
The ion exchange membranes market forecasting report includes the adoption lifecycle of the market, covering from the innovator’s stage to the laggard’s stage. It focuses on adoption rates in different regions based on penetration. Furthermore, the ion exchange membranes market report also includes key purchase criteria and drivers of price sensitivity to help companies evaluate and develop their market growth analysis strategies.

Customer Landscape of Ion Exchange Membranes Industry

Competitive Landscape

Companies are implementing various strategies, such as strategic alliances, ion exchange membranes market forecast, partnerships, mergers and acquisitions, geographical expansion, and product/service launches, to enhance their presence in the industry.

AGC Inc. - Provides high-performance ion exchange membranes for desalination, chlor-alkali production, and industrial separation, enhancing process efficiency.

The industry research and growth report includes detailed analyses of the competitive landscape of the market and information about key companies, including:

  • AGC Inc.
  • Asahi Kasei Corp.
  • ASTOM Corp.
  • FUJIFILM Holdings Corp.
  • Fumatech BWT GmbH
  • Ion Membranes
  • Ionomr Innovations Inc.
  • Liaoning Yichen Membrane Co.
  • MANN HUMMEL International GmbH
  • MEGA a.s.
  • Membrion Inc.
  • Orion Polymer
  • Saltworks Technologies Inc.
  • SnowPure LLC
  • SUEZ SA
  • Syensqo SA
  • The Chemours Co.
  • Tianwei Membrane Technology Co.
  • Toray Industries Inc.
  • Versogen Inc.

Qualitative and quantitative analysis of companies has been conducted to help clients understand the wider business environment as well as the strengths and weaknesses of key industry players. Data is qualitatively analyzed to categorize companies as pure play, category-focused, industry-focused, and diversified; it is quantitatively analyzed to categorize companies as dominant, leading, strong, tentative, and weak.

Recent Development and News in Ion exchange membranes market

  • In August 2024, DuPont announced advancements in its ion exchange membrane technologies, including expanded production capabilities for membranes used in water electrolysis systems for green hydrogen generation.
  • In February 2025, Evonik initiated the construction of a pilot plant in Marl, Germany, dedicated to the production of its proprietary anion exchange membranes, which are specifically designed to enable cost-competitive green hydrogen production.
  • In March 2025, Austin Water confirmed a partnership with LANXESS to pilot a new generation of monovalent-selective ion exchange membranes in its inland desalination research facility.
  • In May 2025, Shell plc advanced the construction of the Holland Hydrogen 1 project at the Port of Rotterdam, a 200 MW renewable hydrogen plant to commercially deploy advanced anion exchange membrane electrolyzers.

Dive into Technavio’s robust research methodology, blending expert interviews, extensive data synthesis, and validated models for unparalleled Ion Exchange Membranes Market insights. See full methodology.

Market Scope
Page number 323
Base year 2025
Historic period 2020-2024
Forecast period 2026-2030
Growth momentum & CAGR Accelerate at a CAGR of 2.7%
Market growth 2026-2030 USD 151884.2 thousand
Market structure Fragmented
YoY growth 2025-2026(%) 2.6%
Key countries China, Japan, India, South Korea, Australia, Indonesia, US, Canada, Mexico, Germany, France, UK, Italy, The Netherlands, Spain, Saudi Arabia, UAE, South Africa, Israel, Turkey, Brazil, Argentina and Chile
Competitive landscape Leading Companies, Market Positioning of Companies, Competitive Strategies, and Industry Risks

Request Free Sample

Research Analyst Overview

  • The Ion Exchange Membranes market is characterized by a strong emphasis on material science innovation to meet the demands of high-growth sectors. The development of a robust polymer matrix is central to enhancing the mechanical strength and chemical stability of membranes, impacting their performance in applications like water electrolysis and demineralization.
  • Anion exchange membrane and cation exchange membrane technologies are at the core of this evolution, with ongoing research focused on improving ionic conductivity and fouling resistance. For boardroom consideration, the choice between a hydrocarbon membrane and a perfluorocarbon membrane involves a strategic trade-off between cost, performance, and regulatory compliance, particularly as environmental standards tighten.
  • The adoption of advanced composite membrane designs has led to a 20% improvement in operational lifespan in certain industrial processes. This focus on durability, combined with advancements in technologies such as the proton exchange membrane and bipolar membrane, positions these components as critical enablers for next-generation energy and water systems.
  • The effectiveness of sulfonation processes and the resulting ion selectivity are key performance indicators that directly influence system efficiency and overall return on investment.

What are the Key Data Covered in this Ion Exchange Membranes Market Research and Growth Report?

  • What is the expected growth of the Ion Exchange Membranes Market between 2026 and 2030?

    • USD 151.88 million, at a CAGR of 2.7%

  • What segmentation does the market report cover?

    • The report is segmented by Material (Hydrocarbon membrane, Perfluorocarbon membrane, Inorganic membrane, Composite membrane, and Partially halogenated membrane), Application (Water treatment, Electrolysis, Storage batteries, Electrodialysis, and Others), Type (Cation, Anion, Amphoteric ion, Bipolar ion, and Mosaic ion) and Geography (APAC, North America, Europe, Middle East and Africa, South America)

  • Which regions are analyzed in the report?

    • APAC, North America, Europe, Middle East and Africa and South America

  • What are the key growth drivers and market challenges?

    • Rising demand for water treatment and desalination, High manufacturing and operational costs

  • Who are the major players in the Ion Exchange Membranes Market?

    • AGC Inc., Asahi Kasei Corp., ASTOM Corp., FUJIFILM Holdings Corp., Fumatech BWT GmbH, Ion Membranes, Ionomr Innovations Inc., Liaoning Yichen Membrane Co., MANN HUMMEL International GmbH, MEGA a.s., Membrion Inc., Orion Polymer, Saltworks Technologies Inc., SnowPure LLC, SUEZ SA, Syensqo SA, The Chemours Co., Tianwei Membrane Technology Co., Toray Industries Inc. and Versogen Inc.

Market Research Insights

  • Market dynamics are increasingly influenced by the performance of advanced ion-conducting polymers. Innovations in materials science are enabling enhanced electrochemical separation, with some next-generation systems improving resource recovery from waste by over 18%. The development of stable polymer backbone structures is critical for applications like the chlor-alkali process and brackish water desalination.
  • As a result, systems utilizing monovalent selective ion exchange technologies now achieve higher purity levels compared to legacy systems. This focus on material integrity and specialized functionality supports the expansion of membrane technologies into more demanding industrial environments, where durability and efficiency are paramount.

We can help! Our analysts can customize this ion exchange membranes market research report to meet your requirements.

Get in touch

1. Executive Summary

1.1 Market overview

Executive Summary - Chart on Market Overview
Executive Summary - Data Table on Market Overview
Executive Summary - Chart on Global Market Characteristics
Executive Summary - Chart on Market by Geography
Executive Summary - Chart on Market Segmentation by Material
Executive Summary - Chart on Market Segmentation by Application
Executive Summary - Chart on Market Segmentation by Type
Executive Summary - Chart on Incremental Growth
Executive Summary - Data Table on Incremental Growth
Executive Summary - Chart on Company Market Positioning

2. Technavio Analysis

2.1 Analysis of price sensitivity, lifecycle, customer purchase basket, adoption rates, and purchase criteria

2.2 Criticality of inputs and Factors of differentiation

Chart on Overview on criticality of inputs and factors of differentiation

2.3 Factors of disruption

Chart on Overview on factors of disruption

2.4 Impact of drivers and challenges

Chart on Impact of drivers and challenges in 2025 and 2030

3. Market Landscape

3.1 Market ecosystem

Chart on Parent Market
Data Table on - Parent Market

3.2 Market characteristics

Chart on Market characteristics analysis

3.3 Value chain analysis

Chart on Value chain analysis

4. Market Sizing

4.1 Market definition

Data Table on Offerings of companies included in the market definition

4.2 Market segment analysis

Market segments

4.3 Market size 2025

4.4 Market outlook: Forecast for 2025-2030

Chart on Global - Market size and forecast 2025-2030 ($ thousand)
Data Table on Global - Market size and forecast 2025-2030 ($ thousand)
Chart on Global Market: Year-over-year growth 2025-2030 (%)
Data Table on Global Market: Year-over-year growth 2025-2030 (%)

5. Historic Market Size

5.1 Global Ion Exchange Membranes Market 2020 - 2024

Historic Market Size - Data Table on Global Ion Exchange Membranes Market 2020 - 2024 ($ thousand)

5.2 Material segment analysis 2020 - 2024

Historic Market Size - Material Segment 2020 - 2024 ($ thousand)

5.3 Application segment analysis 2020 - 2024

Historic Market Size - Application Segment 2020 - 2024 ($ thousand)

5.4 Type segment analysis 2020 - 2024

Historic Market Size - Type Segment 2020 - 2024 ($ thousand)

5.5 Geography segment analysis 2020 - 2024

Historic Market Size - Geography Segment 2020 - 2024 ($ thousand)

5.6 Country segment analysis 2020 - 2024

Historic Market Size - Country Segment 2020 - 2024 ($ thousand)

6. Qualitative Analysis

6.1 Impact of AI on Global Ion Exchange Membranes Market

6.2 Impact of Geopolitical conflict on Global Ion Exchange Membranes Market

7. Five Forces Analysis

7.1 Five forces summary

Five forces analysis - Comparison between 2025 and 2030

7.2 Bargaining power of buyers

Bargaining power of buyers - Impact of key factors 2025 and 2030

7.3 Bargaining power of suppliers

Bargaining power of suppliers - Impact of key factors in 2025 and 2030

7.4 Threat of new entrants

Threat of new entrants - Impact of key factors in 2025 and 2030

7.5 Threat of substitutes

Threat of substitutes - Impact of key factors in 2025 and 2030

7.6 Threat of rivalry

Threat of rivalry - Impact of key factors in 2025 and 2030

7.7 Market condition

Chart on Market condition - Five forces 2025 and 2030

8. Market Segmentation by Material

8.1 Market segments

Chart on Material - Market share 2025-2030 (%)
Data Table on Material - Market share 2025-2030 (%)

8.2 Comparison by Material

Chart on Comparison by Material
Data Table on Comparison by Material

8.3 Hydrocarbon membrane - Market size and forecast 2025-2030

Chart on Hydrocarbon membrane - Market size and forecast 2025-2030 ($ thousand)
Data Table on Hydrocarbon membrane - Market size and forecast 2025-2030 ($ thousand)
Chart on Hydrocarbon membrane - Year-over-year growth 2025-2030 (%)
Data Table on Hydrocarbon membrane - Year-over-year growth 2025-2030 (%)

8.4 Perfluorocarbon membrane - Market size and forecast 2025-2030

Chart on Perfluorocarbon membrane - Market size and forecast 2025-2030 ($ thousand)
Data Table on Perfluorocarbon membrane - Market size and forecast 2025-2030 ($ thousand)
Chart on Perfluorocarbon membrane - Year-over-year growth 2025-2030 (%)
Data Table on Perfluorocarbon membrane - Year-over-year growth 2025-2030 (%)

8.5 Inorganic membrane - Market size and forecast 2025-2030

Chart on Inorganic membrane - Market size and forecast 2025-2030 ($ thousand)
Data Table on Inorganic membrane - Market size and forecast 2025-2030 ($ thousand)
Chart on Inorganic membrane - Year-over-year growth 2025-2030 (%)
Data Table on Inorganic membrane - Year-over-year growth 2025-2030 (%)

8.6 Composite membrane - Market size and forecast 2025-2030

Chart on Composite membrane - Market size and forecast 2025-2030 ($ thousand)
Data Table on Composite membrane - Market size and forecast 2025-2030 ($ thousand)
Chart on Composite membrane - Year-over-year growth 2025-2030 (%)
Data Table on Composite membrane - Year-over-year growth 2025-2030 (%)

8.7 Partially halogenated membrane - Market size and forecast 2025-2030

Chart on Partially halogenated membrane - Market size and forecast 2025-2030 ($ thousand)
Data Table on Partially halogenated membrane - Market size and forecast 2025-2030 ($ thousand)
Chart on Partially halogenated membrane - Year-over-year growth 2025-2030 (%)
Data Table on Partially halogenated membrane - Year-over-year growth 2025-2030 (%)

8.8 Market opportunity by Material

Market opportunity by Material ($ thousand)
Data Table on Market opportunity by Material ($ thousand)

9. Market Segmentation by Application

9.1 Market segments

Chart on Application - Market share 2025-2030 (%)
Data Table on Application - Market share 2025-2030 (%)

9.2 Comparison by Application

Chart on Comparison by Application
Data Table on Comparison by Application

9.3 Water treatment - Market size and forecast 2025-2030

Chart on Water treatment - Market size and forecast 2025-2030 ($ thousand)
Data Table on Water treatment - Market size and forecast 2025-2030 ($ thousand)
Chart on Water treatment - Year-over-year growth 2025-2030 (%)
Data Table on Water treatment - Year-over-year growth 2025-2030 (%)

9.4 Electrolysis - Market size and forecast 2025-2030

Chart on Electrolysis - Market size and forecast 2025-2030 ($ thousand)
Data Table on Electrolysis - Market size and forecast 2025-2030 ($ thousand)
Chart on Electrolysis - Year-over-year growth 2025-2030 (%)
Data Table on Electrolysis - Year-over-year growth 2025-2030 (%)

9.5 Storage batteries - Market size and forecast 2025-2030

Chart on Storage batteries - Market size and forecast 2025-2030 ($ thousand)
Data Table on Storage batteries - Market size and forecast 2025-2030 ($ thousand)
Chart on Storage batteries - Year-over-year growth 2025-2030 (%)
Data Table on Storage batteries - Year-over-year growth 2025-2030 (%)

9.6 Electrodialysis - Market size and forecast 2025-2030

Chart on Electrodialysis - Market size and forecast 2025-2030 ($ thousand)
Data Table on Electrodialysis - Market size and forecast 2025-2030 ($ thousand)
Chart on Electrodialysis - Year-over-year growth 2025-2030 (%)
Data Table on Electrodialysis - Year-over-year growth 2025-2030 (%)

9.7 Others - Market size and forecast 2025-2030

Chart on Others - Market size and forecast 2025-2030 ($ thousand)
Data Table on Others - Market size and forecast 2025-2030 ($ thousand)
Chart on Others - Year-over-year growth 2025-2030 (%)
Data Table on Others - Year-over-year growth 2025-2030 (%)

9.8 Market opportunity by Application

Market opportunity by Application ($ thousand)
Data Table on Market opportunity by Application ($ thousand)

10. Market Segmentation by Type

10.1 Market segments

Chart on Type - Market share 2025-2030 (%)
Data Table on Type - Market share 2025-2030 (%)

10.2 Comparison by Type

Chart on Comparison by Type
Data Table on Comparison by Type

10.3 Cation - Market size and forecast 2025-2030

Chart on Cation - Market size and forecast 2025-2030 ($ thousand)
Data Table on Cation - Market size and forecast 2025-2030 ($ thousand)
Chart on Cation - Year-over-year growth 2025-2030 (%)
Data Table on Cation - Year-over-year growth 2025-2030 (%)

10.4 Anion - Market size and forecast 2025-2030

Chart on Anion - Market size and forecast 2025-2030 ($ thousand)
Data Table on Anion - Market size and forecast 2025-2030 ($ thousand)
Chart on Anion - Year-over-year growth 2025-2030 (%)
Data Table on Anion - Year-over-year growth 2025-2030 (%)

10.5 Amphoteric ion - Market size and forecast 2025-2030

Chart on Amphoteric ion - Market size and forecast 2025-2030 ($ thousand)
Data Table on Amphoteric ion - Market size and forecast 2025-2030 ($ thousand)
Chart on Amphoteric ion - Year-over-year growth 2025-2030 (%)
Data Table on Amphoteric ion - Year-over-year growth 2025-2030 (%)

10.6 Bipolar ion - Market size and forecast 2025-2030

Chart on Bipolar ion - Market size and forecast 2025-2030 ($ thousand)
Data Table on Bipolar ion - Market size and forecast 2025-2030 ($ thousand)
Chart on Bipolar ion - Year-over-year growth 2025-2030 (%)
Data Table on Bipolar ion - Year-over-year growth 2025-2030 (%)

10.7 Mosaic ion - Market size and forecast 2025-2030

Chart on Mosaic ion - Market size and forecast 2025-2030 ($ thousand)
Data Table on Mosaic ion - Market size and forecast 2025-2030 ($ thousand)
Chart on Mosaic ion - Year-over-year growth 2025-2030 (%)
Data Table on Mosaic ion - Year-over-year growth 2025-2030 (%)

10.8 Market opportunity by Type

Market opportunity by Type ($ thousand)
Data Table on Market opportunity by Type ($ thousand)

11. Customer Landscape

11.1 Customer landscape overview

Analysis of price sensitivity, lifecycle, customer purchase basket, adoption rates, and purchase criteria

12. Geographic Landscape

12.1 Geographic segmentation

Chart on Market share by geography 2025-2030 (%)
Data Table on Market share by geography 2025-2030 (%)

12.2 Geographic comparison

Chart on Geographic comparison
Data Table on Geographic comparison

12.3 APAC - Market size and forecast 2025-2030

Chart on APAC - Market size and forecast 2025-2030 ($ thousand)
Data Table on APAC - Market size and forecast 2025-2030 ($ thousand)
Chart on APAC - Year-over-year growth 2025-2030 (%)
Data Table on APAC - Year-over-year growth 2025-2030 (%)
Chart on Regional Comparison - APAC
Data Table on Regional Comparison - APAC

12.3.1 China - Market size and forecast 2025-2030

Chart on China - Market size and forecast 2025-2030 ($ thousand)
Data Table on China - Market size and forecast 2025-2030 ($ thousand)
Chart on China - Year-over-year growth 2025-2030 (%)
Data Table on China - Year-over-year growth 2025-2030 (%)

12.3.2 Japan - Market size and forecast 2025-2030

Chart on Japan - Market size and forecast 2025-2030 ($ thousand)
Data Table on Japan - Market size and forecast 2025-2030 ($ thousand)
Chart on Japan - Year-over-year growth 2025-2030 (%)
Data Table on Japan - Year-over-year growth 2025-2030 (%)

12.3.3 India - Market size and forecast 2025-2030

Chart on India - Market size and forecast 2025-2030 ($ thousand)
Data Table on India - Market size and forecast 2025-2030 ($ thousand)
Chart on India - Year-over-year growth 2025-2030 (%)
Data Table on India - Year-over-year growth 2025-2030 (%)

12.3.4 South Korea - Market size and forecast 2025-2030

Chart on South Korea - Market size and forecast 2025-2030 ($ thousand)
Data Table on South Korea - Market size and forecast 2025-2030 ($ thousand)
Chart on South Korea - Year-over-year growth 2025-2030 (%)
Data Table on South Korea - Year-over-year growth 2025-2030 (%)

12.3.5 Australia - Market size and forecast 2025-2030

Chart on Australia - Market size and forecast 2025-2030 ($ thousand)
Data Table on Australia - Market size and forecast 2025-2030 ($ thousand)
Chart on Australia - Year-over-year growth 2025-2030 (%)
Data Table on Australia - Year-over-year growth 2025-2030 (%)

12.3.6 Indonesia - Market size and forecast 2025-2030

Chart on Indonesia - Market size and forecast 2025-2030 ($ thousand)
Data Table on Indonesia - Market size and forecast 2025-2030 ($ thousand)
Chart on Indonesia - Year-over-year growth 2025-2030 (%)
Data Table on Indonesia - Year-over-year growth 2025-2030 (%)

12.4 North America - Market size and forecast 2025-2030

Chart on North America - Market size and forecast 2025-2030 ($ thousand)
Data Table on North America - Market size and forecast 2025-2030 ($ thousand)
Chart on North America - Year-over-year growth 2025-2030 (%)
Data Table on North America - Year-over-year growth 2025-2030 (%)
Chart on Regional Comparison - North America
Data Table on Regional Comparison - North America

12.4.1 US - Market size and forecast 2025-2030

Chart on US - Market size and forecast 2025-2030 ($ thousand)
Data Table on US - Market size and forecast 2025-2030 ($ thousand)
Chart on US - Year-over-year growth 2025-2030 (%)
Data Table on US - Year-over-year growth 2025-2030 (%)

12.4.2 Canada - Market size and forecast 2025-2030

Chart on Canada - Market size and forecast 2025-2030 ($ thousand)
Data Table on Canada - Market size and forecast 2025-2030 ($ thousand)
Chart on Canada - Year-over-year growth 2025-2030 (%)
Data Table on Canada - Year-over-year growth 2025-2030 (%)

12.4.3 Mexico - Market size and forecast 2025-2030

Chart on Mexico - Market size and forecast 2025-2030 ($ thousand)
Data Table on Mexico - Market size and forecast 2025-2030 ($ thousand)
Chart on Mexico - Year-over-year growth 2025-2030 (%)
Data Table on Mexico - Year-over-year growth 2025-2030 (%)

12.5 Europe - Market size and forecast 2025-2030

Chart on Europe - Market size and forecast 2025-2030 ($ thousand)
Data Table on Europe - Market size and forecast 2025-2030 ($ thousand)
Chart on Europe - Year-over-year growth 2025-2030 (%)
Data Table on Europe - Year-over-year growth 2025-2030 (%)
Chart on Regional Comparison - Europe
Data Table on Regional Comparison - Europe

12.5.1 Germany - Market size and forecast 2025-2030

Chart on Germany - Market size and forecast 2025-2030 ($ thousand)
Data Table on Germany - Market size and forecast 2025-2030 ($ thousand)
Chart on Germany - Year-over-year growth 2025-2030 (%)
Data Table on Germany - Year-over-year growth 2025-2030 (%)

12.5.2 France - Market size and forecast 2025-2030

Chart on France - Market size and forecast 2025-2030 ($ thousand)
Data Table on France - Market size and forecast 2025-2030 ($ thousand)
Chart on France - Year-over-year growth 2025-2030 (%)
Data Table on France - Year-over-year growth 2025-2030 (%)

12.5.3 UK - Market size and forecast 2025-2030

Chart on UK - Market size and forecast 2025-2030 ($ thousand)
Data Table on UK - Market size and forecast 2025-2030 ($ thousand)
Chart on UK - Year-over-year growth 2025-2030 (%)
Data Table on UK - Year-over-year growth 2025-2030 (%)

12.5.4 Italy - Market size and forecast 2025-2030

Chart on Italy - Market size and forecast 2025-2030 ($ thousand)
Data Table on Italy - Market size and forecast 2025-2030 ($ thousand)
Chart on Italy - Year-over-year growth 2025-2030 (%)
Data Table on Italy - Year-over-year growth 2025-2030 (%)

12.5.5 The Netherlands - Market size and forecast 2025-2030

Chart on The Netherlands - Market size and forecast 2025-2030 ($ thousand)
Data Table on The Netherlands - Market size and forecast 2025-2030 ($ thousand)
Chart on The Netherlands - Year-over-year growth 2025-2030 (%)
Data Table on The Netherlands - Year-over-year growth 2025-2030 (%)

12.5.6 Spain - Market size and forecast 2025-2030

Chart on Spain - Market size and forecast 2025-2030 ($ thousand)
Data Table on Spain - Market size and forecast 2025-2030 ($ thousand)
Chart on Spain - Year-over-year growth 2025-2030 (%)
Data Table on Spain - Year-over-year growth 2025-2030 (%)

12.6 Middle East and Africa - Market size and forecast 2025-2030

Chart on Middle East and Africa - Market size and forecast 2025-2030 ($ thousand)
Data Table on Middle East and Africa - Market size and forecast 2025-2030 ($ thousand)
Chart on Middle East and Africa - Year-over-year growth 2025-2030 (%)
Data Table on Middle East and Africa - Year-over-year growth 2025-2030 (%)
Chart on Regional Comparison - Middle East and Africa
Data Table on Regional Comparison - Middle East and Africa

12.6.1 Saudi Arabia - Market size and forecast 2025-2030

Chart on Saudi Arabia - Market size and forecast 2025-2030 ($ thousand)
Data Table on Saudi Arabia - Market size and forecast 2025-2030 ($ thousand)
Chart on Saudi Arabia - Year-over-year growth 2025-2030 (%)
Data Table on Saudi Arabia - Year-over-year growth 2025-2030 (%)

12.6.2 UAE - Market size and forecast 2025-2030

Chart on UAE - Market size and forecast 2025-2030 ($ thousand)
Data Table on UAE - Market size and forecast 2025-2030 ($ thousand)
Chart on UAE - Year-over-year growth 2025-2030 (%)
Data Table on UAE - Year-over-year growth 2025-2030 (%)

12.6.3 South Africa - Market size and forecast 2025-2030

Chart on South Africa - Market size and forecast 2025-2030 ($ thousand)
Data Table on South Africa - Market size and forecast 2025-2030 ($ thousand)
Chart on South Africa - Year-over-year growth 2025-2030 (%)
Data Table on South Africa - Year-over-year growth 2025-2030 (%)

12.6.4 Israel - Market size and forecast 2025-2030

Chart on Israel - Market size and forecast 2025-2030 ($ thousand)
Data Table on Israel - Market size and forecast 2025-2030 ($ thousand)
Chart on Israel - Year-over-year growth 2025-2030 (%)
Data Table on Israel - Year-over-year growth 2025-2030 (%)

12.6.5 Turkey - Market size and forecast 2025-2030

Chart on Turkey - Market size and forecast 2025-2030 ($ thousand)
Data Table on Turkey - Market size and forecast 2025-2030 ($ thousand)
Chart on Turkey - Year-over-year growth 2025-2030 (%)
Data Table on Turkey - Year-over-year growth 2025-2030 (%)

12.7 South America - Market size and forecast 2025-2030

Chart on South America - Market size and forecast 2025-2030 ($ thousand)
Data Table on South America - Market size and forecast 2025-2030 ($ thousand)
Chart on South America - Year-over-year growth 2025-2030 (%)
Data Table on South America - Year-over-year growth 2025-2030 (%)
Chart on Regional Comparison - South America
Data Table on Regional Comparison - South America

12.7.1 Brazil - Market size and forecast 2025-2030

Chart on Brazil - Market size and forecast 2025-2030 ($ thousand)
Data Table on Brazil - Market size and forecast 2025-2030 ($ thousand)
Chart on Brazil - Year-over-year growth 2025-2030 (%)
Data Table on Brazil - Year-over-year growth 2025-2030 (%)

12.7.2 Argentina - Market size and forecast 2025-2030

Chart on Argentina - Market size and forecast 2025-2030 ($ thousand)
Data Table on Argentina - Market size and forecast 2025-2030 ($ thousand)
Chart on Argentina - Year-over-year growth 2025-2030 (%)
Data Table on Argentina - Year-over-year growth 2025-2030 (%)

12.7.3 Chile - Market size and forecast 2025-2030

Chart on Chile - Market size and forecast 2025-2030 ($ thousand)
Data Table on Chile - Market size and forecast 2025-2030 ($ thousand)
Chart on Chile - Year-over-year growth 2025-2030 (%)
Data Table on Chile - Year-over-year growth 2025-2030 (%)

12.8 Market opportunity by geography

Market opportunity by geography ($ thousand)
Data Tables on Market opportunity by geography ($ thousand)

13. Drivers, Challenges, and Opportunity

13.1 Market drivers

Rising demand for water treatment and desalination
Expansion of green energy sector
Increasing adoption in high-value industries

13.2 Market challenges

High manufacturing and operational costs
Membrane durability and fouling issues
Competition from alternative technologies

13.3 Impact of drivers and challenges

Impact of drivers and challenges in 2025 and 2030

13.4 Market opportunities

Intensified focus on membranes for green hydrogen and energy storage
Development of high-performance and sustainable membrane materials
Increasing adoption in circular economy and resource recovery

14. Competitive Landscape

14.1 Overview

14.2

Overview on criticality of inputs and factors of differentiation

14.3 Landscape disruption

Overview on factors of disruption

14.4 Industry risks

Impact of key risks on business

15. Competitive Analysis

15.1 Companies profiled

Companies covered

15.2 Company ranking index

15.3 Market positioning of companies

Matrix on companies position and classification

15.4 AGC Inc.

AGC Inc. - Overview
AGC Inc. - Business segments
AGC Inc. - Key news
AGC Inc. - Key offerings
AGC Inc. - Segment focus
SWOT

15.5 Asahi Kasei Corp.

Asahi Kasei Corp. - Overview
Asahi Kasei Corp. - Business segments
Asahi Kasei Corp. - Key news
Asahi Kasei Corp. - Key offerings
Asahi Kasei Corp. - Segment focus
SWOT

15.6 ASTOM Corp.

ASTOM Corp. - Overview
ASTOM Corp. - Product / Service
ASTOM Corp. - Key offerings
SWOT

15.7 FUJIFILM Holdings Corp.

FUJIFILM Holdings Corp. - Overview
FUJIFILM Holdings Corp. - Business segments
FUJIFILM Holdings Corp. - Key news
FUJIFILM Holdings Corp. - Key offerings
FUJIFILM Holdings Corp. - Segment focus
SWOT

15.8 Fumatech BWT GmbH

Fumatech BWT GmbH - Overview
Fumatech BWT GmbH - Product / Service
Fumatech BWT GmbH - Key offerings
SWOT

15.9 Ionomr Innovations Inc.

Ionomr Innovations Inc. - Overview
Ionomr Innovations Inc. - Product / Service
Ionomr Innovations Inc. - Key offerings
SWOT

15.10 MANN HUMMEL International GmbH

MANN HUMMEL International GmbH - Overview
MANN HUMMEL International GmbH - Product / Service
MANN HUMMEL International GmbH - Key offerings
SWOT

15.11 MEGA a.s.

MEGA a.s. - Overview
MEGA a.s. - Product / Service
MEGA a.s. - Key offerings
SWOT

15.12 Membrion Inc.

Membrion Inc. - Overview
Membrion Inc. - Product / Service
Membrion Inc. - Key offerings
SWOT

15.13 Saltworks Technologies Inc.

Saltworks Technologies Inc. - Overview
Saltworks Technologies Inc. - Product / Service
Saltworks Technologies Inc. - Key offerings
SWOT

15.14 SUEZ SA

SUEZ SA - Overview
SUEZ SA - Product / Service
SUEZ SA - Key offerings
SWOT

15.15 Syensqo SA

Syensqo SA - Overview
Syensqo SA - Business segments
Syensqo SA - Key news
Syensqo SA - Key offerings
Syensqo SA - Segment focus
SWOT

15.16 The Chemours Co.

The Chemours Co. - Overview
The Chemours Co. - Business segments
The Chemours Co. - Key news
The Chemours Co. - Key offerings
The Chemours Co. - Segment focus
SWOT

15.17 Tianwei Membrane Technology Co.

Tianwei Membrane Technology Co. - Overview
Tianwei Membrane Technology Co. - Product / Service
Tianwei Membrane Technology Co. - Key offerings
SWOT

15.18 Toray Industries Inc.

Toray Industries Inc. - Overview
Toray Industries Inc. - Business segments
Toray Industries Inc. - Key news
Toray Industries Inc. - Key offerings
Toray Industries Inc. - Segment focus
SWOT

16. Appendix

16.1 Scope of the report

Market definition
Objectives
Notes and caveats

16.2 Inclusions and exclusions checklist

Inclusions checklist
Exclusions checklist

16.3 Currency conversion rates for US$

16.4 Research methodology

16.5 Data procurement

Information sources

16.6 Data validation

16.7 Validation techniques employed for market sizing

16.8 Data synthesis

16.9 360 degree market analysis

16.10 List of abbreviations

Research Methodology

Technavio presents a detailed picture of the market by way of study, synthesis, and summation of data from multiple sources. The analysts have presented the various facets of the market with a particular focus on identifying the key industry influencers. The data thus presented is comprehensive, reliable, and the result of extensive research, both primary and secondary.

INFORMATION SOURCES

Primary sources

  • Manufacturers and suppliers
  • Channel partners
  • Industry experts
  • Strategic decision makers

Secondary sources

  • Industry journals and periodicals
  • Government data
  • Financial reports of key industry players
  • Historical data
  • Press releases

DATA ANALYSIS

Data Synthesis

  • Collation of data
  • Estimation of key figures
  • Analysis of derived insights

Data Validation

  • Triangulation with data models
  • Reference against proprietary databases
  • Corroboration with industry experts

REPORT WRITING

Qualitative

  • Market drivers
  • Market challenges
  • Market trends
  • Five forces analysis

Quantitative

  • Market size and forecast
  • Market segmentation
  • Geographical insights
  • Competitive landscape

Interested in this report?

Get your sample now to see our research methodology and insights!

Download Now

Frequently Asked Questions

Ion Exchange Membranes market growth will increase by USD 151884.2 thousand thousand during 2026-2030.

The Ion Exchange Membranes market is expected to grow at a CAGR of 2.7% during 2026-2030.

Ion Exchange Membranes market is segmented by Material (Hydrocarbon membrane, Perfluorocarbon membrane, Inorganic membrane, Composite membrane, Partially halogenated membrane) Application (Water treatment, Electrolysis, Storage batteries, Electrodialysis, Others) Type (Cation, Anion, Amphoteric ion, Bipolar ion, Mosaic ion)

AGC Inc., Asahi Kasei Corp., ASTOM Corp., FUJIFILM Holdings Corp., Fumatech BWT GmbH, Ion Membranes, Ionomr Innovations Inc., Liaoning Yichen Membrane Co., MANN HUMMEL International GmbH, MEGA a.s., Membrion Inc., Orion Polymer, Saltworks Technologies Inc., SnowPure LLC, SUEZ SA, Syensqo SA, The Chemours Co., Tianwei Membrane Technology Co., Toray Industries Inc., Versogen Inc. are a few of the key vendors in the Ion Exchange Membranes market.

APAC will register the highest growth rate of 54.7% among the other regions. Therefore, the Ion Exchange Membranes market in APAC is expected to garner significant business opportunities for the vendors during the forecast period.

China, Japan, India, South Korea, Australia, Indonesia, US, Canada, Mexico, Germany, France, UK, Italy, The Netherlands, Spain, Saudi Arabia, UAE, South Africa, Israel, Turkey, Brazil, Argentina, Chile

  • Rising demand for water treatment and desalination is the driving factor this market.

The Ion Exchange Membranes market vendors should focus on grabbing business opportunities from the Material segment as it accounted for the largest market share in the base year.
RIA - Research AI Assistant
Ask RIA