Intelligent Transport System (ITS) Market Analysis, Size, and Forecast 2025-2029: North America (US and Canada), Europe (France, Germany, Italy, and UK), APAC (China, India, Japan, and South Korea), and Rest of World (ROW)

Intelligent Transport System (ITS) Market Analysis, Size, and Forecast 2025-2029:
North America (US and Canada), Europe (France, Germany, Italy, and UK), APAC (China, India, Japan, and South Korea), and Rest of World (ROW)

Published: Jul 2025 247 Pages SKU: IRTNTR41630

Intelligent Transport System Market Size 2025-2029

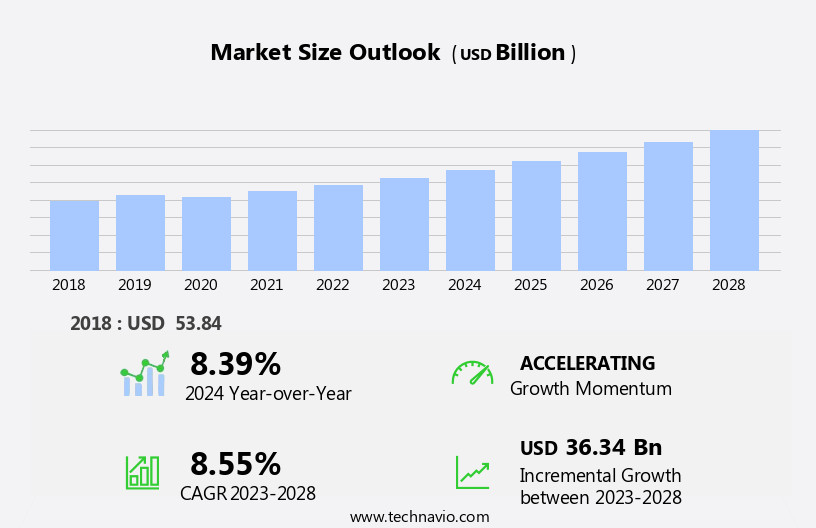
The intelligent transport system (ITS) market size is forecast to increase by USD 47.38 billion, at a CAGR of 10% between 2024 and 2029. The market is driven by the pressing need to address increasing traffic congestion and road accidents.

Major Market Trends & Insights

  • North America dominated the market and accounted for a 34% share in 2023.
  • The market is expected to grow significantly in Europe region as well over the forecast period.
  • Based on the Application, the traffic management segment led the market and was valued at USD 21.08 billion of the global revenue in 2023.
  • Based on the Type, the advanced traffic management system segment accounted for the largest market revenue share in 2023.

Market Size & Forecast

  • Market Opportunities: USD 77.6 Billion
  • Future Opportunities: USD 47.38 Billion
  • CAGR (2024-2029): 10%
  • North America: Largest market in 2023

The market continues to evolve, driven by the need for energy-efficient transportation and the implementation of road traffic monitoring and management systems. ITS is revolutionizing various sectors, from transportation infrastructure to public transport and fleet management. For instance, a major city implemented a traffic management system that reduced congestion by 20%, resulting in significant fuel savings and emission reduction strategies. ITS standards compliance plays a crucial role in this dynamic market, ensuring seamless integration of autonomous vehicles, data analytics platforms, and communication protocols. The integration of these technologies is paving the way for real-time traffic data analysis, adaptive traffic control, and travel time prediction.

What will be the Size of the Intelligent Transport System (ITS) Market during the forecast period?

Intelligent Transport System (ITS) Market Size

Explore in-depth regional segment analysis with market size data - historical 2019-2023 and forecasts 2025-2029 - in the full report.  
Request Free Sample

Moreover, the deployment of sensor networks and vehicle-to-infrastructure communication is enabling traffic congestion mitigation, public transport optimization, and pedestrian safety systems. The industry is expected to grow at a robust rate, with a recent study projecting a 15% annual increase in demand for ITS solutions. ITS security protocols are also a priority, with cloud-based platforms and smart traffic signals ensuring data privacy and cybersecurity. The markets continuous unfolding is also marked by the development of network optimization algorithms, driver behavior analysis, and public transport scheduling systems. The toll management segment is the second largest segment of the Application and was valued at USD 19.75 billion in 2023.

The markets evolution is also reflected in the deployment of parking guidance systems and smart cities infrastructure, which are transforming urban landscapes and improving overall transportation efficiency.

The integration of cloud computing in fleet management operations is a significant trend, enabling real-time data processing and analysis, improving operational efficiency and safety. However, challenges persist, including complex system integration and interoperability issues, which hinder the seamless implementation and adoption of ITS solutions across various transportation sectors.

Companies must navigate these obstacles to effectively capitalize on the markets potential and deliver innovative, integrated, and interoperable ITS solutions to meet the evolving demands of transportation infrastructure and services. Furthermore, the integration of connected vehicle technology and incident detection systems is enhancing emergency vehicle preemption and enabling sustainable transportation solutions. The integration of systems, including wireless communication, artificial intelligence, and deep learning, enables continuous innovation and adaptation to the ever-changing transportation landscape.

How is this Intelligent Transport System (ITS) Industry segmented?

The intelligent transport system (ITS) industry research report provides comprehensive data (region-wise segment analysis), with forecasts and estimates in USD million for the period 2025-2029, as well as historical data from 2019-2023 for the following segments.

  • Application
    • Traffic management
    • Toll management
    • Automotive and infotainment telematics
    • Public transport
    • Others
  • Type
    • Advanced traffic management system
    • Advanced traveller information system
    • Advanced public transportation system
    • Advanced transportation pricing system
    • Others
  • Mode Of Transportation
    • Roadway
    • Railway
    • Airway
    • Maritime
  • Geography
    • North America
      • US
      • Canada
    • Europe
      • France
      • Germany
      • Italy
      • UK
    • APAC
      • China
      • India
      • Japan
      • South Korea
    • Rest of World (ROW)

By Application Insights

The Traffic management segment is estimated to witness significant growth during the forecast period. The segment was valued at USD 21.08 billion in 2023. It continued to the largest segment at a CAGR of 7.71%.The market is witnessing significant growth, particularly in the area of traffic management. Advanced Traffic Management Systems (ATMS) are a key component of this market, gaining popularity among government authorities and departments such as municipalities, government agencies, and state and regional governments. The increasing demand for ATMS can be attributed to the growing issue of traffic congestion worldwide. According to a study, the number of vehicles on the road is projected to increase by 50% by 2030. This trend is leading to higher transportation costs for players in the transportation industry and travel service providers. Edge computing and sensor fusion enable high-definition mapping and travel time prediction, providing valuable insights for connected infrastructure and passenger information systems.

To mitigate traffic congestion, ITS solutions are being integrated into transportation infrastructure. Energy-efficient transportation, emission reduction strategies, multimodal transport planning, and real-time traffic data are some of the essential components of ITS. For instance, the deployment of sensor networks and vehicle-to-infrastructure communication has led to the development of adaptive traffic control systems, travel time prediction, and traffic flow simulation. ITS standards compliance, public transport optimization, and communication protocols are other critical aspects of the market. The integration of autonomous vehicles, data analytics platforms, and data visualization tools is also driving market growth. The market is expected to grow at a steady rate during the forecast period, with sustainable transportation solutions, parking guidance systems, and smart city infrastructure being significant growth areas.

Intelligent Transport System (ITS) Market Size

Request Free Sample

The Traffic management segment was valued at USD 17.13 billion in 2019 and showed a gradual increase during the forecast period.

The Intelligent Transport System (ITS) Market is transforming global mobility through cutting-edge technologies. Key advancements include V2X communication protocols and traffic simulation models that optimize traffic flow and safety. Efficient parking space availability solutions and seamless ITS system integration enhance urban mobility. A robust ITS communication architecture supports a fully integrated transport network, enabling smarter transportation. Route guidance systems powered by a centralized data analytics platform offer real-time decision-making. The rise of Mobility as a Service (MaaS) is reshaping commuting behaviors, backed by scalable ITS architecture design. Adoption of a cloud-based ITS platform ensures data-driven operations, flexibility, and rapid deployment.

Additionally, the integration of emergency vehicle preemption, connected vehicle technology, and incident detection systems is enhancing road safety and improving traffic flow. Network optimization algorithms and adaptive traffic control systems are essential for efficient transportation and reducing driver behavior analysis. The ITS market is experiencing dynamic growth, driven by the need for efficient transportation, reducing traffic congestion, and improving road safety.

Regional Analysis

North America is estimated to contribute 34% to the growth of the global market during the forecast period. Technavios analysts have elaborately explained the regional trends and drivers that shape the market during the forecast period.

Intelligent Transport System (ITS) Market Share by Geography

 Request Free Sample

The market in North America is experiencing significant growth, driven by the increasing adoption of energy-efficient transportation solutions, advanced road traffic monitoring systems, and traffic management systems. Data suggests that the future opportunities for growth in the North America region estimates to be around USD 47.38 billion. These innovations aim to reduce emissions and optimize multimodal transport planning. ITS standards compliance, autonomous vehicle integration, and data analytics platforms are crucial components of this evolution. Security protocols ensure data privacy and integrity, while public transport optimization and communication protocols enhance efficiency. Traffic congestion mitigation strategies, such as fleet management systems and sensor network deployment, enable real-time traffic data analysis and vehicle-to-infrastructure communication. Travel time prediction and traffic flow simulation systems improve route guidance and ensure pedestrian safety.

Intelligent transportation infrastructure, network optimization algorithms, and adaptive traffic control systems contribute to a seamless traffic flow. Sustainable transportation solutions, like parking guidance systems and smart city infrastructure, are essential for reducing carbon footprints. Emergency vehicle preemption, connected vehicle technology, and incident detection systems ensure safety and efficiency. The ITS market in North America is projected to expand by 15% over the next five years, as cities invest in smart traffic signals and cloud-based ITS platforms to create a more efficient and interconnected transportation network. For instance, New York Citys implementation of smart traffic signals reduced travel time by 25% during peak hours.

Market Dynamics

Our researchers analyzed the data with 2024 as the base year, along with the key drivers, trends, and challenges. A holistic analysis of drivers will help companies refine their marketing strategies to gain a competitive advantage. The market is experiencing significant growth due to the increasing demand for optimized traffic flow, real-time data analysis, and sustainable transportation solutions in smart cities. Vehicle-to-everything (V2X) communication is a key driver, enabling predictive modeling for traffic congestion and improving response times for emergency vehicles. Sensor network design plays a crucial role in the success of ITS, providing the foundation for data collection and analysis. Optimization algorithms are employed to manage traffic flow, with traffic signal control strategies for intersections and public transport scheduling optimization algorithms ensuring efficient use of resources.

The integration of autonomous vehicles in ITS is a major development, requiring advanced communication protocols and standards for seamless integration. Data security protocols are essential to protect sensitive information and maintain privacy. Performance evaluation of traffic management systems is critical for continuous improvement, with cloud-based platforms providing a scalable solution for data management. Real-time data analysis for travel time and parking guidance systems optimization techniques contribute to enhanced urban mobility patterns. ITS infrastructure design considerations include the deployment strategies for smart traffic signals and fleet management system integration. The impact on urban mobility patterns is significant, with improvements in emergency vehicle response time and overall traffic flow.

Predictive modeling for traffic congestion and optimization algorithms for parking guidance systems are essential components of ITS, ensuring a sustainable and efficient transportation network. Data security protocols and performance evaluation are ongoing priorities to maintain the reliability and effectiveness of these systems.

What are the key market drivers leading to the rise in the adoption of Intelligent Transport System (ITS) Industry?

  • Traffic congestion and road accidents significantly contribute to the markets growth due to the increasing demand for solutions that mitigate these issues and ensure safer and more efficient transportation systems. The market is experiencing significant growth due to increasing urbanization and the rising use of automobiles, particularly in developing countries. This trend is driven by the expanding middle-class population and their increasing disposable income. Traffic congestion is a pressing issue in many parts of the world, with developing countries like India and China experiencing more severe challenges.
  • According to industry reports, the global ITS market is expected to grow by over 15% in the next five years, underscoring the markets potential for continued expansion. ITS solutions, such as congestion charges, road user charges, and electronic toll collection, are being implemented by government organizations to mitigate traffic congestion. One notable outcome of these initiatives is the reduction of bottlenecks and optimization of traffic flow. For instance, dynamic traffic control systems, including adaptive traffic signals, real-time traffic monitoring, and incident detection, have proven effective in improving traffic management and reducing travel time.

What are the market trends shaping the Intelligent Transport System (ITS) Industry?

  • The increasing adoption of cloud computing is a notable trend in fleet management operations. Cloud computing is revolutionizing the transportation industry by providing on-demand access to a shared pool of configurable resources. This technology is essential for transport fleet owners and operators due to its benefits, which include real-time visibility of operations, cost savings, improved vehicle uptime through data sharing, and low maintenance costs. Cloud computings flexibility allows for various deployment models, such as private, public, community, and hybrid clouds, catering to different user requirements.
  • This growth is attributed to the increasing demand for real-time data processing and analysis in the transportation sector. The benefits of cloud computing have led to a robust adoption rate, with the market expected to grow significantly in the coming years. According to recent studies, the global Intelligent Transport Systems (ITS) market is projected to expand by 25% in the next five years.

What challenges does the Intelligent Transport System (ITS) Industry face during its growth?

  • The integration and interoperability of systems represent a significant challenge that can hinder industry growth. This issue arises when different systems or technologies fail to work seamlessly together, leading to inefficiencies, increased costs, and potential delays. Addressing these complexities requires a deep understanding of various technologies and their interconnections, as well as the ability to design and implement effective solutions. Overcoming system integration and interoperability hurdles is crucial for fostering innovation, improving operational efficiency, and driving industry advancements. The market faces challenges due to interoperability issues in existing systems, leading to increased complexities and costs.
  • For instance, a study revealed that system integration accounted for over 30% of the total ITS project costs. The ITS market is expected to grow by more than 15% annually, driven by the increasing demand for efficient transportation and the integration of advanced technologies like IoT and AI. Operational technology systems lack the ability to integrate effectively, resulting in isolated functioning. To achieve a unified digital workflow, its essential to facilitate effective data sharing between machines and other systems for various ITS end-users. System integration involves combining diverse hardware and software components, such as traffic sensors, GPS devices, communication networks, and control centers. However, the heterogeneity of systems developed by different companies, each with proprietary standards and protocols, results in compatibility issues, escalating implementation costs, and delays in deployment.

Exclusive Customer Landscape

The intelligent transport system (ITS) market forecasting report includes the adoption lifecycle of the market, covering from the innovators stage to the laggards stage. It focuses on adoption rates in different regions based on penetration. Furthermore, the intelligent transport system (ITS) market report also includes key purchase criteria and drivers of price sensitivity to help companies evaluate and develop their market growth analysis strategies.
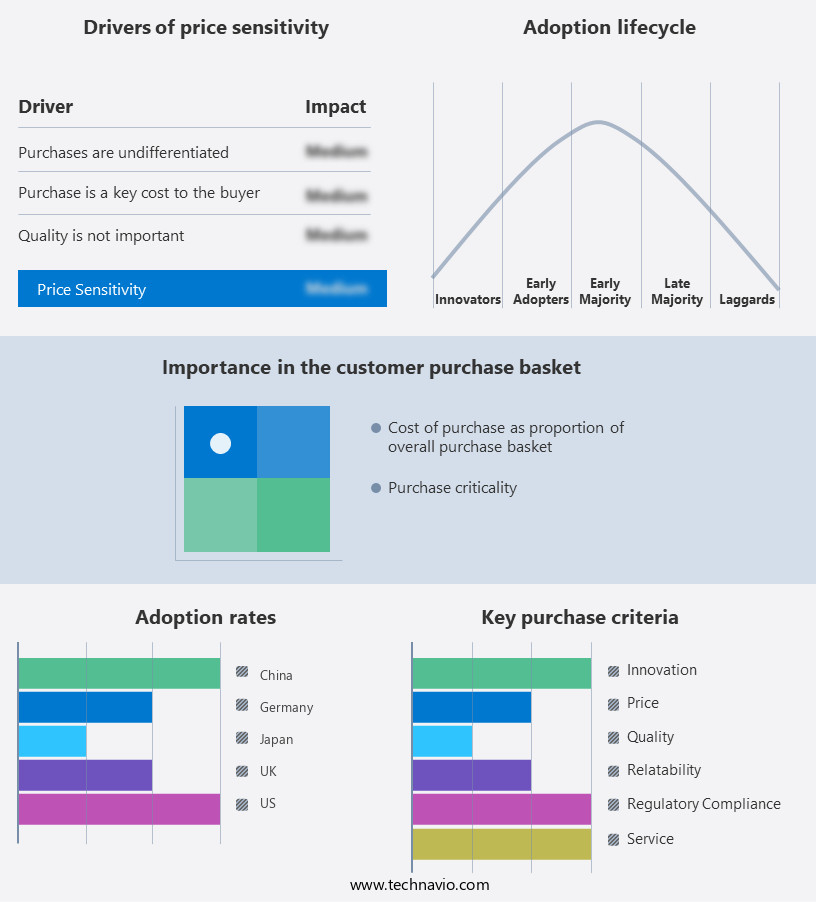
Intelligent Transport System (ITS) Market Share by Geography

 Customer Landscape

Key Companies & Market Insights

Companies are implementing various strategies, such as strategic alliances, intelligent transport system (ITS) market forecast, partnerships, mergers and acquisitions, geographical expansion, and product/service launches, to enhance their presence in the industry.

3M Co. - The company specializes in Intelligent Transport Systems (ITS) and delivers advanced mobility solutions, including the innovative 3M Smart Transportation platform.

The industry research and growth report includes detailed analyses of the competitive landscape of the market and information about key companies, including:

  • 3M Co.
  • Advantech Co. Ltd.
  • AECOM
  • Airbus SE
  • Axiomtek Co. Ltd.
  • Cubic Corp.
  • EFKON GmbH
  • GMV Innovating Solutions SL
  • Hitachi Ltd.
  • HR Green Inc.
  • Indra Sistemas SA
  • Iteris Inc.
  • Mundys S.p.A.
  • Serco Group Plc
  • SICE TyS
  • Siemens AG
  • Stantec Inc.
  • Sumitomo Electric Industries Ltd.
  • Teledyne Technologies Inc.
  • Thales Group

Qualitative and quantitative analysis of companies has been conducted to help clients understand the wider business environment as well as the strengths and weaknesses of key industry players. Data is qualitatively analyzed to categorize companies as pure play, category-focused, industry-focused, and diversified; it is quantitatively analyzed to categorize companies as dominant, leading, strong, tentative, and weak.

Recent Development and News in Intelligent Transport System (ITS) Market

  • In January 2024, TransCore Link, a leading provider of transportation management and tolling solutions, announced the launch of its new Intelligent Transport System (ITS) for public transit agencies. The system, named SmartConnect, offers real-time data analytics, automated fare collection, and demand-responsive services (TransCore Press Release, 2024).
  • In March 2024, Cisco Systems and TomTom announced a strategic partnership to integrate TomToms real-time traffic information and mapping services into Ciscos ITS offerings. This collaboration aims to enhance traffic management and improve overall transportation efficiency (Cisco Press Release, 2024).
  • In April 2025, Kapsch TrafficCom, an international provider of ITS solutions, secured a USD 100 million contract from the New York Metropolitan Transportation Authority (MTA) to modernize its traffic management system. The project includes the deployment of advanced sensors, real-time data analytics, and intelligent traffic signal control (MTA Press Release, 2025).
  • In May 2025, the European Union approved the deployment of the European Cooperative Intelligent Transport System (C-ITS), a large-scale ITS project aimed at improving road safety and traffic efficiency. The project involves the installation of roadside units and on-board units in vehicles, enabling real-time communication between vehicles and infrastructure (European Commission Press Release, 2025).

Research Analyst Overview

The market for Intelligent Transport Systems (ITS) continues to evolve, driven by advancements in technology and increasing travel demand. ITS applications span various sectors, including traffic management, public transport, and urban traffic control. For instance, traffic modeling software and real-time traffic information have led to a 15% reduction in traffic congestion in major cities. ITS systems integrate various components, such as data security measures, travel demand management, cost-benefit analysis, and traffic signal timing, to optimize network performance. ITS deployment strategies encompass sensor data fusion, predictive maintenance, and smart mobility solutions, aiming for system reliability assessment and traffic safety improvement.

The Intelligent Transport System (ITS) Market is advancing rapidly, with the vehicle-to-everything communication impact revolutionizing connectivity. Enhanced optimization algorithms for traffic flow and real-time data analysis for traffic management are improving urban mobility. Smart infrastructure relies on sensor network design for intelligent transport and robust data security protocols for ITS applications. Focusing on sustainable transportation solutions for smart cities supports environmental goals. Standardization through ITS communication protocols and standards ensures interoperability. A cloud-based platform for data management in ITS enables efficient data use. The impact of ITS on urban mobility patterns is significant, influencing city planning. Analysis of travel time data for route planning enhances commuter efficiency. Integration of fleet management system integration with ITS streamlines logistics. Lastly, ITS facilitates emergency vehicle response time improvement, ensuring faster interventions and safer cities.

The ITS market is expected to grow by over 10% annually, fueled by the integration of autonomous vehicle control, public transport integration, and sustainable transport planning. Urban traffic control and transit signal priority are essential components of this growth, as they enhance network capacity analysis and dynamic route optimization. Incident management strategies and integrated transport networks further contribute to the markets ongoing unfolding, ensuring optimal performance evaluation metrics and network performance metrics.

Dive into Technavios robust research methodology, blending expert interviews, extensive data synthesis, and validated models for unparalleled Intelligent Transport System (ITS) Market insights. See full methodology.

Market Scope

Report Coverage

Details

Page number

247

Base year

2024

Historic period

2019-2023

Forecast period

2025-2029

Growth momentum & CAGR

Accelerate at a CAGR of 10%

Market growth 2025-2029

USD 47.38 billion

Market structure

Fragmented

YoY growth 2024-2025(%)

8.8

Key countries

US, China, Germany, UK, Canada, France, Japan, India, Italy, and South Korea

Competitive landscape

Leading Companies, Market Positioning of Companies, Competitive Strategies, and Industry Risks

Request Free Sample

What are the Key Data Covered in this Intelligent Transport System (ITS) Market Research and Growth Report?

  • CAGR of the Intelligent Transport System (ITS) industry during the forecast period
  • Detailed information on factors that will drive the growth and forecasting between 2025 and 2029
  • Precise estimation of the size of the market and its contribution of the industry in focus to the parent market
  • Accurate predictions about upcoming growth and trends and changes in consumer behaviour
  • Growth of the market across North America, Europe, APAC, South America, and Middle East and Africa
  • Thorough analysis of the markets competitive landscape and detailed information about companies
  • Comprehensive analysis of factors that will challenge the intelligent transport system (ITS) market growth of industry companies

We can help! Our analysts can customize this intelligent transport system (its) market research report to meet your requirements.

Get in touch

1 Executive Summary

  • 1.1 Market overview
    • Executive Summary - Chart on Market Overview
    • Executive Summary - Data Table on Market Overview
    • Executive Summary - Chart on Global Market Characteristics
    • Executive Summary - Chart on Market by Geography
    • Executive Summary - Chart on Market Segmentation by Application
    • Executive Summary - Chart on Market Segmentation by Type
    • Executive Summary - Chart on Market Segmentation by Mode of Transportation
    • Executive Summary - Chart on Incremental Growth
    • Executive Summary - Data Table on Incremental Growth
    • Executive Summary - Chart on Company Market Positioning

2 Technavio Analysis

  • 2.1 Analysis of price sensitivity, lifecycle, customer purchase basket, adoption rates, and purchase criteria
    • Analysis of price sensitivity, lifecycle, customer purchase basket, adoption rates, and purchase criteria
  • 2.2 Criticality of inputs and Factors of differentiation
    • Overview on criticality of inputs and factors of differentiation
  • 2.3 Factors of disruption
    • Overview on factors of disruption
  • 2.4 Impact of drivers and challenges
    • Impact of drivers and challenges in 2024 and 2029

3 Market Landscape

  • 3.1 Market ecosystem
    • Parent Market
    • Data Table on - Parent Market
  • 3.2 Market characteristics
    • Market characteristics analysis
  • 3.3 Value chain analysis
    • Value chain analysis

4 Market Sizing

  • 4.1 Market definition
    • Offerings of companies included in the market definition
  • 4.2 Market segment analysis
    • Market segments
  • 4.3 Market size 2024
    • 4.4 Market outlook: Forecast for 2024-2029
      • Chart on Global - Market size and forecast 2024-2029 ($ million)
      • Data Table on Global - Market size and forecast 2024-2029 ($ million)
      • Chart on Global Market: Year-over-year growth 2024-2029 (%)
      • Data Table on Global Market: Year-over-year growth 2024-2029 (%)

    5 Historic Market Size

    • 5.1 Global Intelligent Transport System (ITS) Market 2019 - 2023
      • Historic Market Size - Data Table on Global Intelligent Transport System (ITS) Market 2019 - 2023 ($ million)
    • 5.2 Application segment analysis 2019 - 2023
      • Historic Market Size - Application Segment 2019 - 2023 ($ million)
    • 5.3 Type segment analysis 2019 - 2023
      • Historic Market Size - Type Segment 2019 - 2023 ($ million)
    • 5.4 Mode of Transportation segment analysis 2019 - 2023
      • Historic Market Size - Mode of Transportation Segment 2019 - 2023 ($ million)
    • 5.5 Geography segment analysis 2019 - 2023
      • Historic Market Size - Geography Segment 2019 - 2023 ($ million)
    • 5.6 Country segment analysis 2019 - 2023
      • Historic Market Size - Country Segment 2019 - 2023 ($ million)

    6 Qualitative Analysis

    • 6.1 The AI impact on Global intelligent transport system (ITS) market Market

      7 Five Forces Analysis

      • 7.1 Five forces summary
        • Five forces analysis - Comparison between 2024 and 2029
      • 7.2 Bargaining power of buyers
        • Bargaining power of buyers - Impact of key factors 2024 and 2029
      • 7.3 Bargaining power of suppliers
        • Bargaining power of suppliers - Impact of key factors in 2024 and 2029
      • 7.4 Threat of new entrants
        • Threat of new entrants - Impact of key factors in 2024 and 2029
      • 7.5 Threat of substitutes
        • Threat of substitutes - Impact of key factors in 2024 and 2029
      • 7.6 Threat of rivalry
        • Threat of rivalry - Impact of key factors in 2024 and 2029
      • 7.7 Market condition
        • Chart on Market condition - Five forces 2024 and 2029

      8 Market Segmentation by Application

      • 8.1 Market segments
        • Chart on Application - Market share 2024-2029 (%)
        • Data Table on Application - Market share 2024-2029 (%)
      • 8.2 Comparison by Application
        • Chart on Comparison by Application
        • Data Table on Comparison by Application
      • 8.3 Traffic management - Market size and forecast 2024-2029
        • Chart on Traffic management - Market size and forecast 2024-2029 ($ million)
        • Data Table on Traffic management - Market size and forecast 2024-2029 ($ million)
        • Chart on Traffic management - Year-over-year growth 2024-2029 (%)
        • Data Table on Traffic management - Year-over-year growth 2024-2029 (%)
      • 8.4 Toll management - Market size and forecast 2024-2029
        • Chart on Toll management - Market size and forecast 2024-2029 ($ million)
        • Data Table on Toll management - Market size and forecast 2024-2029 ($ million)
        • Chart on Toll management - Year-over-year growth 2024-2029 (%)
        • Data Table on Toll management - Year-over-year growth 2024-2029 (%)
      • 8.5 Automotive and infotainment telematics - Market size and forecast 2024-2029
        • Chart on Automotive and infotainment telematics - Market size and forecast 2024-2029 ($ million)
        • Data Table on Automotive and infotainment telematics - Market size and forecast 2024-2029 ($ million)
        • Chart on Automotive and infotainment telematics - Year-over-year growth 2024-2029 (%)
        • Data Table on Automotive and infotainment telematics - Year-over-year growth 2024-2029 (%)
      • 8.6 Public transport - Market size and forecast 2024-2029
        • Chart on Public transport - Market size and forecast 2024-2029 ($ million)
        • Data Table on Public transport - Market size and forecast 2024-2029 ($ million)
        • Chart on Public transport - Year-over-year growth 2024-2029 (%)
        • Data Table on Public transport - Year-over-year growth 2024-2029 (%)
      • 8.7 Others - Market size and forecast 2024-2029
        • Chart on Others - Market size and forecast 2024-2029 ($ million)
        • Data Table on Others - Market size and forecast 2024-2029 ($ million)
        • Chart on Others - Year-over-year growth 2024-2029 (%)
        • Data Table on Others - Year-over-year growth 2024-2029 (%)
      • 8.8 Market opportunity by Application
        • Market opportunity by Application ($ million)
        • Data Table on Market opportunity by Application ($ million)

      9 Market Segmentation by Type

      • 9.1 Market segments
        • Chart on Type - Market share 2024-2029 (%)
        • Data Table on Type - Market share 2024-2029 (%)
      • 9.2 Comparison by Type
        • Chart on Comparison by Type
        • Data Table on Comparison by Type
      • 9.3 Advanced traffic management system - Market size and forecast 2024-2029
        • Chart on Advanced traffic management system - Market size and forecast 2024-2029 ($ million)
        • Data Table on Advanced traffic management system - Market size and forecast 2024-2029 ($ million)
        • Chart on Advanced traffic management system - Year-over-year growth 2024-2029 (%)
        • Data Table on Advanced traffic management system - Year-over-year growth 2024-2029 (%)
      • 9.4 Advanced traveller information system - Market size and forecast 2024-2029
        • Chart on Advanced traveller information system - Market size and forecast 2024-2029 ($ million)
        • Data Table on Advanced traveller information system - Market size and forecast 2024-2029 ($ million)
        • Chart on Advanced traveller information system - Year-over-year growth 2024-2029 (%)
        • Data Table on Advanced traveller information system - Year-over-year growth 2024-2029 (%)
      • 9.5 Advanced public transportation system - Market size and forecast 2024-2029
        • Chart on Advanced public transportation system - Market size and forecast 2024-2029 ($ million)
        • Data Table on Advanced public transportation system - Market size and forecast 2024-2029 ($ million)
        • Chart on Advanced public transportation system - Year-over-year growth 2024-2029 (%)
        • Data Table on Advanced public transportation system - Year-over-year growth 2024-2029 (%)
      • 9.6 Advanced transportation pricing system - Market size and forecast 2024-2029
        • Chart on Advanced transportation pricing system - Market size and forecast 2024-2029 ($ million)
        • Data Table on Advanced transportation pricing system - Market size and forecast 2024-2029 ($ million)
        • Chart on Advanced transportation pricing system - Year-over-year growth 2024-2029 (%)
        • Data Table on Advanced transportation pricing system - Year-over-year growth 2024-2029 (%)
      • 9.7 Others - Market size and forecast 2024-2029
        • Chart on Others - Market size and forecast 2024-2029 ($ million)
        • Data Table on Others - Market size and forecast 2024-2029 ($ million)
        • Chart on Others - Year-over-year growth 2024-2029 (%)
        • Data Table on Others - Year-over-year growth 2024-2029 (%)
      • 9.8 Market opportunity by Type
        • Market opportunity by Type ($ million)
        • Data Table on Market opportunity by Type ($ million)

      10 Market Segmentation by Mode of Transportation

      • 10.1 Market segments
        • Chart on Mode of Transportation - Market share 2024-2029 (%)
        • Data Table on Mode of Transportation - Market share 2024-2029 (%)
      • 10.2 Comparison by Mode of Transportation
        • Chart on Comparison by Mode of Transportation
        • Data Table on Comparison by Mode of Transportation
      • 10.3 Roadway - Market size and forecast 2024-2029
        • Chart on Roadway - Market size and forecast 2024-2029 ($ million)
        • Data Table on Roadway - Market size and forecast 2024-2029 ($ million)
        • Chart on Roadway - Year-over-year growth 2024-2029 (%)
        • Data Table on Roadway - Year-over-year growth 2024-2029 (%)
      • 10.4 Railway - Market size and forecast 2024-2029
        • Chart on Railway - Market size and forecast 2024-2029 ($ million)
        • Data Table on Railway - Market size and forecast 2024-2029 ($ million)
        • Chart on Railway - Year-over-year growth 2024-2029 (%)
        • Data Table on Railway - Year-over-year growth 2024-2029 (%)
      • 10.5 Airway - Market size and forecast 2024-2029
        • Chart on Airway - Market size and forecast 2024-2029 ($ million)
        • Data Table on Airway - Market size and forecast 2024-2029 ($ million)
        • Chart on Airway - Year-over-year growth 2024-2029 (%)
        • Data Table on Airway - Year-over-year growth 2024-2029 (%)
      • 10.6 Maritime - Market size and forecast 2024-2029
        • Chart on Maritime - Market size and forecast 2024-2029 ($ million)
        • Data Table on Maritime - Market size and forecast 2024-2029 ($ million)
        • Chart on Maritime - Year-over-year growth 2024-2029 (%)
        • Data Table on Maritime - Year-over-year growth 2024-2029 (%)
      • 10.7 Market opportunity by Mode of Transportation
        • Market opportunity by Mode of Transportation ($ million)
        • Data Table on Market opportunity by Mode of Transportation ($ million)

      11 Customer Landscape

      • 11.1 Customer landscape overview
        • Analysis of price sensitivity, lifecycle, customer purchase basket, adoption rates, and purchase criteria

      12 Geographic Landscape

      • 12.1 Geographic segmentation
        • Chart on Market share by geography 2024-2029 (%)
        • Data Table on Market share by geography 2024-2029 (%)
      • 12.2 Geographic comparison
        • Chart on Geographic comparison
        • Data Table on Geographic comparison
      • 12.3 North America - Market size and forecast 2024-2029
        • Chart on North America - Market size and forecast 2024-2029 ($ million)
        • Data Table on North America - Market size and forecast 2024-2029 ($ million)
        • Chart on North America - Year-over-year growth 2024-2029 (%)
        • Data Table on North America - Year-over-year growth 2024-2029 (%)
      • 12.4 Europe - Market size and forecast 2024-2029
        • Chart on Europe - Market size and forecast 2024-2029 ($ million)
        • Data Table on Europe - Market size and forecast 2024-2029 ($ million)
        • Chart on Europe - Year-over-year growth 2024-2029 (%)
        • Data Table on Europe - Year-over-year growth 2024-2029 (%)
      • 12.5 APAC - Market size and forecast 2024-2029
        • Chart on APAC - Market size and forecast 2024-2029 ($ million)
        • Data Table on APAC - Market size and forecast 2024-2029 ($ million)
        • Chart on APAC - Year-over-year growth 2024-2029 (%)
        • Data Table on APAC - Year-over-year growth 2024-2029 (%)
      • 12.6 South America - Market size and forecast 2024-2029
        • Chart on South America - Market size and forecast 2024-2029 ($ million)
        • Data Table on South America - Market size and forecast 2024-2029 ($ million)
        • Chart on South America - Year-over-year growth 2024-2029 (%)
        • Data Table on South America - Year-over-year growth 2024-2029 (%)
      • 12.7 Middle East and Africa - Market size and forecast 2024-2029
        • Chart on Middle East and Africa - Market size and forecast 2024-2029 ($ million)
        • Data Table on Middle East and Africa - Market size and forecast 2024-2029 ($ million)
        • Chart on Middle East and Africa - Year-over-year growth 2024-2029 (%)
        • Data Table on Middle East and Africa - Year-over-year growth 2024-2029 (%)
      • 12.8 US - Market size and forecast 2024-2029
        • Chart on US - Market size and forecast 2024-2029 ($ million)
        • Data Table on US - Market size and forecast 2024-2029 ($ million)
        • Chart on US - Year-over-year growth 2024-2029 (%)
        • Data Table on US - Year-over-year growth 2024-2029 (%)
      • 12.9 China - Market size and forecast 2024-2029
        • Chart on China - Market size and forecast 2024-2029 ($ million)
        • Data Table on China - Market size and forecast 2024-2029 ($ million)
        • Chart on China - Year-over-year growth 2024-2029 (%)
        • Data Table on China - Year-over-year growth 2024-2029 (%)
      • 12.10 Germany - Market size and forecast 2024-2029
        • Chart on Germany - Market size and forecast 2024-2029 ($ million)
        • Data Table on Germany - Market size and forecast 2024-2029 ($ million)
        • Chart on Germany - Year-over-year growth 2024-2029 (%)
        • Data Table on Germany - Year-over-year growth 2024-2029 (%)
      • 12.11 UK - Market size and forecast 2024-2029
        • Chart on UK - Market size and forecast 2024-2029 ($ million)
        • Data Table on UK - Market size and forecast 2024-2029 ($ million)
        • Chart on UK - Year-over-year growth 2024-2029 (%)
        • Data Table on UK - Year-over-year growth 2024-2029 (%)
      • 12.12 Canada - Market size and forecast 2024-2029
        • Chart on Canada - Market size and forecast 2024-2029 ($ million)
        • Data Table on Canada - Market size and forecast 2024-2029 ($ million)
        • Chart on Canada - Year-over-year growth 2024-2029 (%)
        • Data Table on Canada - Year-over-year growth 2024-2029 (%)
      • 12.13 France - Market size and forecast 2024-2029
        • Chart on France - Market size and forecast 2024-2029 ($ million)
        • Data Table on France - Market size and forecast 2024-2029 ($ million)
        • Chart on France - Year-over-year growth 2024-2029 (%)
        • Data Table on France - Year-over-year growth 2024-2029 (%)
      • 12.14 Japan - Market size and forecast 2024-2029
        • Chart on Japan - Market size and forecast 2024-2029 ($ million)
        • Data Table on Japan - Market size and forecast 2024-2029 ($ million)
        • Chart on Japan - Year-over-year growth 2024-2029 (%)
        • Data Table on Japan - Year-over-year growth 2024-2029 (%)
      • 12.15 India - Market size and forecast 2024-2029
        • Chart on India - Market size and forecast 2024-2029 ($ million)
        • Data Table on India - Market size and forecast 2024-2029 ($ million)
        • Chart on India - Year-over-year growth 2024-2029 (%)
        • Data Table on India - Year-over-year growth 2024-2029 (%)
      • 12.16 Italy - Market size and forecast 2024-2029
        • Chart on Italy - Market size and forecast 2024-2029 ($ million)
        • Data Table on Italy - Market size and forecast 2024-2029 ($ million)
        • Chart on Italy - Year-over-year growth 2024-2029 (%)
        • Data Table on Italy - Year-over-year growth 2024-2029 (%)
      • 12.17 South Korea - Market size and forecast 2024-2029
        • Chart on South Korea - Market size and forecast 2024-2029 ($ million)
        • Data Table on South Korea - Market size and forecast 2024-2029 ($ million)
        • Chart on South Korea - Year-over-year growth 2024-2029 (%)
        • Data Table on South Korea - Year-over-year growth 2024-2029 (%)
      • 12.18 Market opportunity by geography
        • Market opportunity by geography ($ million)
        • Data Tables on Market opportunity by geography ($ million)

      13 Drivers, Challenges, and Opportunity/Restraints

      • 13.1 Market drivers
        • 13.2 Market challenges
          • 13.3 Impact of drivers and challenges
            • Impact of drivers and challenges in 2024 and 2029
          • 13.4 Market opportunities/restraints

            14 Competitive Landscape

            • 14.1 Overview
              • 14.2 Competitive Landscape
                • Overview on criticality of inputs and factors of differentiation
              • 14.3 Landscape disruption
                • Overview on factors of disruption
              • 14.4 Industry risks
                • Impact of key risks on business

              15 Competitive Analysis

              • 15.1 Companies profiled
                • Companies covered
              • 15.2 Company ranking index
                • Company ranking index
              • 15.3 Market positioning of companies
                • Matrix on companies position and classification
              • 3M Co.
                • 3M Co. - Overview
                • 3M Co. - Business segments
                • 3M Co. - Key news
                • 3M Co. - Key offerings
                • 3M Co. - Segment focus
                • SWOT
              • 15.5 Advantech Co. Ltd.
                • Advantech Co. Ltd. - Overview
                • Advantech Co. Ltd. - Business segments
                • Advantech Co. Ltd. - Key news
                • Advantech Co. Ltd. - Key offerings
                • Advantech Co. Ltd. - Segment focus
                • SWOT
              • 15.6 Airbus SE
                • Airbus SE - Overview
                • Airbus SE - Business segments
                • Airbus SE - Key news
                • Airbus SE - Key offerings
                • Airbus SE - Segment focus
                • SWOT
              • 15.7 Axiomtek Co. Ltd.
                • Axiomtek Co. Ltd. - Overview
                • Axiomtek Co. Ltd. - Product / Service
                • Axiomtek Co. Ltd. - Key offerings
                • SWOT
              • 15.8 Cubic Corp.
                • Cubic Corp. - Overview
                • Cubic Corp. - Product / Service
                • Cubic Corp. - Key offerings
                • SWOT
              • 15.9 EFKON GmbH
                • EFKON GmbH - Overview
                • EFKON GmbH - Product / Service
                • EFKON GmbH - Key offerings
                • SWOT
              • 15.10 Hitachi Ltd.
                • Hitachi Ltd. - Overview
                • Hitachi Ltd. - Business segments
                • Hitachi Ltd. - Key news
                • Hitachi Ltd. - Key offerings
                • Hitachi Ltd. - Segment focus
                • SWOT
              • 15.11 Indra Sistemas SA
                • Indra Sistemas SA - Overview
                • Indra Sistemas SA - Business segments
                • Indra Sistemas SA - Key news
                • Indra Sistemas SA - Key offerings
                • Indra Sistemas SA - Segment focus
                • SWOT
              • 15.12 Iteris Inc.
                • Iteris Inc. - Overview
                • Iteris Inc. - Business segments
                • Iteris Inc. - Key offerings
                • Iteris Inc. - Segment focus
                • SWOT
              • 15.13 Serco Group Plc
                • Serco Group Plc - Overview
                • Serco Group Plc - Business segments
                • Serco Group Plc - Key offerings
                • Serco Group Plc - Segment focus
                • SWOT
              • 15.14 Siemens AG
                • Siemens AG - Overview
                • Siemens AG - Business segments
                • Siemens AG - Key news
                • Siemens AG - Key offerings
                • Siemens AG - Segment focus
                • SWOT
              • 15.15 Stantec Inc.
                • Stantec Inc. - Overview
                • Stantec Inc. - Business segments
                • Stantec Inc. - Key news
                • Stantec Inc. - Key offerings
                • Stantec Inc. - Segment focus
                • SWOT
              • 15.16 Sumitomo Electric Industries Ltd.
                • Sumitomo Electric Industries Ltd. - Overview
                • Sumitomo Electric Industries Ltd. - Business segments
                • Sumitomo Electric Industries Ltd. - Key news
                • Sumitomo Electric Industries Ltd. - Key offerings
                • Sumitomo Electric Industries Ltd. - Segment focus
                • SWOT
              • 15.17 Teledyne Technologies Inc.
                • Teledyne Technologies Inc. - Overview
                • Teledyne Technologies Inc. - Business segments
                • Teledyne Technologies Inc. - Key news
                • Teledyne Technologies Inc. - Key offerings
                • Teledyne Technologies Inc. - Segment focus
                • SWOT
              • 15.18 Thales Group
                • Thales Group - Overview
                • Thales Group - Business segments
                • Thales Group - Key news
                • Thales Group - Key offerings
                • Thales Group - Segment focus
                • SWOT

              16 Appendix

              • 16.1 Scope of the report
                • 16.2 Inclusions and exclusions checklist
                  • Inclusions checklist
                  • Exclusions checklist
                • 16.3 Currency conversion rates for US$
                  • Currency conversion rates for US$
                • 16.4 Research methodology
                  • Research methodology
                • 16.5 Data procurement
                  • Information sources
                • 16.6 Data validation
                  • Data validation
                • 16.7 Validation techniques employed for market sizing
                  • Validation techniques employed for market sizing
                • 16.8 Data synthesis
                  • Data synthesis
                • 16.9 360 degree market analysis
                  • 360 degree market analysis
                • 16.10 List of abbreviations
                  • List of abbreviations

                Research Methodology

                Technavio presents a detailed picture of the market by way of study, synthesis, and summation of data from multiple sources. The analysts have presented the various facets of the market with a particular focus on identifying the key industry influencers. The data thus presented is comprehensive, reliable, and the result of extensive research, both primary and secondary.

                INFORMATION SOURCES

                Primary sources

                • Manufacturers and suppliers
                • Channel partners
                • Industry experts
                • Strategic decision makers

                Secondary sources

                • Industry journals and periodicals
                • Government data
                • Financial reports of key industry players
                • Historical data
                • Press releases

                DATA ANALYSIS

                Data Synthesis

                • Collation of data
                • Estimation of key figures
                • Analysis of derived insights

                Data Validation

                • Triangulation with data models
                • Reference against proprietary databases
                • Corroboration with industry experts

                REPORT WRITING

                Qualitative

                • Market drivers
                • Market challenges
                • Market trends
                • Five forces analysis

                Quantitative

                • Market size and forecast
                • Market segmentation
                • Geographical insights
                • Competitive landscape

                Interested in this report?

                Get your sample now to see our research methodology and insights!

                Download Now

                Frequently Asked Questions

                Intelligent Transport System (Its) market growth will increase by $ 47378.9 mn during 2025-2029.

                The Intelligent Transport System (Its) market is expected to grow at a CAGR of 10% during 2025-2029.

                Intelligent Transport System (Its) market is segmented by Application( Traffic management, Toll management, Automotive and infotainment telematics, Public transport, Others) Type( Advanced traffic management system, Advanced traveller information system, Advanced public transportation system, Advanced transportation pricing system, Others) Mode Of Transportation( Roadway, Railway, Airway, Maritime, Middle East and Africa)

                3M Co., Advantech Co. Ltd., AECOM, Airbus SE, Axiomtek Co. Ltd., Cubic Corp., EFKON GmbH, GMV Innovating Solutions SL, Hitachi Ltd., HR Green Inc., Indra Sistemas SA, Iteris Inc., Mundys S.p.A., Serco Group Plc, SICE TyS, Siemens AG, Stantec Inc., Sumitomo Electric Industries Ltd., Teledyne Technologies Inc., Thales Group are a few of the key vendors in the Intelligent Transport System (Its) market.

                North America will register the highest growth rate of 34% among the other regions. Therefore, the Intelligent Transport System (Its) market in North America is expected to garner significant business opportunities for the vendors during the forecast period.

                US, China, Germany, UK, Canada, France, Japan, India, Italy, South Korea

                • Increasing traffic congestion and road accidentsGrowing urbanization and the ever-rising use of automobiles is the driving factor this market.
                • primarily because of the rising middle-class population and their increasing disposable income is the driving factor this market.
                • are intensifying traffic congestion worldwide. These factors are more prevalent in developing countries such as India and China than in developed countries. Increased disposable income is fueling the sales of automobiles and urbanization in developing countries. Government organizations in developing countries are implementing ITS solutions such as congestion charges is the driving factor this market.
                • road user charges is the driving factor this market.
                • and electronic toll collection to control traffic congestion. One of the primary causes of traffic congestion is the lack of real-time traffic management. ITS enables dynamic traffic control through systems like adaptive traffic signals is the driving factor this market.
                • real-time traffic monitoring is the driving factor this market.
                • and incident detection is the driving factor this market.
                • which help optimize traffic flow and reduce bottlenecks. For example is the driving factor this market.
                • GPS-based navigation systems integrated with ITS can suggest alternate routes to drivers is the driving factor this market.
                • thereby distributing traffic more evenly across the network. Road accidents often result from human error is the driving factor this market.
                • poor visibility is the driving factor this market.
                • and inadequate response times. ITS enhances road safety through automated warning systems is the driving factor this market.
                • vehicle-to-vehicle (V2V) and vehicle-to-infrastructure (V2I) communication is the driving factor this market.
                • and smart surveillance. These technologies can alert drivers about potential hazards is the driving factor this market.
                • such as sudden braking by vehicles ahead or slippery road conditions is the driving factor this market.
                • allowing for timely preventive action.Improper traffic management is the driving factor this market.
                • especially in developing regions is the driving factor this market.
                • is another major factor for the increasing traffic congestion and rising number of road accidents. With the increasing number of road accidents is the driving factor this market.
                • the demand for smart traffic management systems (part of ITS solutions) is rising. Developing countries account for 93% of the total road accidents across the world. Inadequate law enforcement is the driving factor this market.
                • unsafe road infrastructure is the driving factor this market.
                • and improper traffic management are the key reasons for road accidents in these countries. The above-mentioned factors drive the demand for ITS across the world and hence drive the growth of the global intelligent transport system (ITS) market during the forecast period. is the driving factor this market.

                The Intelligent Transport System (Its) market vendors should focus on grabbing business opportunities from the Traffic management segment as it accounted for the largest market share in the base year.