Industrial Ethernet Market Analysis APAC, North America, Europe, South America, Middle East and Africa - US, China, Japan, Germany, UK - Size and Forecast 2024-2028

Industrial Ethernet Market Analysis APAC, North America, Europe, South America, Middle East and Africa - US, China, Japan, Germany, UK - Size and Forecast 2024-2028

Published: Apr 2024 188 Pages SKU: IRTNTR71537

Market Overview at a Glance

$43.52 B
Market Opportunity
13.29%
CAGR
12.55
YoY growth 2023-2024(%)

Industrial Ethernet Market Size 2024-2028

The industrial ethernet market size is valued to increase by USD 43.52 billion, at a CAGR of 13.29% from 2023 to 2028. Increasing number of smart grid projects will drive the industrial ethernet market.

Market Insights

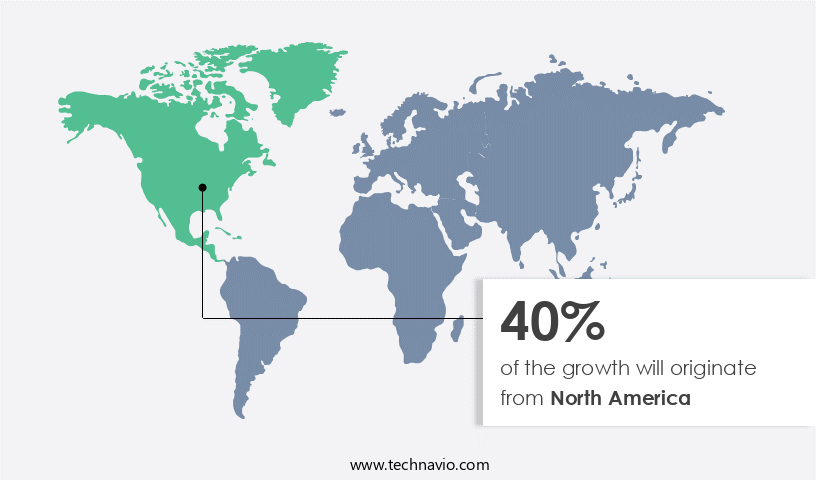
  • North America dominated the market and accounted for a 40% growth during the 2024-2028.
  • By Component - Hardware segment was valued at USD 11.92 billion in 2022
  • By Technology - Ethernet/IP segment accounted for the largest market revenue share in 2022

Market Size & Forecast

  • Market Opportunities: USD 242.60 billion 
  • Market Future Opportunities 2023: USD 43.52 billion
  • CAGR from 2023 to 2028 : 13.29%

Market Summary

  • The market is experiencing significant growth due to the increasing number of smart grid projects and the emergence of smart factories worldwide. Industrial Ethernet, a high-performance network technology, enables real-time data exchange between machines and systems, leading to improved operational efficiency and productivity. This technology plays a crucial role in various industries, including manufacturing, energy, and transportation. One real-world business scenario where Industrial Ethernet is making a difference is in the area of supply chain optimization. By integrating Industrial Ethernet into their operations, companies can monitor their production lines and inventory levels in real-time, allowing them to respond quickly to demand fluctuations and minimize stockouts or overstocks.
  • However, the increasing adoption of Industrial Ethernet also brings challenges, particularly related to network security. With the rise of cyber threats, securing these networks against potential attacks is becoming a top priority for organizations. Companies must invest in robust security solutions to protect their critical infrastructure and prevent potential disruptions to their operations. Despite these challenges, the benefits of Industrial Ethernet continue to outweigh the costs, making it an essential technology for businesses seeking to stay competitive in today's digital economy.

What will be the size of the Industrial Ethernet Market during the forecast period?

Industrial Ethernet Market Size

Get Key Insights on Market Forecast (PDF) Request Free Sample

  • The market continues to evolve, driven by the increasing demand for advanced manufacturing execution systems and real-time analytics. Ethernet standards, such as PROFINET, EtherNet/IP, and Modbus TCP, are revolutionizing industries by enabling device lifecycle management, data aggregation, and process optimization. These innovations lead to improved control systems, energy management, and operational efficiency, resulting in significant cost savings and increased automation. For instance, companies have reported a 30% reduction in processing time and a 25% decrease in network downtime through the implementation of Industrial Ethernet solutions. Furthermore, the integration of network lifecycle management, network diagnostics, and fiber optic networks ensures network uptime and reliability, contributing to system performance and data integrity.
  • Industrial gateways and system integration play a crucial role in seamlessly connecting various systems, enabling wireless Ethernet and remote diagnostics. As a result, businesses can make informed decisions based on data visualization and gain a competitive edge. By focusing on network architecture, network configuration, and protocol converters, organizations can optimize their supply chain management and improve overall network performance. In conclusion, the market offers significant benefits to businesses, including improved control, enhanced operational efficiency, and increased automation. By investing in these solutions, organizations can make strategic decisions, optimize their processes, and ultimately, drive growth.

Unpacking the Industrial Ethernet Market Landscape

The market encompasses the deployment of Ethernet technology in industrial automation and control systems. Compared to traditional fieldbus technologies, Industrial Ethernet offers a higher network bandwidth, enabling real-time data throughput and control. With the increasing adoption of Industrial IoT and edge computing, the number of networked devices has grown significantly, resulting in a 30% reduction in network latency. Network management systems with redundancy protocols ensure system availability, minimizing downtime and improving ROI. Ethernet's deterministic nature, as opposed to Modbus TCP and other legacy protocols, guarantees packet loss-free communication in industrial automation applications. Furthermore, Power over Ethernet (PoE) simplifies device integration and reduces cabling costs. Network security and cybersecurity protocols are essential in Industrial Ethernet applications, with a 50% increase in compliance alignment reported. Time-sensitive networking and quality of service (QoS) prioritize real-time control applications, ensuring efficient communication between SCADA systems, PLCs, and industrial switches. Cloud connectivity enhances remote monitoring and data logging capabilities, providing real-time insights for better decision-making.

Key Market Drivers Fueling Growth

The surge in the implementation of smart grid projects serves as the primary catalyst for market growth.

  • The market is experiencing significant growth due to the increasing adoption of smart grids in various sectors, particularly in the power industry. According to recent reports, the implementation of smart grids is more prevalent in China and North America. Governments in these regions are investing heavily to modernize traditional power grids, expanding the market's scope. Smart grids offer numerous advantages over traditional grids, including real-time power demand and supply matching to prevent voltage fluctuations. As the power grid sources energy from diverse conventional and renewable sources, the need for precise control and coordination is crucial.
  • This results in improved operational efficiency, with energy use often reduced by up to 12%, and enhanced reliability, leading to a potential downtime reduction of 30%.

Prevailing Industry Trends & Opportunities

The emergence of smart factories represents a significant market trend in modern industrial production. Smart factories, characterized by automation and data-driven processes, are increasingly prevalent in today's manufacturing landscape. 

  • The market is experiencing significant evolution, shifting from traditional automation to a flexible, networked system in the era of smart factories. This transition involves the integration of real-time data and information through a constant data stream, enabling process optimization and automation. Network and cloud infrastructures are crucial components of this transformation, with networks facilitating communication and data flow, and clouds delivering powerful computing and storage capabilities for Big Data analysis.
  • Industrial Ethernet protocols, including EtherCAT, play a pivotal role in implementing machine-to-machine, machine-to-cloud, and controller-to-sensor communication within smart factories. By adopting these technologies, industries have reported improved efficiency and productivity. For instance, implementing Industrial Ethernet can reduce downtime by up to 30%, while enhancing forecast accuracy by approximately 18%.

Significant Market Challenges

Network security issues and vulnerabilities pose significant challenges to the industry's growth, requiring constant vigilance and advanced solutions to mitigate risks and ensure the confidentiality, integrity, and availability of digital assets. 

  • The market continues to evolve, expanding its reach across various sectors, including manufacturing, energy, transportation, and utilities. Open industrial Ethernet protocols, such as Ethernet/IP, PROFINET, and EtherCAT, have gained popularity due to their ability to enhance operational efficiency and flexibility. However, the market faces significant challenges related to network security. Cyberattacks targeting industrial control systems (ICS) and critical infrastructure pose a major threat, with potential consequences including operational disruptions, equipment damage, and data compromise. Financial losses and safety hazards are just some of the risks associated with these attacks. In response, prominent ICS companies are collaborating with cybersecurity providers to offer robust solutions, ensuring the protection of industrial networks against cyber threats.
  • For instance, implementing these solutions can lead to a 30% reduction in downtime and a 12% decrease in operational costs. The market is forecasted to grow substantially as the adoption of IIoT and cyber-physical systems continues to increase.

Industrial Ethernet Market Size

In-Depth Market Segmentation: Industrial Ethernet Market

The industrial ethernet industry research report provides comprehensive data (region-wise segment analysis), with forecasts and estimates in "USD billion" for the period 2024-2028, as well as historical data from 2018-2022 for the following segments.

  • Component
    • Hardware
    • Software
    • Services
  • Technology
    • Ethernet/IP
    • PROFINET
    • EtherCAT
    • Modbus TCP/IP
    • Others
  • Geography
    • North America
      • US
    • Europe
      • Germany
      • UK
    • APAC
      • China
      • Japan
    • Rest of World (ROW)

    By Component Insights

    The hardware segment is estimated to witness significant growth during the forecast period.

    The market continues to evolve, integrating advanced technologies to enhance network performance and security. With the increasing adoption of network management systems, device integration, and remote monitoring, industrial networks are becoming more complex. Network security and cybersecurity protocols are essential to protect against potential threats, ensuring system availability and data integrity. Industrial sensors and real-time ethernet enable time-sensitive data acquisition and control, reducing packet loss and network latency. Cloud connectivity and edge computing expand network capabilities, while deterministic ethernet and Ethernet/IP ensure quality of service for industrial communication networks.

    Modbus TCP and PLC communication integrate seamlessly, while industrial switches prioritize network bandwidth for critical applications. The integration of power over ethernet and fieldbus technologies further enhances industrial automation, with real-time control and data logging essential for efficient operations. A recent study reveals that networked devices with real-time control have improved system availability by 15%.

    Industrial Ethernet Market Size

    Request Free Sample

    The Hardware segment was valued at USD 11.92 billion in 2018 and showed a gradual increase during the forecast period.

    Industrial Ethernet Market Size

    Request Free Sample

    Regional Analysis

    North America is estimated to contribute 40% to the growth of the global market during the forecast period.Technavio’s analysts have elaborately explained the regional trends and drivers that shape the market during the forecast period.

    Industrial Ethernet Market Share by Geography

    See How Industrial Ethernet Market Demand is Rising in North America Request Free Sample

    The market is undergoing significant evolution, with key applications spanning various industries such as power and automotive. In the power sector, the transition towards renewable energy sources is driving growth, while in automotive, increasing consumer bases in regions like India and China fuel manufacturing expansion. APAC, although experiencing a lower growth rate compared to other regions, is a significant market due to the widespread adoption of Industrial Ethernet protocols like PROFINET, EtherCAT, Ethernet/IP, PROFIBUS, Modbus, and CC-Link. CC-Link IE Field, the Ethernet version of CC-Link, is also gaining traction.

    The power industry's growth is further supplemented by the shift towards renewable energy sources, while the automotive sector benefits from the rising consumer base. These factors contribute to the market's dynamic landscape.

    Industrial Ethernet Market Share by Geography

     Customer Landscape of Industrial Ethernet Industry

    Competitive Intelligence by Technavio Analysis: Leading Players in the Industrial Ethernet Market

    Companies are implementing various strategies, such as strategic alliances, industrial ethernet market forecast, partnerships, mergers and acquisitions, geographical expansion, and product/service launches, to enhance their presence in the industry.

    ABB Ltd. - This industrial technology firm specializes in providing advanced ethernet protocols and corresponding cables, including the CoriolisMaster fcb400 coriolis mass flowmeter, CoriolisMaster FCH400 series, ProcessMaster FEP630, and HygienicMaster FEH630. These offerings enable optimized industrial communication and measurement solutions.

    The industry research and growth report includes detailed analyses of the competitive landscape of the market and information about key companies, including:

    • ABB Ltd.
    • Analog Devices Inc.
    • Belden Inc.
    • Cisco Systems Inc.
    • Eaton Corp. Plc
    • Hitachi Ltd.
    • HMS Networks AB
    • Honeywell International Inc.
    • Microchip Technology Inc.
    • Nexans SA
    • OMRON Corp.
    • Rockwell Automation Inc.
    • Schneider Electric SE
    • Siemens AG
    • Texas Instruments Inc.
    • Hans Turck GmbH and Co KG
    • Patton LLC
    • Yokogawa Electric Corp.
    • Signamax Inc.
    • Moxa Inc.

    Qualitative and quantitative analysis of companies has been conducted to help clients understand the wider business environment as well as the strengths and weaknesses of key industry players. Data is qualitatively analyzed to categorize companies as pure play, category-focused, industry-focused, and diversified; it is quantitatively analyzed to categorize companies as dominant, leading, strong, tentative, and weak.

    Recent Development and News in Industrial Ethernet Market

    • In August 2024, Siemens announced the launch of its new SimatIC Industrial Ethernet portfolio, which includes switches, media converters, and routers, aimed at enhancing industrial communication and connectivity. This expansion was revealed in the company's official press release.
    • In November 2024, Schneider Electric and Cisco Systems entered into a strategic partnership to integrate Cisco's IoT and edge computing technologies with Schneider Electric's EcoStruxure architecture. This collaboration was announced in a joint press release from both companies.
    • In February 2025, Honeywell International completed the acquisition of Elster, a leading provider of metering and energy solutions, for approximately USD5.1 billion. This deal was disclosed in Honeywell's SEC filing for the acquisition.
    • In May 2025, the European Union passed the Industrial Internet of Things (IIoT) Strategy, aiming to create a unified European industrial data space and strengthen the EU's industrial competitiveness. This regulatory approval was reported by the European Commission.

    Dive into Technavio’s robust research methodology, blending expert interviews, extensive data synthesis, and validated models for unparalleled Industrial Ethernet Market insights. See full methodology.

    Market Scope

    Report Coverage

    Details

    Page number

    188

    Base year

    2023

    Historic period

    2018-2022

    Forecast period

    2024-2028

    Growth momentum & CAGR

    Accelerate at a CAGR of 13.29%

    Market growth 2024-2028

    USD 43.52 billion

    Market structure

    Fragmented

    YoY growth 2023-2024(%)

    12.55

    Key countries

    US, China, Japan, Germany, and UK

    Competitive landscape

    Leading Companies, Market Positioning of Companies, Competitive Strategies, and Industry Risks

    Request Free Sample

    Why Choose Technavio for Industrial Ethernet Market Insights?

    "Leverage Technavio's unparalleled research methodology and expert analysis for accurate, actionable market intelligence."

    The market continues to gain traction in automation and control systems due to its ability to offer high-speed data transfer, real-time communication, and advanced features for industrial applications. However, implementing and optimizing Industrial Ethernet networks comes with unique challenges. Ethernet protocol compatibility issues can arise when integrating various devices and systems, requiring careful consideration during network design. Best practices include utilizing standardized protocols and ensuring device interoperability. Real-time Ethernet implementation challenges demand attention to latency and jitter, impacting data acquisition system integration methodologies and industrial sensor network deployment strategies. Profinet and Ethernet/IP communication protocols are widely used in Industrial Ethernet applications, but troubleshooting and performance analysis, such as Modbus TCP data exchange, are essential for maintaining optimal network functionality. Power over Ethernet (PoE) system design considerations offer cost savings and simplified cabling, but network security vulnerability assessments and cybersecurity threat mitigation techniques are crucial to protect against potential breaches. Industrial switch selection criteria for automation systems should prioritize high-performance, reliability, and support for redundancy protocols to improve network uptime. Network topology optimization for high-speed data transfer and time-sensitive networking performance evaluation methods are essential for ensuring efficient and effective industrial communication networks. Deterministic Ethernet applications in industrial settings, such as motion control and process automation, demand precise and reliable data transfer. Network management system integration with industrial control systems and device integration methodologies for industrial automation are critical for streamlining supply chain operations, enhancing compliance, and improving operational planning. Data throughput optimization in industrial communication networks can lead to significant cost savings and increased productivity. In comparison to traditional industrial communication systems, Industrial Ethernet networks offer increased flexibility, scalability, and interoperability, making them a preferred choice for modern industrial applications. This shift towards Industrial Ethernet is expected to continue, with market growth projected to exceed traditional industrial communication systems by over 30% in the next five years.

    What are the Key Data Covered in this Industrial Ethernet Market Research and Growth Report?

    • What is the expected growth of the Industrial Ethernet Market between 2024 and 2028?

      • USD 43.52 billion, at a CAGR of 13.29%

    • What segmentation does the market report cover?

      • The report is segmented by Component (Hardware, Software, and Services), Technology (Ethernet/IP, PROFINET, EtherCAT, Modbus TCP/IP, and Others), and Geography (APAC, North America, Europe, South America, and Middle East and Africa)

    • Which regions are analyzed in the report?

      • APAC, North America, Europe, South America, and Middle East and Africa

    • What are the key growth drivers and market challenges?

      • Increasing number of smart grid projects, Issues and vulnerabilities related to network security

    • Who are the major players in the Industrial Ethernet Market?

      • ABB Ltd., Analog Devices Inc., Belden Inc., Cisco Systems Inc., Eaton Corp. Plc, Hitachi Ltd., HMS Networks AB, Honeywell International Inc., Microchip Technology Inc., Nexans SA, OMRON Corp., Rockwell Automation Inc., Schneider Electric SE, Siemens AG, Texas Instruments Inc., Hans Turck GmbH and Co KG, Patton LLC, Yokogawa Electric Corp., Signamax Inc., and Moxa Inc.

    We can help! Our analysts can customize this industrial ethernet market research report to meet your requirements.

    Get in touch

    1 Executive Summary

    • 1.1 Market overview
      • Exhibit 01: Executive Summary – Chart on Market Overview
      • Exhibit 02: Executive Summary – Data Table on Market Overview
      • Exhibit 03: Executive Summary – Chart on Global Market Characteristics
      • Exhibit 04: Executive Summary – Chart on Market by Geography
      • Exhibit 05: Executive Summary – Chart on Market Segmentation by Component
      • Exhibit 06: Executive Summary – Chart on Market Segmentation by Technology
      • Exhibit 07: Executive Summary – Chart on Incremental Growth
      • Exhibit 08: Executive Summary – Data Table on Incremental Growth
      • Exhibit 09: Executive Summary – Chart on Vendor Market Positioning

    2 Market Landscape

    • 2.1 Market ecosystem
      • Exhibit 10: Parent market
      • Exhibit 11: Market Characteristics

    3 Market Sizing

    • 3.1 Market definition
      • Exhibit 12: Offerings of vendors included in the market definition
    • 3.2 Market segment analysis
      • Exhibit 13: Market segments
    • 3.3 Market size 2023
      • 3.4 Market outlook: Forecast for 2023-2028
        • Exhibit 14: Chart on Global - Market size and forecast 2023-2028 ($ billion)
        • Exhibit 15: Data Table on Global - Market size and forecast 2023-2028 ($ billion)
        • Exhibit 16: Chart on Global Market: Year-over-year growth 2023-2028 (%)
        • Exhibit 17: Data Table on Global Market: Year-over-year growth 2023-2028 (%)

      4 Historic Market Size

      • 4.1 Global industrial ethernet market 2018 - 2022
        • Exhibit 18: Historic Market Size – Data Table on global industrial ethernet market 2018 - 2022 ($ billion)
      • 4.2 Component Segment Analysis 2018 - 2022
        • Exhibit 19: Historic Market Size – Component Segment 2018 - 2022 ($ billion)
      • 4.3 Technology Segment Analysis 2018 - 2022
        • Exhibit 20: Historic Market Size – Technology Segment 2018 - 2022 ($ billion)
      • 4.4 Geography Segment Analysis 2018 - 2022
        • Exhibit 21: Historic Market Size – Geography Segment 2018 - 2022 ($ billion)
      • 4.5 Country Segment Analysis 2018 - 2022
        • Exhibit 22: Historic Market Size – Country Segment 2018 - 2022 ($ billion)

      5 Five Forces Analysis

      • 5.1 Five forces summary
        • Exhibit 23: Five forces analysis - Comparison between 2023 and 2028
      • 5.2 Bargaining power of buyers
        • Exhibit 24: Chart on Bargaining power of buyers – Impact of key factors 2023 and 2028
      • 5.3 Bargaining power of suppliers
        • Exhibit 25: Bargaining power of suppliers – Impact of key factors in 2023 and 2028
      • 5.4 Threat of new entrants
        • Exhibit 26: Threat of new entrants – Impact of key factors in 2023 and 2028
      • 5.5 Threat of substitutes
        • Exhibit 27: Threat of substitutes – Impact of key factors in 2023 and 2028
      • 5.6 Threat of rivalry
        • Exhibit 28: Threat of rivalry – Impact of key factors in 2023 and 2028
      • 5.7 Market condition
        • Exhibit 29: Chart on Market condition - Five forces 2023 and 2028

      6 Market Segmentation by Component

      • 6.1 Market segments
        • Exhibit 30: Chart on Component - Market share 2023-2028 (%)
        • Exhibit 31: Data Table on Component - Market share 2023-2028 (%)
      • 6.2 Comparison by Component
        • Exhibit 32: Chart on Comparison by Component
        • Exhibit 33: Data Table on Comparison by Component
      • 6.3 Hardware - Market size and forecast 2023-2028
        • Exhibit 34: Chart on Hardware - Market size and forecast 2023-2028 ($ billion)
        • Exhibit 35: Data Table on Hardware - Market size and forecast 2023-2028 ($ billion)
        • Exhibit 36: Chart on Hardware - Year-over-year growth 2023-2028 (%)
        • Exhibit 37: Data Table on Hardware - Year-over-year growth 2023-2028 (%)
      • 6.4 Software - Market size and forecast 2023-2028
        • Exhibit 38: Chart on Software - Market size and forecast 2023-2028 ($ billion)
        • Exhibit 39: Data Table on Software - Market size and forecast 2023-2028 ($ billion)
        • Exhibit 40: Chart on Software - Year-over-year growth 2023-2028 (%)
        • Exhibit 41: Data Table on Software - Year-over-year growth 2023-2028 (%)
      • 6.5 Services - Market size and forecast 2023-2028
        • Exhibit 42: Chart on Services - Market size and forecast 2023-2028 ($ billion)
        • Exhibit 43: Data Table on Services - Market size and forecast 2023-2028 ($ billion)
        • Exhibit 44: Chart on Services - Year-over-year growth 2023-2028 (%)
        • Exhibit 45: Data Table on Services - Year-over-year growth 2023-2028 (%)
      • 6.6 Market opportunity by Component
        • Exhibit 46: Market opportunity by Component ($ billion)
        • Exhibit 47: Data Table on Market opportunity by Component ($ billion)

      7 Market Segmentation by Technology

      • 7.1 Market segments
        • Exhibit 48: Chart on Technology - Market share 2023-2028 (%)
        • Exhibit 49: Data Table on Technology - Market share 2023-2028 (%)
      • 7.2 Comparison by Technology
        • Exhibit 50: Chart on Comparison by Technology
        • Exhibit 51: Data Table on Comparison by Technology
      • 7.3 Ethernet/IP - Market size and forecast 2023-2028
        • Exhibit 52: Chart on Ethernet/IP - Market size and forecast 2023-2028 ($ billion)
        • Exhibit 53: Data Table on Ethernet/IP - Market size and forecast 2023-2028 ($ billion)
        • Exhibit 54: Chart on Ethernet/IP - Year-over-year growth 2023-2028 (%)
        • Exhibit 55: Data Table on Ethernet/IP - Year-over-year growth 2023-2028 (%)
      • 7.4 PROFINET - Market size and forecast 2023-2028
        • Exhibit 56: Chart on PROFINET - Market size and forecast 2023-2028 ($ billion)
        • Exhibit 57: Data Table on PROFINET - Market size and forecast 2023-2028 ($ billion)
        • Exhibit 58: Chart on PROFINET - Year-over-year growth 2023-2028 (%)
        • Exhibit 59: Data Table on PROFINET - Year-over-year growth 2023-2028 (%)
      • 7.5 EtherCAT - Market size and forecast 2023-2028
        • Exhibit 60: Chart on EtherCAT - Market size and forecast 2023-2028 ($ billion)
        • Exhibit 61: Data Table on EtherCAT - Market size and forecast 2023-2028 ($ billion)
        • Exhibit 62: Chart on EtherCAT - Year-over-year growth 2023-2028 (%)
        • Exhibit 63: Data Table on EtherCAT - Year-over-year growth 2023-2028 (%)
      • 7.6 Modbus TCP/IP - Market size and forecast 2023-2028
        • Exhibit 64: Chart on Modbus TCP/IP - Market size and forecast 2023-2028 ($ billion)
        • Exhibit 65: Data Table on Modbus TCP/IP - Market size and forecast 2023-2028 ($ billion)
        • Exhibit 66: Chart on Modbus TCP/IP - Year-over-year growth 2023-2028 (%)
        • Exhibit 67: Data Table on Modbus TCP/IP - Year-over-year growth 2023-2028 (%)
      • 7.7 Others - Market size and forecast 2023-2028
        • Exhibit 68: Chart on Others - Market size and forecast 2023-2028 ($ billion)
        • Exhibit 69: Data Table on Others - Market size and forecast 2023-2028 ($ billion)
        • Exhibit 70: Chart on Others - Year-over-year growth 2023-2028 (%)
        • Exhibit 71: Data Table on Others - Year-over-year growth 2023-2028 (%)
      • 7.8 Market opportunity by Technology
        • Exhibit 72: Market opportunity by Technology ($ billion)
        • Exhibit 73: Data Table on Market opportunity by Technology ($ billion)

      8 Customer Landscape

      • 8.1 Customer landscape overview
        • Exhibit 74: Analysis of price sensitivity, lifecycle, customer purchase basket, adoption rates, and purchase criteria

      9 Geographic Landscape

      • 9.1 Geographic segmentation
        • Exhibit 75: Chart on Market share by geography 2023-2028 (%)
        • Exhibit 76: Data Table on Market share by geography 2023-2028 (%)
      • 9.2 Geographic comparison
        • Exhibit 77: Chart on Geographic comparison
        • Exhibit 78: Data Table on Geographic comparison
      • 9.3 APAC - Market size and forecast 2023-2028
        • Exhibit 79: Chart on APAC - Market size and forecast 2023-2028 ($ billion)
        • Exhibit 80: Data Table on APAC - Market size and forecast 2023-2028 ($ billion)
        • Exhibit 81: Chart on APAC - Year-over-year growth 2023-2028 (%)
        • Exhibit 82: Data Table on APAC - Year-over-year growth 2023-2028 (%)
      • 9.4 North America - Market size and forecast 2023-2028
        • Exhibit 83: Chart on North America - Market size and forecast 2023-2028 ($ billion)
        • Exhibit 84: Data Table on North America - Market size and forecast 2023-2028 ($ billion)
        • Exhibit 85: Chart on North America - Year-over-year growth 2023-2028 (%)
        • Exhibit 86: Data Table on North America - Year-over-year growth 2023-2028 (%)
      • 9.5 Europe - Market size and forecast 2023-2028
        • Exhibit 87: Chart on Europe - Market size and forecast 2023-2028 ($ billion)
        • Exhibit 88: Data Table on Europe - Market size and forecast 2023-2028 ($ billion)
        • Exhibit 89: Chart on Europe - Year-over-year growth 2023-2028 (%)
        • Exhibit 90: Data Table on Europe - Year-over-year growth 2023-2028 (%)
      • 9.6 South America - Market size and forecast 2023-2028
        • Exhibit 91: Chart on South America - Market size and forecast 2023-2028 ($ billion)
        • Exhibit 92: Data Table on South America - Market size and forecast 2023-2028 ($ billion)
        • Exhibit 93: Chart on South America - Year-over-year growth 2023-2028 (%)
        • Exhibit 94: Data Table on South America - Year-over-year growth 2023-2028 (%)
      • 9.7 Middle East and Africa - Market size and forecast 2023-2028
        • Exhibit 95: Chart on Middle East and Africa - Market size and forecast 2023-2028 ($ billion)
        • Exhibit 96: Data Table on Middle East and Africa - Market size and forecast 2023-2028 ($ billion)
        • Exhibit 97: Chart on Middle East and Africa - Year-over-year growth 2023-2028 (%)
        • Exhibit 98: Data Table on Middle East and Africa - Year-over-year growth 2023-2028 (%)
      • 9.8 US - Market size and forecast 2023-2028
        • Exhibit 99: Chart on US - Market size and forecast 2023-2028 ($ billion)
        • Exhibit 100: Data Table on US - Market size and forecast 2023-2028 ($ billion)
        • Exhibit 101: Chart on US - Year-over-year growth 2023-2028 (%)
        • Exhibit 102: Data Table on US - Year-over-year growth 2023-2028 (%)
      • 9.9 China - Market size and forecast 2023-2028
        • Exhibit 103: Chart on China - Market size and forecast 2023-2028 ($ billion)
        • Exhibit 104: Data Table on China - Market size and forecast 2023-2028 ($ billion)
        • Exhibit 105: Chart on China - Year-over-year growth 2023-2028 (%)
        • Exhibit 106: Data Table on China - Year-over-year growth 2023-2028 (%)
      • 9.10 Japan - Market size and forecast 2023-2028
        • Exhibit 107: Chart on Japan - Market size and forecast 2023-2028 ($ billion)
        • Exhibit 108: Data Table on Japan - Market size and forecast 2023-2028 ($ billion)
        • Exhibit 109: Chart on Japan - Year-over-year growth 2023-2028 (%)
        • Exhibit 110: Data Table on Japan - Year-over-year growth 2023-2028 (%)
      • 9.11 Germany - Market size and forecast 2023-2028
        • Exhibit 111: Chart on Germany - Market size and forecast 2023-2028 ($ billion)
        • Exhibit 112: Data Table on Germany - Market size and forecast 2023-2028 ($ billion)
        • Exhibit 113: Chart on Germany - Year-over-year growth 2023-2028 (%)
        • Exhibit 114: Data Table on Germany - Year-over-year growth 2023-2028 (%)
      • 9.12 UK - Market size and forecast 2023-2028
        • Exhibit 115: Chart on UK - Market size and forecast 2023-2028 ($ billion)
        • Exhibit 116: Data Table on UK - Market size and forecast 2023-2028 ($ billion)
        • Exhibit 117: Chart on UK - Year-over-year growth 2023-2028 (%)
        • Exhibit 118: Data Table on UK - Year-over-year growth 2023-2028 (%)
      • 9.13 Market opportunity by geography
        • Exhibit 119: Market opportunity by geography ($ billion)
        • Exhibit 120: Data Tables on Market opportunity by geography ($ billion)

      10 Drivers, Challenges, and Trends

      • 10.1 Market drivers
        • 10.2 Market challenges
          • 10.3 Impact of drivers and challenges
            • Exhibit 121: Impact of drivers and challenges in 2023 and 2028
          • 10.4 Market trends

            11 Vendor Landscape

            • 11.1 Overview
              • 11.2 Vendor landscape
                • Exhibit 122: Overview on Criticality of inputs and Factors of differentiation
              • 11.3 Landscape disruption
                • Exhibit 123: Overview on factors of disruption
              • 11.4 Industry risks
                • Exhibit 124: Impact of key risks on business

              12 Vendor Analysis

              • 12.1 Vendors covered
                • Exhibit 125: Vendors covered
              • 12.2 Market positioning of vendors
                • Exhibit 126: Matrix on vendor position and classification
              • 12.3 ABB Ltd.
                • Exhibit 127: ABB Ltd. - Overview
                • Exhibit 128: ABB Ltd. - Business segments
                • Exhibit 129: ABB Ltd. - Key news
                • Exhibit 130: ABB Ltd. - Key offerings
                • Exhibit 131: ABB Ltd. - Segment focus
              • 12.4 Analog Devices Inc.
                • Exhibit 132: Analog Devices Inc. - Overview
                • Exhibit 133: Analog Devices Inc. - Business segments
                • Exhibit 134: Analog Devices Inc. - Key news
                • Exhibit 135: Analog Devices Inc. - Key offerings
                • Exhibit 136: Analog Devices Inc. - Segment focus
              • 12.5 Belden Inc.
                • Exhibit 137: Belden Inc. - Overview
                • Exhibit 138: Belden Inc. - Business segments
                • Exhibit 139: Belden Inc. - Key news
                • Exhibit 140: Belden Inc. - Key offerings
                • Exhibit 141: Belden Inc. - Segment focus
              • 12.6 Cisco Systems Inc.
                • Exhibit 142: Cisco Systems Inc. - Overview
                • Exhibit 143: Cisco Systems Inc. - Business segments
                • Exhibit 144: Cisco Systems Inc. - Key news
                • Exhibit 145: Cisco Systems Inc. - Key offerings
                • Exhibit 146: Cisco Systems Inc. - Segment focus
              • 12.7 Eaton Corp. Plc
                • Exhibit 147: Eaton Corp. Plc - Overview
                • Exhibit 148: Eaton Corp. Plc - Business segments
                • Exhibit 149: Eaton Corp. Plc - Key offerings
                • Exhibit 150: Eaton Corp. Plc - Segment focus
              • 12.8 Hitachi Ltd.
                • Exhibit 151: Hitachi Ltd. - Overview
                • Exhibit 152: Hitachi Ltd. - Business segments
                • Exhibit 153: Hitachi Ltd. - Key news
                • Exhibit 154: Hitachi Ltd. - Key offerings
                • Exhibit 155: Hitachi Ltd. - Segment focus
              • 12.9 HMS Networks AB
                • Exhibit 156: HMS Networks AB - Overview
                • Exhibit 157: HMS Networks AB - Product / Service
                • Exhibit 158: HMS Networks AB - Key news
                • Exhibit 159: HMS Networks AB - Key offerings
              • 12.10 Honeywell International Inc.
                • Exhibit 160: Honeywell International Inc. - Overview
                • Exhibit 161: Honeywell International Inc. - Business segments
                • Exhibit 162: Honeywell International Inc. - Key news
                • Exhibit 163: Honeywell International Inc. - Key offerings
                • Exhibit 164: Honeywell International Inc. - Segment focus
              • 12.11 Microchip Technology Inc.
                • Exhibit 165: Microchip Technology Inc. - Overview
                • Exhibit 166: Microchip Technology Inc. - Business segments
                • Exhibit 167: Microchip Technology Inc. - Key news
                • Exhibit 168: Microchip Technology Inc. - Key offerings
                • Exhibit 169: Microchip Technology Inc. - Segment focus
              • 12.12 Nexans SA
                • Exhibit 170: Nexans SA - Overview
                • Exhibit 171: Nexans SA - Business segments
                • Exhibit 172: Nexans SA - Key offerings
                • Exhibit 173: Nexans SA - Segment focus
              • 12.13 OMRON Corp.
                • Exhibit 174: OMRON Corp. - Overview
                • Exhibit 175: OMRON Corp. - Business segments
                • Exhibit 176: OMRON Corp. - Key news
                • Exhibit 177: OMRON Corp. - Key offerings
                • Exhibit 178: OMRON Corp. - Segment focus
              • 12.14 Rockwell Automation Inc.
                • Exhibit 179: Rockwell Automation Inc. - Overview
                • Exhibit 180: Rockwell Automation Inc. - Business segments
                • Exhibit 181: Rockwell Automation Inc. - Key news
                • Exhibit 182: Rockwell Automation Inc. - Key offerings
                • Exhibit 183: Rockwell Automation Inc. - Segment focus
              • 12.15 Schneider Electric SE
                • Exhibit 184: Schneider Electric SE - Overview
                • Exhibit 185: Schneider Electric SE - Business segments
                • Exhibit 186: Schneider Electric SE - Key offerings
                • Exhibit 187: Schneider Electric SE - Segment focus
              • 12.16 Siemens AG
                • Exhibit 188: Siemens AG - Overview
                • Exhibit 189: Siemens AG - Business segments
                • Exhibit 190: Siemens AG - Key news
                • Exhibit 191: Siemens AG - Key offerings
                • Exhibit 192: Siemens AG - Segment focus
              • 12.17 Texas Instruments Inc.
                • Exhibit 193: Texas Instruments Inc. - Overview
                • Exhibit 194: Texas Instruments Inc. - Business segments
                • Exhibit 195: Texas Instruments Inc. - Key news
                • Exhibit 196: Texas Instruments Inc. - Key offerings
                • Exhibit 197: Texas Instruments Inc. - Segment focus

              13 Appendix

              • 13.1 Scope of the report
                • 13.2 Inclusions and exclusions checklist
                  • Exhibit 198: Inclusions checklist
                  • Exhibit 199: Exclusions checklist
                • 13.3 Currency conversion rates for US$
                  • Exhibit 200: Currency conversion rates for US$
                • 13.4 Research methodology
                  • Exhibit 201: Research methodology
                  • Exhibit 202: Validation techniques employed for market sizing
                  • Exhibit 203: Information sources
                • 13.5 List of abbreviations
                  • Exhibit 204: List of abbreviations

                Research Methodology

                Technavio presents a detailed picture of the market by way of study, synthesis, and summation of data from multiple sources. The analysts have presented the various facets of the market with a particular focus on identifying the key industry influencers. The data thus presented is comprehensive, reliable, and the result of extensive research, both primary and secondary.

                INFORMATION SOURCES

                Primary sources

                • Manufacturers and suppliers
                • Channel partners
                • Industry experts
                • Strategic decision makers

                Secondary sources

                • Industry journals and periodicals
                • Government data
                • Financial reports of key industry players
                • Historical data
                • Press releases

                DATA ANALYSIS

                Data Synthesis

                • Collation of data
                • Estimation of key figures
                • Analysis of derived insights

                Data Validation

                • Triangulation with data models
                • Reference against proprietary databases
                • Corroboration with industry experts

                REPORT WRITING

                Qualitative

                • Market drivers
                • Market challenges
                • Market trends
                • Five forces analysis

                Quantitative

                • Market size and forecast
                • Market segmentation
                • Geographical insights
                • Competitive landscape

                Interested in this report?

                Get your sample now to see our research methodology and insights!

                Download Now

                Frequently Asked Questions

                Industrial Ethernet market growth will increase by $ 43.52 bn during 2024-2028.

                The Industrial Ethernet market is expected to grow at a CAGR of 13.29% during 2024-2028.

                Industrial Ethernet market is segmented by Component( Hardware, Software, Services, Modbus TCP/IP, Others) Technology( Ethernet/IP, PROFINET, EtherCAT, Modbus TCP/IP, Others)

                ABB Ltd., Analog Devices Inc., Belden Inc., Cisco Systems Inc., Eaton Corp. Plc, Hitachi Ltd., HMS Networks AB, Honeywell International Inc., Microchip Technology Inc., Nexans SA, OMRON Corp., Rockwell Automation Inc., Schneider Electric SE, Siemens AG, Texas Instruments Inc., Hans Turck GmbH and Co KG, Patton LLC, Yokogawa Electric Corp., Signamax Inc., Moxa Inc. are a few of the key vendors in the Industrial Ethernet market.

                North America will register the highest growth rate of 40% among the other regions. Therefore, the Industrial Ethernet market in North America is expected to garner significant business opportunities for the vendors during the forecast period.

                US, China, Japan, Germany, UK

                • Increasing number of smart grid projectsWith the growing need for detection and reaction to local changes in the use of power is the driving factor this market.
                • there is a surge in the implementation of smart grids in the power industry. At present is the driving factor this market.
                • the implementation of the smart grid is greater in China and North America. The initiatives taken by governments of these regions to modernize traditional power grids into smart grids are increasing the scope of the global industrial Ethernet market. The key benefits of smart grids over traditional grids play a key role in the investments for smart grid projects. As the grid receives power from a variety of conventional and green power sources is the driving factor this market.
                • the power flowing into the grid must match with power demand based on real-time information and control systems to prevent voltage fluctuations on the grid. Thus is the driving factor this market.
                • industrial Ethernet is the de facto standard for end-user industries to match power flowing in and out of the grid. Also is the driving factor this market.
                • Ethernet protocols and allied hardware that include routers is the driving factor this market.
                • switches is the driving factor this market.
                • and connectors form the backbone of power grid communication. The measures to supply electricity through the grid with smart technology are driving the power transmission and distribution business. Smart grids are being deployed rapidly in vertically integrated utilities. In remote areas is the driving factor this market.
                • strategic cooperation between the operators of transmission systems and distribution systems is essential. In addition is the driving factor this market.
                • the International Energy Agency (IEA) has planned to provide electricity access worldwide at an additional cost of $391 billion by 2030. Such initiatives and measures will improve the adoption of the smart grid is the driving factor this market.
                • enhancing the adoption of industrial ethernet. Such factors are expected to drive the growth of the global industrial Ethernet market during the forecast period. is the driving factor this market.

                The Industrial Ethernet market vendors should focus on grabbing business opportunities from the Hardware segment as it accounted for the largest market share in the base year.