Hypervisor Market Analysis, Size, and Forecast 2026-2030: North America (US, Canada, and Mexico), Europe (Germany, UK, and France), APAC (China, Japan, and India), South America (Brazil, Argentina, and Colombia), Middle East and Africa (South Africa, Saudi Arabia, and UAE), and Rest of World (ROW)

Hypervisor Market Analysis, Size, and Forecast 2026-2030:
North America (US, Canada, and Mexico), Europe (Germany, UK, and France), APAC (China, Japan, and India), South America (Brazil, Argentina, and Colombia), Middle East and Africa (South Africa, Saudi Arabia, and UAE), and Rest of World (ROW)

Published: Mar 2026 296 Pages SKU: IRTNTR77100

Market Overview at a Glance

$2.61 B
Market Opportunity
6.5%
CAGR 2025 - 2030
38.9%
North America Growth
$4.26 B
On-premises segment 2024

Hypervisor Market Size 2026-2030

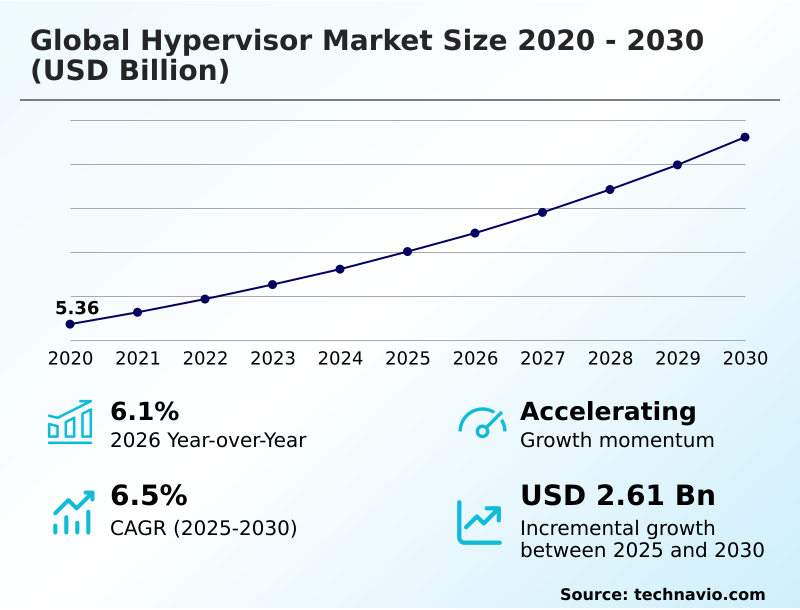
The hypervisor market size is valued to increase by USD 2.61 billion, at a CAGR of 6.5% from 2025 to 2030. Pervasive proliferation of cloud computing and server virtualization will drive the hypervisor market.

Major Market Trends & Insights

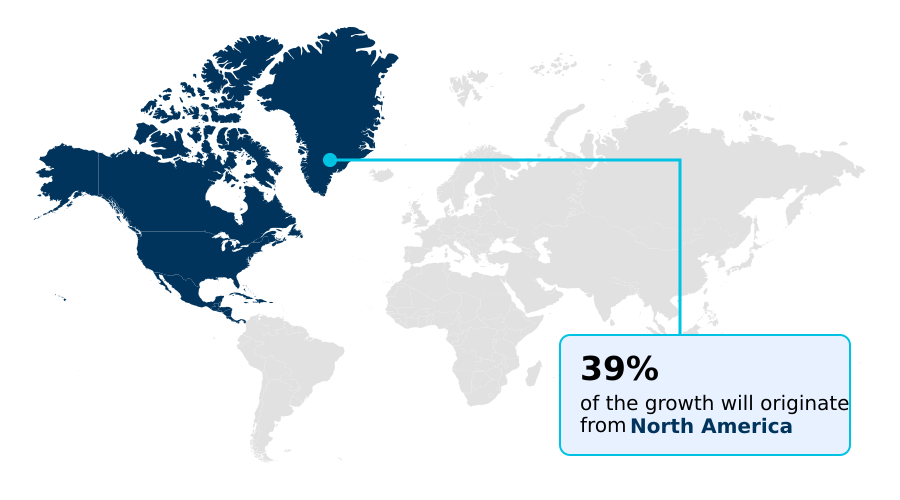
  • North America dominated the market and accounted for a 38.9% growth during the forecast period.
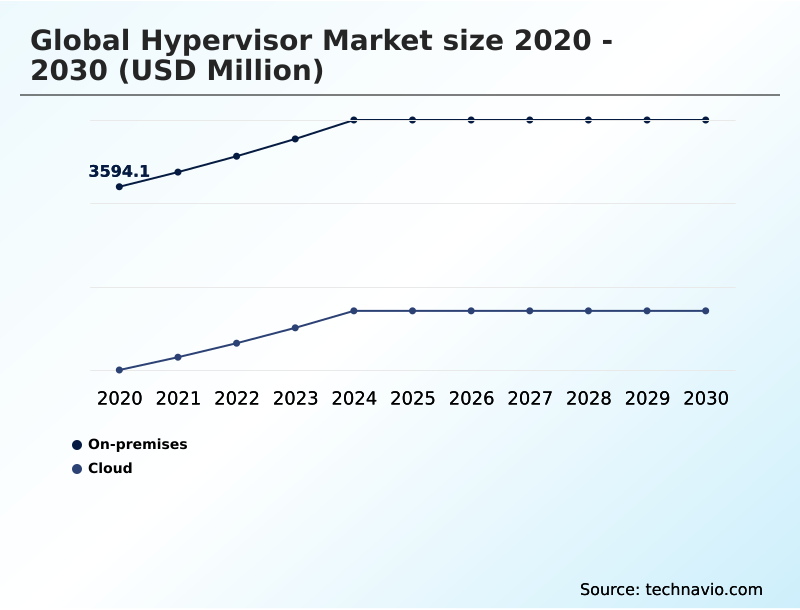
  • By Deployment - On-premises segment was valued at USD 4.26 billion in 2024
  • By Product - Large enterprises segment accounted for the largest market revenue share in 2024

Market Size & Forecast

  • Market Opportunities: USD 4.26 billion
  • Market Future Opportunities: USD 2.61 billion
  • CAGR from 2025 to 2030 : 6.5%

Market Summary

  • The hypervisor market remains a cornerstone of modern IT infrastructure, enabling the efficiency and agility required for digital transformation. As the foundational technology for server consolidation, it allows organizations to maximize hardware utilization, leading to significant reductions in capital and operational expenditures.
  • The evolution of this market is shaped by the relentless drive toward hybrid and multi-cloud environments, demanding solutions that offer seamless workload portability and consistent management across disparate platforms. Key trends include the integration of AI-driven analytics for dynamic resource allocation and the rise of lightweight hypervisors optimized for edge computing deployments.
  • A typical business scenario involves a financial services firm leveraging a bare-metal hypervisor to run high-frequency trading applications alongside legacy systems on the same hardware, ensuring workload isolation and compliance with strict regulatory standards through features like microsegmentation.
  • However, the market also faces challenges from the growing adoption of containerization as a substitute for some workloads and navigating complex virtualization licensing models, which pushes enterprises to evaluate their total cost of ownership and explore multi-hypervisor strategies.

What will be the Size of the Hypervisor Market during the forecast period?

Get Key Insights on Market Forecast (PDF) Request Free Sample

How is the Hypervisor Market Segmented?

The hypervisor industry research report provides comprehensive data (region-wise segment analysis), with forecasts and estimates in "USD million" for the period 2026-2030, as well as historical data from 2020-2024 for the following segments.

  • Deployment
    • On-premises
    • Cloud
  • Product
    • Large enterprises
    • SMEs
  • Component
    • Hardware
    • Software
    • Service
  • Geography
    • North America
      • US
      • Canada
      • Mexico
    • Europe
      • Germany
      • UK
      • France
    • APAC
      • China
      • Japan
      • India
    • South America
      • Brazil
      • Argentina
      • Colombia
    • Middle East and Africa
      • South Africa
      • Saudi Arabia
      • UAE
    • Rest of World (ROW)

By Deployment Insights

The on-premises segment is estimated to witness significant growth during the forecast period.

The on-premises deployment model remains central, affording enterprises complete on-premises virtualization control over their private cloud infrastructure. This approach is critical for virtualization for mission-critical apps in regulated industries where data sovereignty and strict workload isolation are non-negotiable.

By deploying a type-1 hypervisor directly on owned hardware, organizations achieve unparalleled security through features like secure boot capabilities and superior performance for demanding applications.

This model facilitates deep hardware customization, enabling optimized configurations for guest operating systems and achieving predictable performance, which can reduce application latency by over 20%.

The foundation of resource abstraction through network virtualization and storage virtualization allows for efficient server consolidation and robust virtualization policy enforcement within the corporate firewall.

Request Free Sample

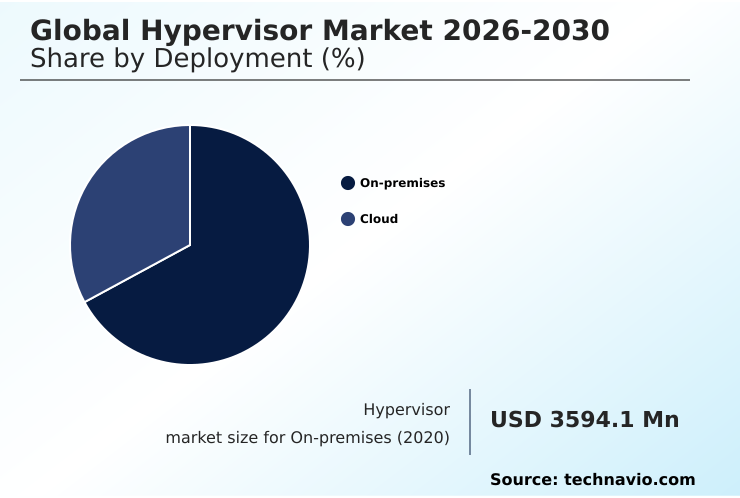
The On-premises segment was valued at USD 4.26 billion in 2024 and showed a gradual increase during the forecast period.

Request Free Sample

Regional Analysis

North America is estimated to contribute 38.9% to the growth of the global market during the forecast period.Technavio’s analysts have elaborately explained the regional trends and drivers that shape the market during the forecast period.

See How Hypervisor Market Demand is Rising in North America Request Free Sample

North America currently accounts for 38.92% of the market's incremental growth, driven by advanced adoption of the hybrid cloud operating model and investments in hyperconverged infrastructure. Enterprises in the region heavily leverage live migration and high-availability clustering for resilience.

Europe, with a regional growth rate of 6.1%, emphasizes data sovereignty, reinforcing demand for strong on-premises virtualization control.

APAC is a close second in growth, fueled by digitalization and demand for a hypervisor for big data analytics, pushing virtual machine density to new limits. The region sees increased use of multi-tenancy in its cloud services.

This dynamic landscape shows a global push for efficient disaster recovery orchestration and experimentation with technologies like nested virtualization.

Market Dynamics

Our researchers analyzed the data with 2025 as the base year, along with the key drivers, trends, and challenges. A holistic analysis of drivers will help companies refine their marketing strategies to gain a competitive advantage.

  • The Global Hypervisor Market 2026-2030 for enterprise data centers is mature, focusing on performance and evaluating hypervisor total cost of ownership. In contrast, the Global Hypervisor Market 2026-2030 for edge computing demands lightweight, resilient solutions. A key debate is the Global Hypervisor Market 2026-2030 vs container orchestration, though many use both in hybrid models.
  • Navigating the Global Hypervisor Market 2026-2030 licensing and TCO is a major challenge, spurring a cost-benefit analysis of open-source hypervisors. The future lies with the Global Hypervisor Market 2026-2030 with hardware acceleration, as DPUs and SmartNICs offload tasks. Organizations are also scrutinizing the Global Hypervisor Market 2026-2030 security and isolation capabilities.
  • This makes choosing a hypervisor for private cloud a critical decision. Many are now managing multi-hypervisor environments effectively to avoid lock-in. The hypervisor role in AI and ML workloads is growing, requiring advanced scheduling. Security teams are focused on securing virtual machines from lateral movement. Development teams are automating vm deployment with iac tools.
  • For end-user computing, hypervisor considerations for vdi deployments are paramount. For industrial use, hypervisor requirements for real-time systems are strict. Performance is also key, leading to hypervisor performance benchmarking for databases and work on optimizing network performance in virtual environments. Finally, achieving compliance with hypervisor security controls is essential, driving the need for better hypervisor integration with cloud management platforms.
  • In fact, firms that fully automate compliance checks within their platforms report audit preparation times that are over 50% faster than those using manual processes.

What are the key market drivers leading to the rise in the adoption of Hypervisor Industry?

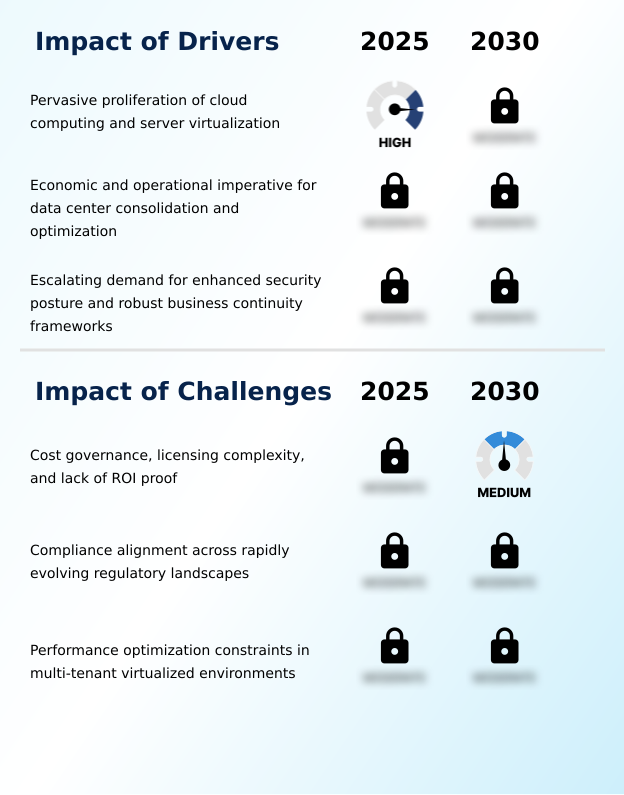
  • The pervasive proliferation of cloud computing and server virtualization technologies is the single most influential driver propelling the market's expansion.

  • The primary market driver is the economic imperative for server consolidation and virtualization cost optimization, which can reduce data center hardware footprints by up to 60%. This is enabled by the fundamental resource abstraction that hypervisors provide.
  • The adoption of hyperconverged infrastructure further accelerates this by simplifying the deployment of private cloud infrastructure. For enterprises running virtualization for mission-critical apps, the need for robust business continuity frameworks is a major catalyst.
  • Features like high-availability failover within high-availability clustering and streamlined disaster recovery orchestration are indispensable. The demand for disaster recovery virtualization solutions has been shown to lower business downtime by over 75% during outages.
  • Furthermore, workload portability is essential for enabling flexible hybrid cloud strategies and efficient multi-tenancy.

What are the market trends shaping the Hypervisor Industry?

  • The strategic shift toward distributed edge architectures is a defining market trend, creating a significant demand for seamless workload portability across heterogeneous computing environments.

  • Market trends are driven by the shift towards edge virtualization and IT/OT convergence, demanding lightweight hypervisors with small footprints. These platforms support a hypervisor for IoT workloads and real-time hypervisor use cases where low latency is critical.
  • The integration of AI is enabling more sophisticated dynamic resource allocation and predictive CPU scheduling, with some platforms improving virtual machine density by over 15% without performance degradation. This intelligent hypervisor resource scheduling is crucial for cloud-native virtualization environments.
  • Enhanced hypervisor security features are also a major trend, providing deep workload isolation needed to run mixed-criticality applications and emerging unikernel artifacts securely.

What challenges does the Hypervisor Industry face during its growth?

  • Complex licensing models, challenges in cost governance, and difficulties in demonstrating a clear return on investment represent a primary challenge affecting market velocity.

  • A significant challenge is navigating complex virtualization licensing models, which can obscure total cost of ownership and increase operational expenses by 20% or more if not managed properly. This complexity drives interest in a multi-hypervisor strategy, but this approach introduces its own issues, such as ensuring virtual machine image compatibility.
  • Another challenge is managing hypervisor performance overhead, particularly in dense multi-tenant environments. The rise of container orchestration on VMs creates a new management layer, requiring strong hypervisor api integration and advanced tools.
  • While infrastructure as code helps automate deployment, the technical debt of legacy systems and the difficulty of implementing advanced features like microsegmentation or nested virtualization across different platforms remains a hurdle for many IT teams.

Exclusive Technavio Analysis on Customer Landscape

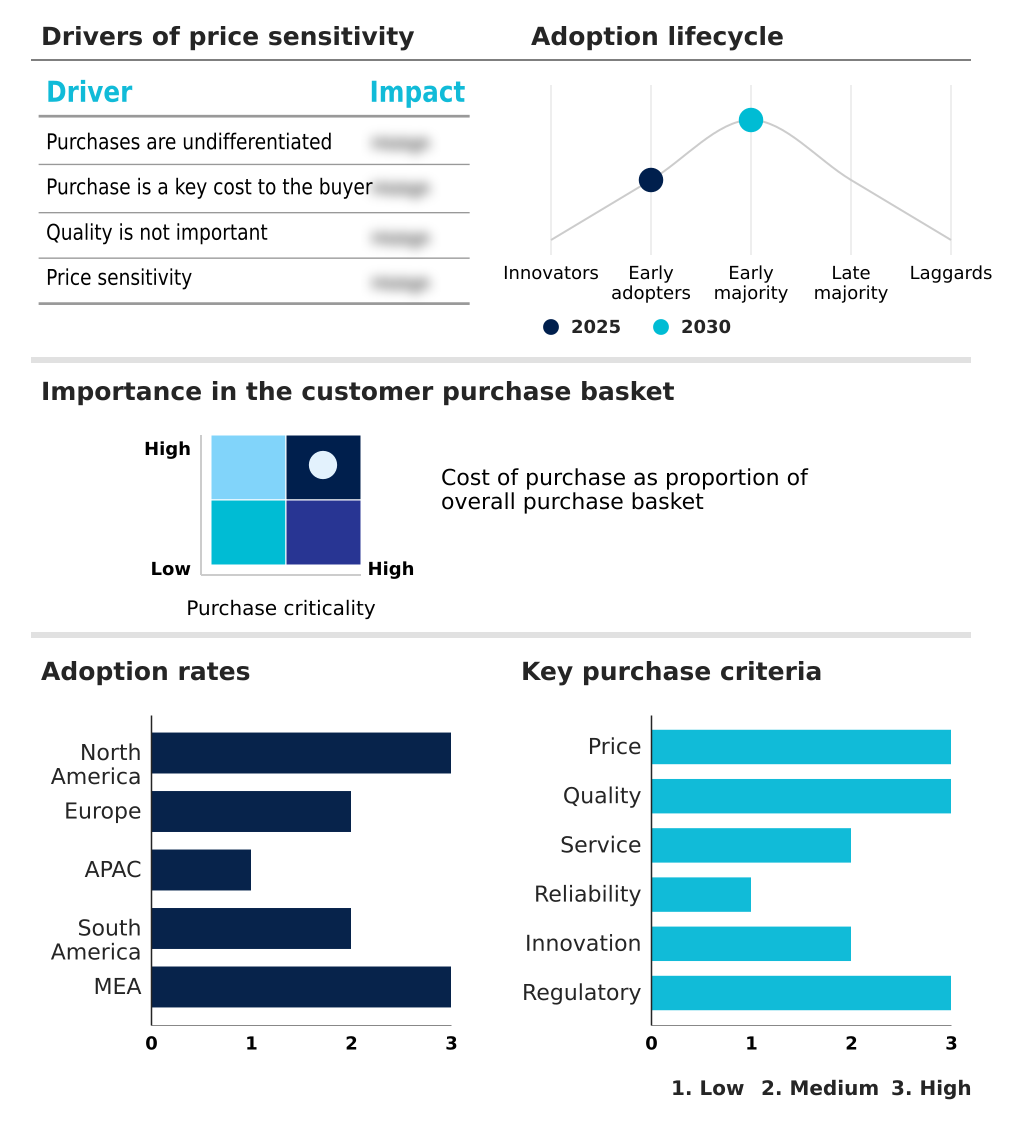
The hypervisor market forecasting report includes the adoption lifecycle of the market, covering from the innovator’s stage to the laggard’s stage. It focuses on adoption rates in different regions based on penetration. Furthermore, the hypervisor market report also includes key purchase criteria and drivers of price sensitivity to help companies evaluate and develop their market growth analysis strategies.

Customer Landscape of Hypervisor Industry

Competitive Landscape

Companies are implementing various strategies, such as strategic alliances, hypervisor market forecast, partnerships, mergers and acquisitions, geographical expansion, and product/service launches, to enhance their presence in the industry.

acontis technologies GmbH - Delivers a diverse portfolio of hypervisor solutions, including enterprise-grade virtualization, specialized real-time hypervisors, and embedded platforms for mixed-criticality systems, meeting diverse workload demands.

The industry research and growth report includes detailed analyses of the competitive landscape of the market and information about key companies, including:

  • acontis technologies GmbH
  • Aptiv Plc
  • BlackBerry Ltd.
  • Broadcom Inc.
  • Citrix Systems Inc.
  • General Dynamics Corp.
  • Green Hills Software LLC
  • Hewlett Packard Entp Co.
  • IBM Corp.
  • Kernkonzept GmbH
  • Lynx Software Technologies
  • Microsoft Corp.
  • NXP Semiconductors NV
  • Oracle Corp.
  • Parallels International GmbH
  • Proxmox Server Solutions GmbH
  • Scale Computing
  • Siemens AG
  • Thales Group
  • Vates

Qualitative and quantitative analysis of companies has been conducted to help clients understand the wider business environment as well as the strengths and weaknesses of key industry players. Data is qualitatively analyzed to categorize companies as pure play, category-focused, industry-focused, and diversified; it is quantitatively analyzed to categorize companies as dominant, leading, strong, tentative, and weak.

Recent Development and News in Hypervisor market

  • In November, 2024, Broadcom Inc. completed its acquisition of VMware, subsequently announcing a strategic shift from perpetual licenses to a subscription-based model for its entire product portfolio.
  • In February, 2025, Microsoft Corp. and Siemens AG announced an expanded partnership to integrate Azure Stack HCI's lightweight hypervisor capabilities with Siemens' industrial edge platform, aiming to accelerate IT/OT convergence.
  • In March, 2025, the community behind the Xen Project released a new version of its hypervisor with significant security enhancements, including live patching capabilities and improved performance for ARM-based architectures.
  • In April, 2025, the United States Department of Defense announced a landmark initiative to diversify its private cloud infrastructure by adopting a multi-hypervisor strategy to enhance operational resilience and mitigate vendor lock-in.

Dive into Technavio’s robust research methodology, blending expert interviews, extensive data synthesis, and validated models for unparalleled Hypervisor Market insights. See full methodology.

Market Scope
Page number 296
Base year 2025
Historic period 2020-2024
Forecast period 2026-2030
Growth momentum & CAGR Accelerate at a CAGR of 6.5%
Market growth 2026-2030 USD 2607.3 million
Market structure Fragmented
YoY growth 2025-2026(%) 6.1%
Key countries US, Canada, Mexico, Germany, UK, France, Spain, Italy, The Netherlands, China, Japan, India, South Korea, Australia, Singapore, Brazil, Argentina, Colombia, South Africa, Saudi Arabia, UAE, Turkey and Egypt
Competitive landscape Leading Companies, Market Positioning of Companies, Competitive Strategies, and Industry Risks

Request Free Sample

Research Analyst Overview

  • The hypervisor market's evolution is defined by a shift from basic server consolidation to enabling complex, automated IT ecosystems. The core technology, the virtual machine monitor, now supports everything from enterprise guest operating systems to emerging unikernel artifacts.
  • Boardroom decisions increasingly weigh the benefits of a type-1 hypervisor or bare-metal hypervisor for performance against the flexibility of a hosted hypervisor (type-2 hypervisor). Advanced hardware-assisted virtualization is standard, with data processing units and smart network interface cards enabling superior network virtualization and storage virtualization. This resource abstraction is fundamental.
  • Key trends include deploying lightweight hypervisors for edge virtualization and using a separation kernel for real-time hypervisor applications. Security is paramount, with virtual trusted platform modules and secure boot capabilities becoming standard for microsegmentation to prevent threats. For operations, live migration, dynamic resource allocation using techniques like memory overcommitment and cpu scheduling, and high-availability failover are critical.
  • Modern management relies on infrastructure as code for zero-touch provisioning based on stable virtual device models. Hyperconverged infrastructure simplifies deployment, while nested virtualization supports complex lab environments. The focus is on increasing virtual machine density while ensuring robust disaster recovery orchestration and seamless workload portability. Organizations implementing zero-touch provisioning have reported a reduction in infrastructure deployment errors by over 90%.

What are the Key Data Covered in this Hypervisor Market Research and Growth Report?

  • What is the expected growth of the Hypervisor Market between 2026 and 2030?

    • USD 2.61 billion, at a CAGR of 6.5%

  • What segmentation does the market report cover?

    • The report is segmented by Deployment (On-premises, and Cloud), Product (Large enterprises, and SMEs), Component (Hardware, Software, and Service) and Geography (North America, Europe, APAC, South America, Middle East and Africa)

  • Which regions are analyzed in the report?

    • North America, Europe, APAC, South America and Middle East and Africa

  • What are the key growth drivers and market challenges?

    • Pervasive proliferation of cloud computing and server virtualization, Cost governance, licensing complexity, and lack of ROI proof

  • Who are the major players in the Hypervisor Market?

    • acontis technologies GmbH, Aptiv Plc, BlackBerry Ltd., Broadcom Inc., Citrix Systems Inc., General Dynamics Corp., Green Hills Software LLC, Hewlett Packard Entp Co., IBM Corp., Kernkonzept GmbH, Lynx Software Technologies, Microsoft Corp., NXP Semiconductors NV, Oracle Corp., Parallels International GmbH, Proxmox Server Solutions GmbH, Scale Computing, Siemens AG, Thales Group and Vates

Market Research Insights

  • The modern hybrid cloud operating model requires a flexible multi-hypervisor strategy to achieve virtualization cost optimization while navigating complex virtualization licensing models. Effective virtualization management platforms are key for the automated infrastructure provisioning of private cloud infrastructure, supporting both virtualization for legacy applications and cloud-native virtualization.
  • Prioritizing hypervisor security features ensures a secure multi-tenant architecture with proper workload isolation and virtualization policy enforcement. For virtualization for mission-critical apps, high-availability clustering and disaster recovery virtualization are essential. VDI hypervisor selection must account for hypervisor performance overhead, while a hypervisor for IoT workloads and a hypervisor for big data analytics need specialized hypervisor resource scheduling.
  • Container orchestration on VMs on a bare-metal container platform shows the need for hypervisor ecosystem compatibility and virtual machine image compatibility. This is critical for IT/OT convergence, supporting virtual network functions and software-defined storage through robust hypervisor API integration. Some firms improve disaster recovery TCO by 45% using this model.

We can help! Our analysts can customize this hypervisor market research report to meet your requirements.

Get in touch

1. Executive Summary

1.1 Market overview

Executive Summary - Chart on Market Overview
Executive Summary - Data Table on Market Overview
Executive Summary - Chart on Global Market Characteristics
Executive Summary - Chart on Market by Geography
Executive Summary - Chart on Market Segmentation by Deployment
Executive Summary - Chart on Market Segmentation by Product
Executive Summary - Chart on Market Segmentation by Component
Executive Summary - Chart on Incremental Growth
Executive Summary - Data Table on Incremental Growth
Executive Summary - Chart on Company Market Positioning

2. Technavio Analysis

2.1 Analysis of price sensitivity, lifecycle, customer purchase basket, adoption rates, and purchase criteria

2.2 Criticality of inputs and Factors of differentiation

Chart on Overview on criticality of inputs and factors of differentiation

2.3 Factors of disruption

Chart on Overview on factors of disruption

2.4 Impact of drivers and challenges

Chart on Impact of drivers and challenges in 2025 and 2030

3. Market Landscape

3.1 Market ecosystem

Chart on Parent Market
Data Table on - Parent Market

3.2 Market characteristics

Chart on Market characteristics analysis

3.3 Value chain analysis

Chart on Value chain analysis

4. Market Sizing

4.1 Market definition

Data Table on Offerings of companies included in the market definition

4.2 Market segment analysis

Market segments

4.3 Market size 2025

4.4 Market outlook: Forecast for 2025-2030

Chart on Global - Market size and forecast 2025-2030 ($ million)
Data Table on Global - Market size and forecast 2025-2030 ($ million)
Chart on Global Market: Year-over-year growth 2025-2030 (%)
Data Table on Global Market: Year-over-year growth 2025-2030 (%)

5. Historic Market Size

5.1 Global Hypervisor Market 2020 - 2024

Historic Market Size - Data Table on Global Hypervisor Market 2020 - 2024 ($ million)

5.2 Deployment segment analysis 2020 - 2024

Historic Market Size - Deployment Segment 2020 - 2024 ($ million)

5.3 Product segment analysis 2020 - 2024

Historic Market Size - Product Segment 2020 - 2024 ($ million)

5.4 Component segment analysis 2020 - 2024

Historic Market Size - Component Segment 2020 - 2024 ($ million)

5.5 Geography segment analysis 2020 - 2024

Historic Market Size - Geography Segment 2020 - 2024 ($ million)

5.6 Country segment analysis 2020 - 2024

Historic Market Size - Country Segment 2020 - 2024 ($ million)

6. Qualitative Analysis

6.1 The impact of AI on global hypervisor market

7. Five Forces Analysis

7.1 Five forces summary

Five forces analysis - Comparison between 2025 and 2030

7.2 Bargaining power of buyers

Bargaining power of buyers - Impact of key factors 2025 and 2030

7.3 Bargaining power of suppliers

Bargaining power of suppliers - Impact of key factors in 2025 and 2030

7.4 Threat of new entrants

Threat of new entrants - Impact of key factors in 2025 and 2030

7.5 Threat of substitutes

Threat of substitutes - Impact of key factors in 2025 and 2030

7.6 Threat of rivalry

Threat of rivalry - Impact of key factors in 2025 and 2030

7.7 Market condition

Chart on Market condition - Five forces 2025 and 2030

8. Market Segmentation by Deployment

8.1 Market segments

Chart on Deployment - Market share 2025-2030 (%)
Data Table on Deployment - Market share 2025-2030 (%)

8.2 Comparison by Deployment

Chart on Comparison by Deployment
Data Table on Comparison by Deployment

8.3 On-premises - Market size and forecast 2025-2030

Chart on On-premises - Market size and forecast 2025-2030 ($ million)
Data Table on On-premises - Market size and forecast 2025-2030 ($ million)
Chart on On-premises - Year-over-year growth 2025-2030 (%)
Data Table on On-premises - Year-over-year growth 2025-2030 (%)

8.4 Cloud - Market size and forecast 2025-2030

Chart on Cloud - Market size and forecast 2025-2030 ($ million)
Data Table on Cloud - Market size and forecast 2025-2030 ($ million)
Chart on Cloud - Year-over-year growth 2025-2030 (%)
Data Table on Cloud - Year-over-year growth 2025-2030 (%)

8.5 Market opportunity by Deployment

Market opportunity by Deployment ($ million)
Data Table on Market opportunity by Deployment ($ million)

9. Market Segmentation by Product

9.1 Market segments

Chart on Product - Market share 2025-2030 (%)
Data Table on Product - Market share 2025-2030 (%)

9.2 Comparison by Product

Chart on Comparison by Product
Data Table on Comparison by Product

9.3 Large enterprises - Market size and forecast 2025-2030

Chart on Large enterprises - Market size and forecast 2025-2030 ($ million)
Data Table on Large enterprises - Market size and forecast 2025-2030 ($ million)
Chart on Large enterprises - Year-over-year growth 2025-2030 (%)
Data Table on Large enterprises - Year-over-year growth 2025-2030 (%)

9.4 SMEs - Market size and forecast 2025-2030

Chart on SMEs - Market size and forecast 2025-2030 ($ million)
Data Table on SMEs - Market size and forecast 2025-2030 ($ million)
Chart on SMEs - Year-over-year growth 2025-2030 (%)
Data Table on SMEs - Year-over-year growth 2025-2030 (%)

9.5 Market opportunity by Product

Market opportunity by Product ($ million)
Data Table on Market opportunity by Product ($ million)

10. Market Segmentation by Component

10.1 Market segments

Chart on Component - Market share 2025-2030 (%)
Data Table on Component - Market share 2025-2030 (%)

10.2 Comparison by Component

Chart on Comparison by Component
Data Table on Comparison by Component

10.3 Hardware - Market size and forecast 2025-2030

Chart on Hardware - Market size and forecast 2025-2030 ($ million)
Data Table on Hardware - Market size and forecast 2025-2030 ($ million)
Chart on Hardware - Year-over-year growth 2025-2030 (%)
Data Table on Hardware - Year-over-year growth 2025-2030 (%)

10.4 Software - Market size and forecast 2025-2030

Chart on Software - Market size and forecast 2025-2030 ($ million)
Data Table on Software - Market size and forecast 2025-2030 ($ million)
Chart on Software - Year-over-year growth 2025-2030 (%)
Data Table on Software - Year-over-year growth 2025-2030 (%)

10.5 Service - Market size and forecast 2025-2030

Chart on Service - Market size and forecast 2025-2030 ($ million)
Data Table on Service - Market size and forecast 2025-2030 ($ million)
Chart on Service - Year-over-year growth 2025-2030 (%)
Data Table on Service - Year-over-year growth 2025-2030 (%)

10.6 Market opportunity by Component

Market opportunity by Component ($ million)
Data Table on Market opportunity by Component ($ million)

11. Customer Landscape

11.1 Customer landscape overview

Analysis of price sensitivity, lifecycle, customer purchase basket, adoption rates, and purchase criteria

12. Geographic Landscape

12.1 Geographic segmentation

Chart on Market share by geography 2025-2030 (%)
Data Table on Market share by geography 2025-2030 (%)

12.2 Geographic comparison

Chart on Geographic comparison
Data Table on Geographic comparison

12.3 North America - Market size and forecast 2025-2030

Chart on North America - Market size and forecast 2025-2030 ($ million)
Data Table on North America - Market size and forecast 2025-2030 ($ million)
Chart on North America - Year-over-year growth 2025-2030 (%)
Data Table on North America - Year-over-year growth 2025-2030 (%)
Chart on Regional Comparison - North America
Data Table on Regional Comparison - North America

12.3.1 US - Market size and forecast 2025-2030

Chart on US - Market size and forecast 2025-2030 ($ million)
Data Table on US - Market size and forecast 2025-2030 ($ million)
Chart on US - Year-over-year growth 2025-2030 (%)
Data Table on US - Year-over-year growth 2025-2030 (%)

12.3.2 Canada - Market size and forecast 2025-2030

Chart on Canada - Market size and forecast 2025-2030 ($ million)
Data Table on Canada - Market size and forecast 2025-2030 ($ million)
Chart on Canada - Year-over-year growth 2025-2030 (%)
Data Table on Canada - Year-over-year growth 2025-2030 (%)

12.3.3 Mexico - Market size and forecast 2025-2030

Chart on Mexico - Market size and forecast 2025-2030 ($ million)
Data Table on Mexico - Market size and forecast 2025-2030 ($ million)
Chart on Mexico - Year-over-year growth 2025-2030 (%)
Data Table on Mexico - Year-over-year growth 2025-2030 (%)

12.4 Europe - Market size and forecast 2025-2030

Chart on Europe - Market size and forecast 2025-2030 ($ million)
Data Table on Europe - Market size and forecast 2025-2030 ($ million)
Chart on Europe - Year-over-year growth 2025-2030 (%)
Data Table on Europe - Year-over-year growth 2025-2030 (%)
Chart on Regional Comparison - Europe
Data Table on Regional Comparison - Europe

12.4.1 Germany - Market size and forecast 2025-2030

Chart on Germany - Market size and forecast 2025-2030 ($ million)
Data Table on Germany - Market size and forecast 2025-2030 ($ million)
Chart on Germany - Year-over-year growth 2025-2030 (%)
Data Table on Germany - Year-over-year growth 2025-2030 (%)

12.4.2 UK - Market size and forecast 2025-2030

Chart on UK - Market size and forecast 2025-2030 ($ million)
Data Table on UK - Market size and forecast 2025-2030 ($ million)
Chart on UK - Year-over-year growth 2025-2030 (%)
Data Table on UK - Year-over-year growth 2025-2030 (%)

12.4.3 France - Market size and forecast 2025-2030

Chart on France - Market size and forecast 2025-2030 ($ million)
Data Table on France - Market size and forecast 2025-2030 ($ million)
Chart on France - Year-over-year growth 2025-2030 (%)
Data Table on France - Year-over-year growth 2025-2030 (%)

12.4.4 Spain - Market size and forecast 2025-2030

Chart on Spain - Market size and forecast 2025-2030 ($ million)
Data Table on Spain - Market size and forecast 2025-2030 ($ million)
Chart on Spain - Year-over-year growth 2025-2030 (%)
Data Table on Spain - Year-over-year growth 2025-2030 (%)

12.4.5 Italy - Market size and forecast 2025-2030

Chart on Italy - Market size and forecast 2025-2030 ($ million)
Data Table on Italy - Market size and forecast 2025-2030 ($ million)
Chart on Italy - Year-over-year growth 2025-2030 (%)
Data Table on Italy - Year-over-year growth 2025-2030 (%)

12.4.6 The Netherlands - Market size and forecast 2025-2030

Chart on The Netherlands - Market size and forecast 2025-2030 ($ million)
Data Table on The Netherlands - Market size and forecast 2025-2030 ($ million)
Chart on The Netherlands - Year-over-year growth 2025-2030 (%)
Data Table on The Netherlands - Year-over-year growth 2025-2030 (%)

12.5 APAC - Market size and forecast 2025-2030

Chart on APAC - Market size and forecast 2025-2030 ($ million)
Data Table on APAC - Market size and forecast 2025-2030 ($ million)
Chart on APAC - Year-over-year growth 2025-2030 (%)
Data Table on APAC - Year-over-year growth 2025-2030 (%)
Chart on Regional Comparison - APAC
Data Table on Regional Comparison - APAC

12.5.1 China - Market size and forecast 2025-2030

Chart on China - Market size and forecast 2025-2030 ($ million)
Data Table on China - Market size and forecast 2025-2030 ($ million)
Chart on China - Year-over-year growth 2025-2030 (%)
Data Table on China - Year-over-year growth 2025-2030 (%)

12.5.2 Japan - Market size and forecast 2025-2030

Chart on Japan - Market size and forecast 2025-2030 ($ million)
Data Table on Japan - Market size and forecast 2025-2030 ($ million)
Chart on Japan - Year-over-year growth 2025-2030 (%)
Data Table on Japan - Year-over-year growth 2025-2030 (%)

12.5.3 India - Market size and forecast 2025-2030

Chart on India - Market size and forecast 2025-2030 ($ million)
Data Table on India - Market size and forecast 2025-2030 ($ million)
Chart on India - Year-over-year growth 2025-2030 (%)
Data Table on India - Year-over-year growth 2025-2030 (%)

12.5.4 South Korea - Market size and forecast 2025-2030

Chart on South Korea - Market size and forecast 2025-2030 ($ million)
Data Table on South Korea - Market size and forecast 2025-2030 ($ million)
Chart on South Korea - Year-over-year growth 2025-2030 (%)
Data Table on South Korea - Year-over-year growth 2025-2030 (%)

12.5.5 Australia - Market size and forecast 2025-2030

Chart on Australia - Market size and forecast 2025-2030 ($ million)
Data Table on Australia - Market size and forecast 2025-2030 ($ million)
Chart on Australia - Year-over-year growth 2025-2030 (%)
Data Table on Australia - Year-over-year growth 2025-2030 (%)

12.5.6 Singapore - Market size and forecast 2025-2030

Chart on Singapore - Market size and forecast 2025-2030 ($ million)
Data Table on Singapore - Market size and forecast 2025-2030 ($ million)
Chart on Singapore - Year-over-year growth 2025-2030 (%)
Data Table on Singapore - Year-over-year growth 2025-2030 (%)

12.6 South America - Market size and forecast 2025-2030

Chart on South America - Market size and forecast 2025-2030 ($ million)
Data Table on South America - Market size and forecast 2025-2030 ($ million)
Chart on South America - Year-over-year growth 2025-2030 (%)
Data Table on South America - Year-over-year growth 2025-2030 (%)
Chart on Regional Comparison - South America
Data Table on Regional Comparison - South America

12.6.1 Brazil - Market size and forecast 2025-2030

Chart on Brazil - Market size and forecast 2025-2030 ($ million)
Data Table on Brazil - Market size and forecast 2025-2030 ($ million)
Chart on Brazil - Year-over-year growth 2025-2030 (%)
Data Table on Brazil - Year-over-year growth 2025-2030 (%)

12.6.2 Argentina - Market size and forecast 2025-2030

Chart on Argentina - Market size and forecast 2025-2030 ($ million)
Data Table on Argentina - Market size and forecast 2025-2030 ($ million)
Chart on Argentina - Year-over-year growth 2025-2030 (%)
Data Table on Argentina - Year-over-year growth 2025-2030 (%)

12.6.3 Colombia - Market size and forecast 2025-2030

Chart on Colombia - Market size and forecast 2025-2030 ($ million)
Data Table on Colombia - Market size and forecast 2025-2030 ($ million)
Chart on Colombia - Year-over-year growth 2025-2030 (%)
Data Table on Colombia - Year-over-year growth 2025-2030 (%)

12.7 Middle East and Africa - Market size and forecast 2025-2030

Chart on Middle East and Africa - Market size and forecast 2025-2030 ($ million)
Data Table on Middle East and Africa - Market size and forecast 2025-2030 ($ million)
Chart on Middle East and Africa - Year-over-year growth 2025-2030 (%)
Data Table on Middle East and Africa - Year-over-year growth 2025-2030 (%)
Chart on Regional Comparison - Middle East and Africa
Data Table on Regional Comparison - Middle East and Africa

12.7.1 South Africa - Market size and forecast 2025-2030

Chart on South Africa - Market size and forecast 2025-2030 ($ million)
Data Table on South Africa - Market size and forecast 2025-2030 ($ million)
Chart on South Africa - Year-over-year growth 2025-2030 (%)
Data Table on South Africa - Year-over-year growth 2025-2030 (%)

12.7.2 Saudi Arabia - Market size and forecast 2025-2030

Chart on Saudi Arabia - Market size and forecast 2025-2030 ($ million)
Data Table on Saudi Arabia - Market size and forecast 2025-2030 ($ million)
Chart on Saudi Arabia - Year-over-year growth 2025-2030 (%)
Data Table on Saudi Arabia - Year-over-year growth 2025-2030 (%)

12.7.3 UAE - Market size and forecast 2025-2030

Chart on UAE - Market size and forecast 2025-2030 ($ million)
Data Table on UAE - Market size and forecast 2025-2030 ($ million)
Chart on UAE - Year-over-year growth 2025-2030 (%)
Data Table on UAE - Year-over-year growth 2025-2030 (%)

12.7.4 Turkey - Market size and forecast 2025-2030

Chart on Turkey - Market size and forecast 2025-2030 ($ million)
Data Table on Turkey - Market size and forecast 2025-2030 ($ million)
Chart on Turkey - Year-over-year growth 2025-2030 (%)
Data Table on Turkey - Year-over-year growth 2025-2030 (%)

12.7.5 Egypt - Market size and forecast 2025-2030

Chart on Egypt - Market size and forecast 2025-2030 ($ million)
Data Table on Egypt - Market size and forecast 2025-2030 ($ million)
Chart on Egypt - Year-over-year growth 2025-2030 (%)
Data Table on Egypt - Year-over-year growth 2025-2030 (%)

12.8 Market opportunity by geography

Market opportunity by geography ($ million)
Data Tables on Market opportunity by geography ($ million)

13. Drivers, Challenges, and Opportunity

13.1 Market drivers

Pervasive proliferation of cloud computing and server virtualization
Economic and operational imperative for data center consolidation and optimization
Escalating demand for enhanced security posture and robust business continuity frameworks

13.2 Market challenges

Cost governance, licensing complexity, and lack of ROI proof
Compliance alignment across rapidly evolving regulatory landscapes
Performance optimization constraints in multi‑tenant virtualized environments

13.3 Impact of drivers and challenges

Impact of drivers and challenges in 2025 and 2030

13.4 Market opportunities

Distributed edge virtualization and workload portability
Integration of AI driven resource optimization
Rising adoption of lightweight hypervisors for high density workload environments

14. Competitive Landscape

14.1 Overview

14.2

Overview on criticality of inputs and factors of differentiation

14.3 Landscape disruption

Overview on factors of disruption

14.4 Industry risks

Impact of key risks on business

15. Competitive Analysis

15.1 Companies profiled

Companies covered

15.2 Company ranking index

15.3 Market positioning of companies

Matrix on companies position and classification

15.4 acontis technologies GmbH

acontis technologies GmbH - Overview
acontis technologies GmbH - Product / Service
acontis technologies GmbH - Key offerings
SWOT

15.5 Aptiv Plc

Aptiv Plc - Overview
Aptiv Plc - Business segments
Aptiv Plc - Key news
Aptiv Plc - Key offerings
Aptiv Plc - Segment focus
SWOT

15.6 Broadcom Inc.

Broadcom Inc. - Overview
Broadcom Inc. - Business segments
Broadcom Inc. - Key news
Broadcom Inc. - Key offerings
Broadcom Inc. - Segment focus
SWOT

15.7 Citrix Systems Inc.

Citrix Systems Inc. - Overview
Citrix Systems Inc. - Product / Service
Citrix Systems Inc. - Key news
Citrix Systems Inc. - Key offerings
SWOT

15.8 General Dynamics Corp.

General Dynamics Corp. - Overview
General Dynamics Corp. - Business segments
General Dynamics Corp. - Key news
General Dynamics Corp. - Key offerings
General Dynamics Corp. - Segment focus
SWOT

15.9 Hewlett Packard Entp Co.

Hewlett Packard Entp Co. - Overview
Hewlett Packard Entp Co. - Business segments
Hewlett Packard Entp Co. - Key news
Hewlett Packard Entp Co. - Key offerings
Hewlett Packard Entp Co. - Segment focus
SWOT

15.10 IBM Corp.

IBM Corp. - Overview
IBM Corp. - Business segments
IBM Corp. - Key news
IBM Corp. - Key offerings
IBM Corp. - Segment focus
SWOT

15.11 Lynx Software Technologies

Lynx Software Technologies - Overview
Lynx Software Technologies - Product / Service
Lynx Software Technologies - Key offerings
SWOT

15.12 Microsoft Corp.

Microsoft Corp. - Overview
Microsoft Corp. - Business segments
Microsoft Corp. - Key news
Microsoft Corp. - Key offerings
Microsoft Corp. - Segment focus
SWOT

15.13 NXP Semiconductors NV

NXP Semiconductors NV - Overview
NXP Semiconductors NV - Business segments
NXP Semiconductors NV - Key offerings
NXP Semiconductors NV - Segment focus
SWOT

15.14 Oracle Corp.

Oracle Corp. - Overview
Oracle Corp. - Business segments
Oracle Corp. - Key news
Oracle Corp. - Key offerings
Oracle Corp. - Segment focus
SWOT

15.15 Parallels International GmbH

Parallels International GmbH - Overview
Parallels International GmbH - Product / Service
Parallels International GmbH - Key offerings
SWOT

15.16 Scale Computing

Scale Computing - Overview
Scale Computing - Product / Service
Scale Computing - Key offerings
SWOT

15.17 Siemens AG

Siemens AG - Overview
Siemens AG - Business segments
Siemens AG - Key news
Siemens AG - Key offerings
Siemens AG - Segment focus
SWOT

15.18 Thales Group

Thales Group - Overview
Thales Group - Business segments
Thales Group - Key news
Thales Group - Key offerings
Thales Group - Segment focus
SWOT

16. Appendix

16.1 Scope of the report

Market definition
Objectives
Notes and caveats

16.2 Inclusions and exclusions checklist

Inclusions checklist
Exclusions checklist

16.3 Currency conversion rates for US$

16.4 Research methodology

16.5 Data procurement

Information sources

16.6 Data validation

16.7 Validation techniques employed for market sizing

16.8 Data synthesis

16.9 360 degree market analysis

16.10 List of abbreviations

Research Methodology

Technavio presents a detailed picture of the market by way of study, synthesis, and summation of data from multiple sources. The analysts have presented the various facets of the market with a particular focus on identifying the key industry influencers. The data thus presented is comprehensive, reliable, and the result of extensive research, both primary and secondary.

INFORMATION SOURCES

Primary sources

  • Manufacturers and suppliers
  • Channel partners
  • Industry experts
  • Strategic decision makers

Secondary sources

  • Industry journals and periodicals
  • Government data
  • Financial reports of key industry players
  • Historical data
  • Press releases

DATA ANALYSIS

Data Synthesis

  • Collation of data
  • Estimation of key figures
  • Analysis of derived insights

Data Validation

  • Triangulation with data models
  • Reference against proprietary databases
  • Corroboration with industry experts

REPORT WRITING

Qualitative

  • Market drivers
  • Market challenges
  • Market trends
  • Five forces analysis

Quantitative

  • Market size and forecast
  • Market segmentation
  • Geographical insights
  • Competitive landscape

Interested in this report?

Get your sample now to see our research methodology and insights!

Download Now

Frequently Asked Questions

Hypervisor market growth will increase by USD 2607.3 million during 2026-2030.

The Hypervisor market is expected to grow at a CAGR of 6.5% during 2026-2030.

Hypervisor market is segmented by Deployment (On-premises, Cloud) Product (Large enterprises, SMEs) Component (Hardware, Software, Service)

acontis technologies GmbH, Aptiv Plc, BlackBerry Ltd., Broadcom Inc., Citrix Systems Inc., General Dynamics Corp., Green Hills Software LLC, Hewlett Packard Entp Co., IBM Corp., Kernkonzept GmbH, Lynx Software Technologies, Microsoft Corp., NXP Semiconductors NV, Oracle Corp., Parallels International GmbH, Proxmox Server Solutions GmbH, Scale Computing, Siemens AG, Thales Group, Vates are a few of the key vendors in the Hypervisor market.

North America will register the highest growth rate of 38.9% among the other regions. Therefore, the Hypervisor market in North America is expected to garner significant business opportunities for the vendors during the forecast period.

US, Canada, Mexico, Germany, UK, France, Spain, Italy, The Netherlands, China, Japan, India, South Korea, Australia, Singapore, Brazil, Argentina, Colombia, South Africa, Saudi Arabia, UAE, Turkey, Egypt

  • Pervasive proliferation of cloud computing and server virtualization is the driving factor this market.

The Hypervisor market vendors should focus on grabbing business opportunities from the Deployment segment as it accounted for the largest market share in the base year.
RIA - Research AI Assistant
Ask RIA