Horizontal Directional Drilling Market by Application and Geography - Forecast and Analysis 2022-2026

Horizontal Directional Drilling Market by Application and Geography - Forecast and Analysis 2022-2026

Published: Mar 2022 120 Pages SKU: IRTNTR72305

Market Overview at a Glance

$3.28 B
Market Opportunity
7.96%
CAGR
YoY growth 2020-2021(%)

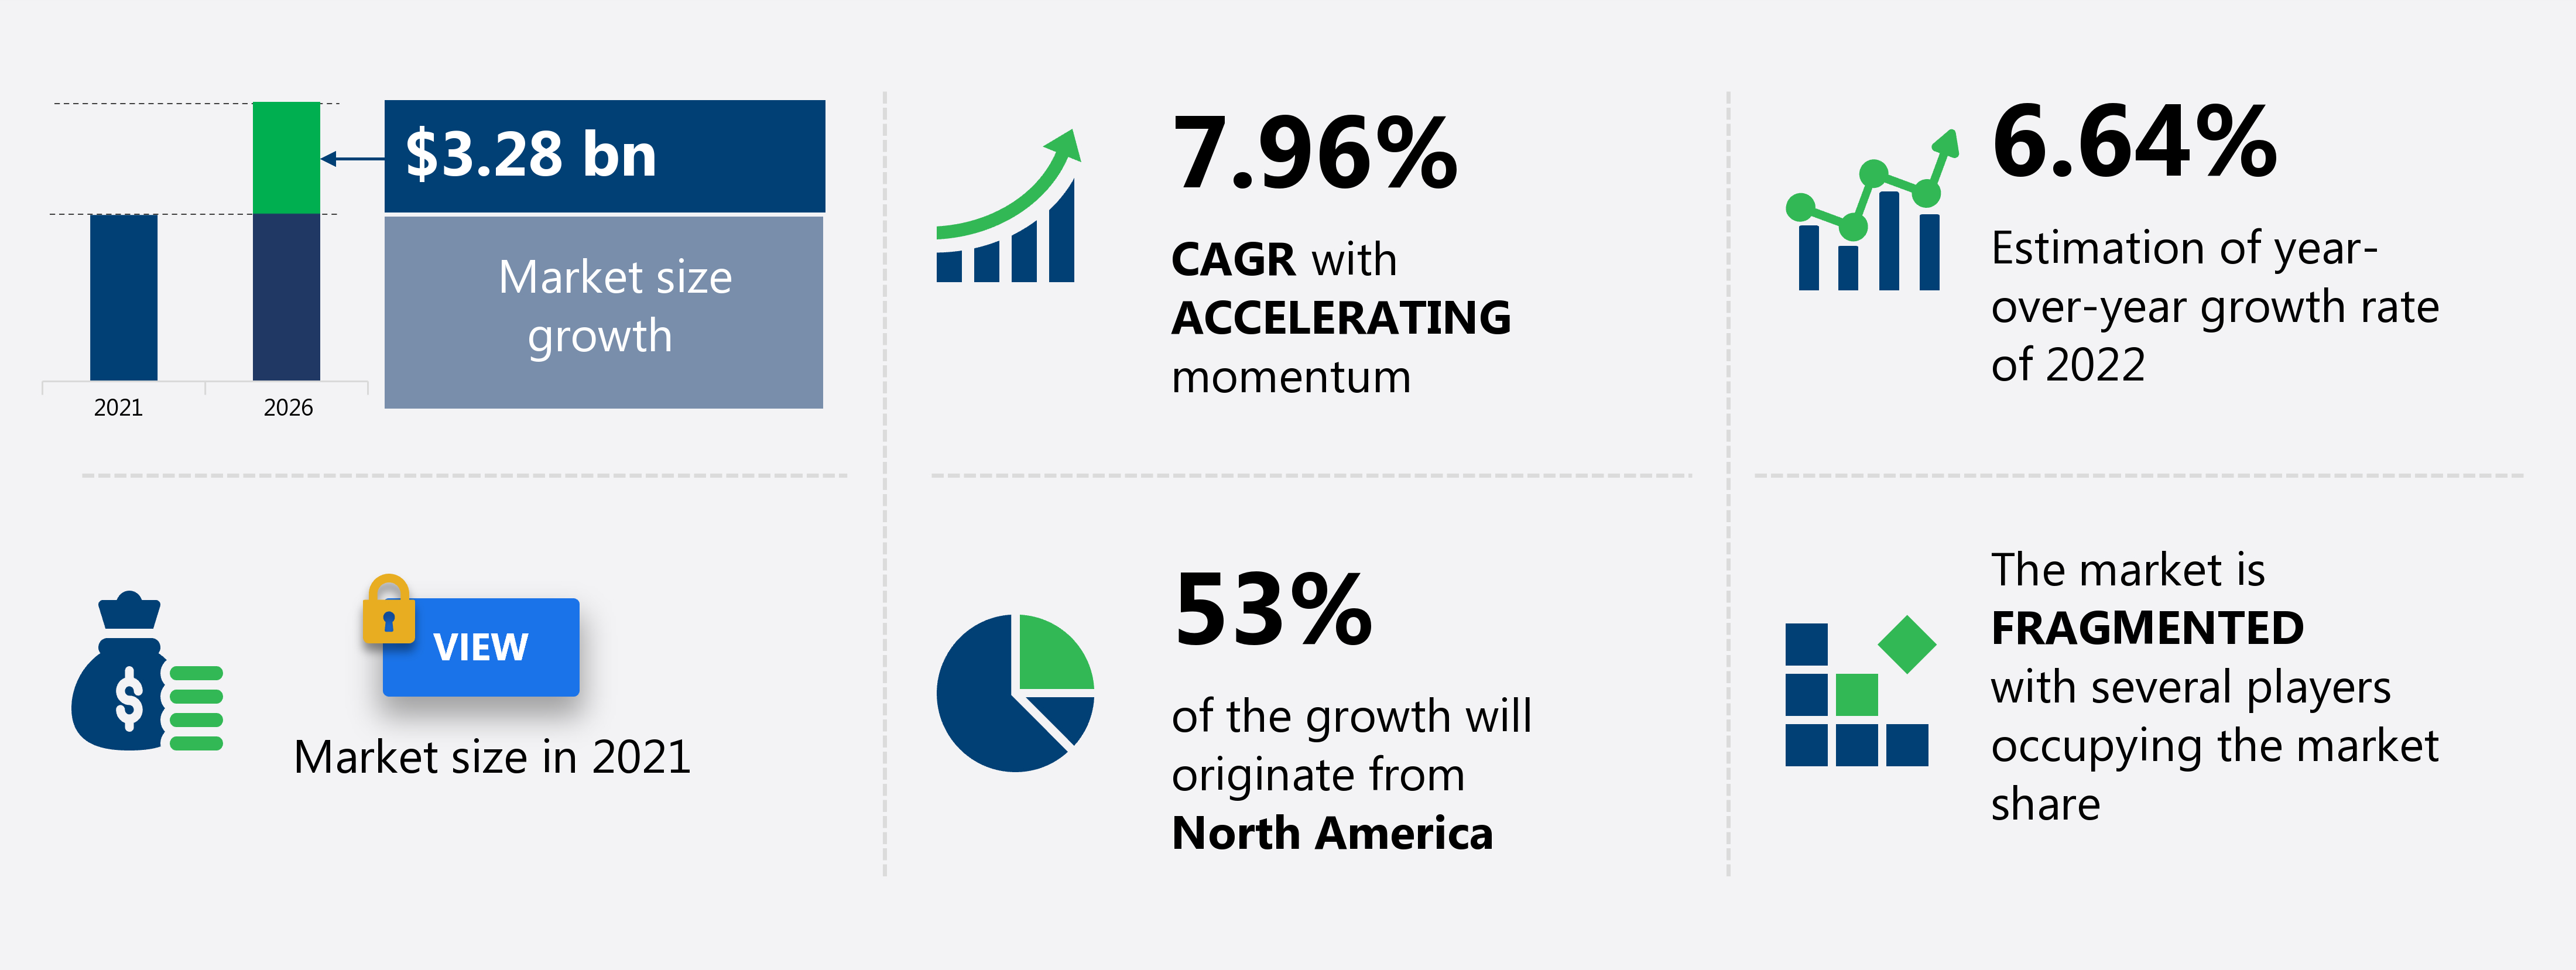
The horizontal directional drilling market share is expected to increase by USD 3.28 billion from 2021 to 2026, and the market’s growth momentum will accelerate at a CAGR of 7.96%.

This horizontal directional drilling market research report provides valuable insights on the post COVID-19 impact on the market, which will help companies evaluate their business approaches. Furthermore, this report extensively covers horizontal directional drilling market segmentation by application (onshore and offshore) and geography (North America, APAC, Europe, Middle East and Africa, and South America).

What will the Horizontal Directional Drilling Market Size be During the Forecast Period?

Download the Free Report Sample to Unlock the Horizontal Directional Drilling Market Size for the Forecast Period and Other Important Statistics

"Increasing investments in offshore projects will drive directional drilling market growth in the forthcoming years."

The horizontal directional drilling market report also offers information on several market vendors, including APS Technology Inc., Baker Hughes Co., Barbco Inc., China Oilfield Services Ltd. Â, Cathedral Energy Services Ltd., Compass Directional Services Ltd., Halliburton Co., Helmerich and Payne Inc., Huisman Equipment BV, Koltek LLC, Millennium Directional Service Ltd., MS Directional, Nabors Industries Ltd., National Energy Services Reunited Corp., NOV Inc., PHX Energy Services Corp., Precision HDD LLC, Schlumberger Ltd., Scientific Drilling International, and Weatherford International Plc among others.

Horizontal Directional Drilling Market: Key Drivers, Trends, and Challenges

The rising unconventional drilling activities is notably driving the horizontal directional drilling market growth, although factors such as risks associated with drilling activities may impede the market growth. Our research analysts have studied the historical data and deduced the key market drivers and the COVID-19 pandemic impact on the horizontal directional drilling industry. The holistic analysis of the drivers will help in deducing end goals and refining marketing strategies to gain a competitive edge.

Key Horizontal Directional Drilling Market Driver

  • One of the key factors driving growth in the horizontal directional drilling market is the rising unconventional drilling activities.
  • A shale is a low-permeability sedimentary rock formation, which contains trapped oil and gas. The production process of shale gas involves the application of pressure using a combination of water, sand, chemicals, and other stimulation fluids to fracture the rock and allow the oil and gas to rise to the surface where it is collected for processing.
  •  The adoption of unconventional drilling technologies in regions with large shale deposits has widened opportunities for upstream oil and gas companies in countries like the US and Canada. Large oil and gas producers such as Chevron, Exxon Mobil, and ConocoPhillips have increased their investments in shale oil and gas. Thus, an increase in unconventional oil and gas drilling activities are likely to boost the market as horizontal directional drilling is the major techniques employed in the process.
  • The rising unconventional drilling activities lead to an increase in drilling activities, thereby driving the market.

Key Horizontal Directional Drilling Market Trend

  • The automation in horizontal directional drilling technique is another factor supporting the horizontal directional drilling market share growth.
  • The drilling process in the oil and gas industry is highly dynamic as there are several variables that affect this process. However, enhancements of drilling process efficiencies and higher quality wellbores are expected to decrease the effect of the above-mentioned variables during drilling to optimize the process. 
  • The drilling processes are evolving with the declining human footprint and accelerated emphasis toward system automation to improve the productivity, efficiency, safety, and quality of the drilling equipment.
  • Several new developments are being implemented in practice by the members of the oil and gas drilling value chain. This led to the removal of SMEs from the well site and boosted the performance by achieving well penetration of more than one mile per day.
  • The automation of the horizontal direction drilling significantly improves the production efficiency, profitability, and consistency of the drilling process performance, thereby driving the market.

Key Horizontal Directional Drilling Market Challenge

  • The risks associated with drilling activities will be a major challenge for the horizontal directional drilling market during the forecast period.
  • Horizontal directional drilling is widely used in the hydraulic fracturing process in unconventional oil and gas drilling activities as horizontal directional drilling is mainly required in unconventional reservoirs.
  • The US is one of the major adopters of hydraulic fracturing for oil and gas production as the technology is very effective in obtaining oil and gas from shale reserves. However, though hydraulic fracturing is the ideal option for increasing oil and gas production, it is prone to methane leaks and water pollution during fracking.
  • The issues are considered as a potential threat to the entire process. Though initiatives are being taken to reduce the above environmental problems, concerns that continue to persist over drilling activities can hinder the growth of the oil and gas industry.
  • Countries such as Ireland, Bulgaria, Germany, France, and the Netherlands have banned fracking, while in other countries such as the US, there is strong opposition from the public to this drilling method. Therefore, these factors will hinder the growth of the oil and gas industry, thereby affecting the growth of the market.

This horizontal directional drilling market analysis report also provides detailed information on other upcoming trends and challenges that will have a far-reaching effect on the market growth. The actionable insights on the trends and challenges will help companies evaluate and develop growth strategies for 2022-2026.

Parent Market Analysis

Technavio categorizes the global horizontal directional drilling market as a part of the global oil and gas drilling market within the oilfield equipment and services market. Our research report has extensively covered external factors influencing the parent market growth potential in the coming years, which will determine the levels of growth of the horizontal directional drilling market during the forecast period.

Who are the Major Horizontal Directional Drilling Market Vendors?

The report analyzes the market’s competitive landscape and offers information on several market vendors, including:


  • APS Technology Inc.
  • Baker Hughes Co.
  • Barbco Inc.
  • China Oilfield Services Ltd.  
  • Cathedral Energy Services Ltd.
  • Compass Directional Services Ltd.
  • Halliburton Co.
  • Helmerich and Payne Inc.
  • Huisman Equipment BV
  • Koltek LLC
  • Millennium Directional Service Ltd.
  • MS Directional
  • Nabors Industries Ltd.
  • National Energy Services Reunited Corp.
  • NOV Inc.
  • PHX Energy Services Corp.
  • Precision HDD LLC
  • Schlumberger Ltd.
  • Scientific Drilling International
  • Weatherford International Plc


This statistical study of the horizontal directional drilling market encompasses successful business strategies deployed by the key vendors. The horizontal directional drilling market is fragmented and the vendors are deploying growth strategies such as rising the drilling activities in remote areas for both onshore and offshore applications to compete in the market.

Product Insights and News

  • bakerhughes.com - The company offers AutoTrak Curve high-build-rate rotary steerable system that reduces time on well in one smooth, fast run.

To make the most of the opportunities and recover from post COVID-19 impact, market vendors should focus more on the growth prospects in the fast-growing segments, while maintaining their positions in the slow-growing segments.

The horizontal directional drilling market forecast report offers in-depth insights into key vendor profiles. The profiles include information on the production, sustainability, and prospects of the leading companies.

Horizontal Directional Drilling Market Value Chain Analysis

Our report provides extensive information on the value chain analysis for the horizontal directional drilling market, which vendors can leverage to gain a competitive advantage during the forecast period. The end-to-end understanding of the value chain is essential in profit margin optimization and evaluation of business strategies. The data available in our value chain analysis segment can help vendors drive costs and enhance customer services during the forecast period.

Which are the Key Regions for Horizontal Directional Drilling Market?

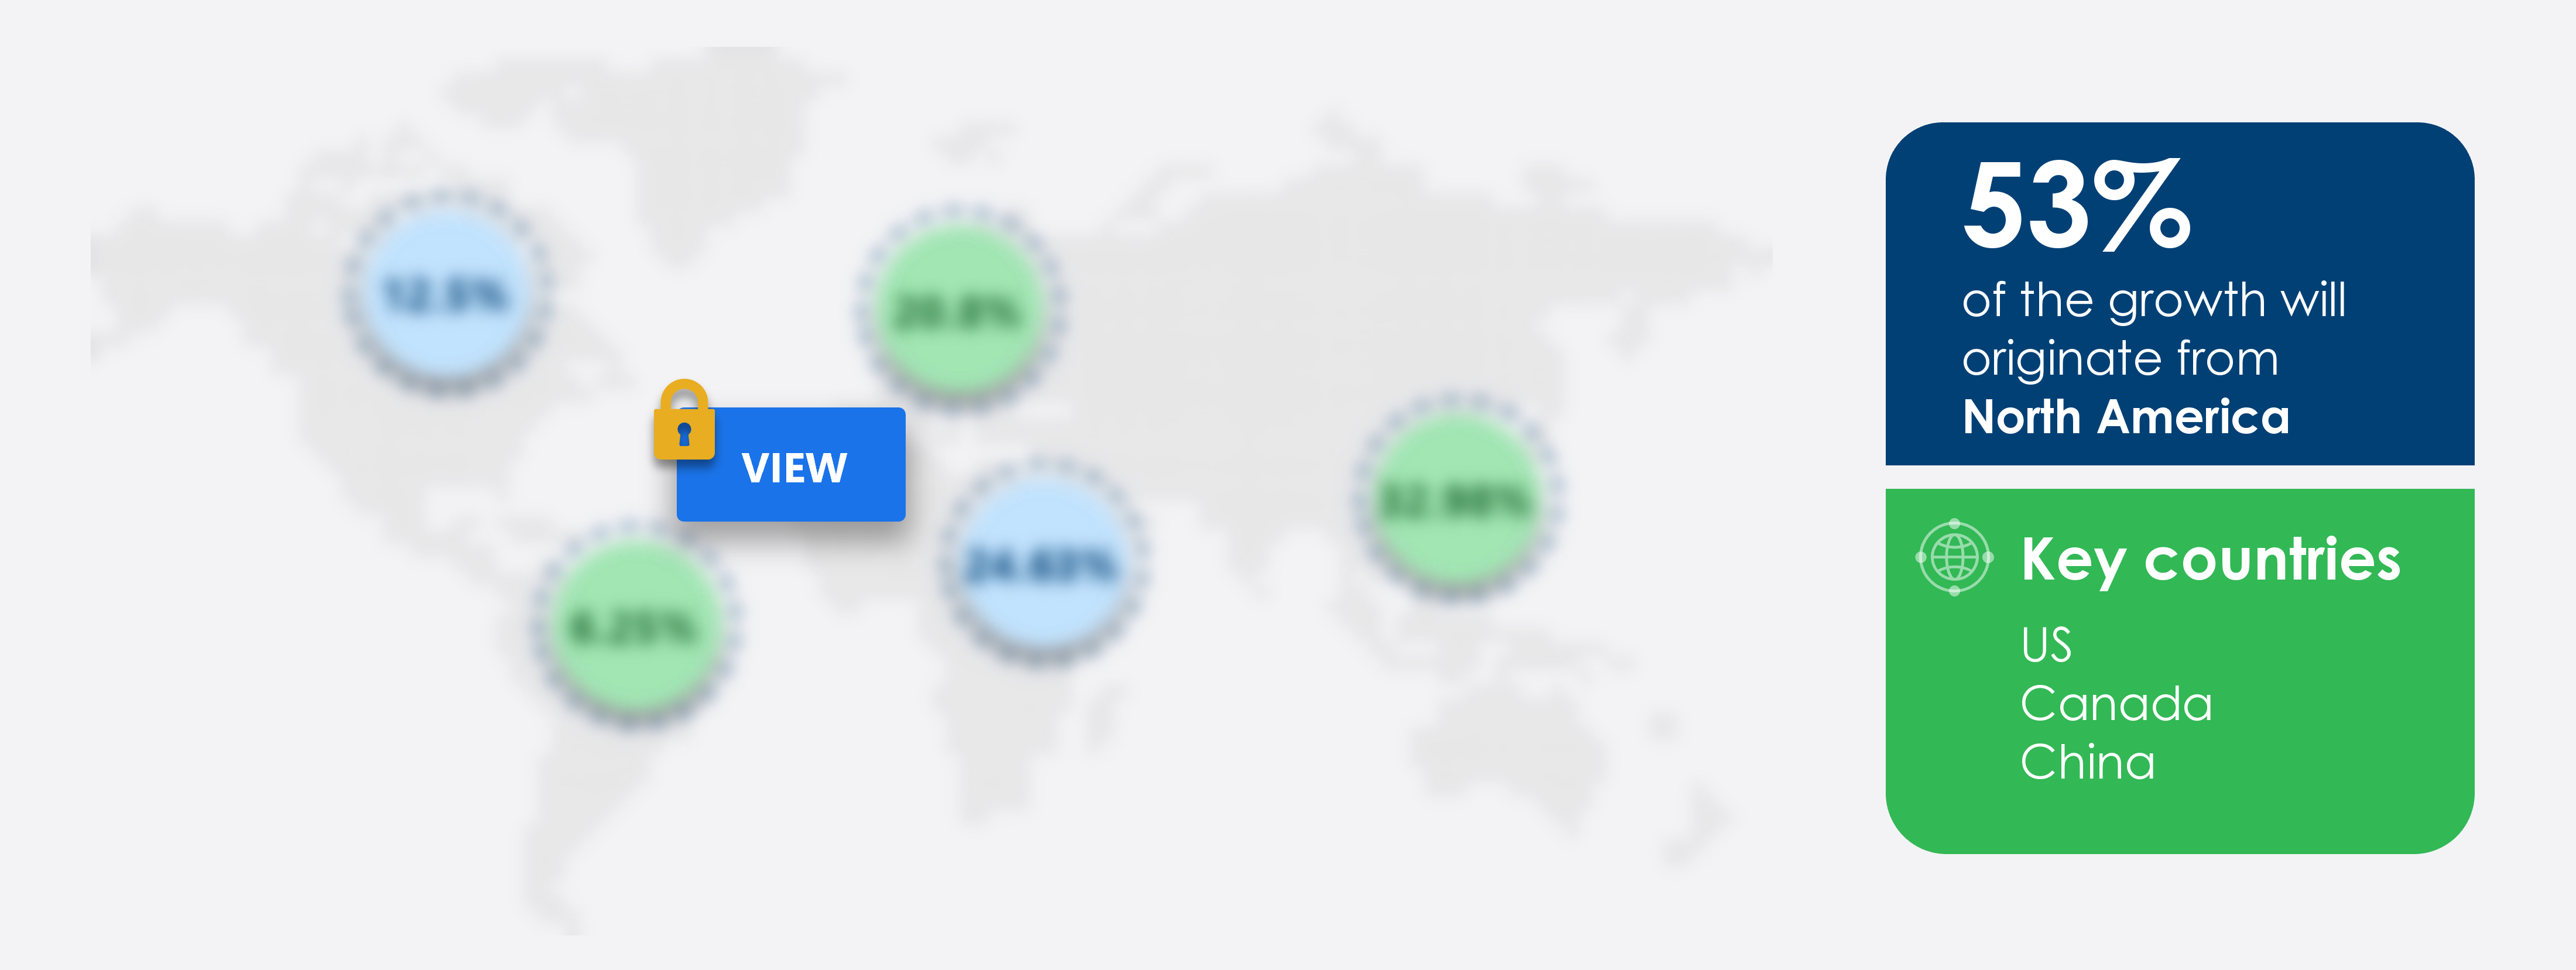
For more insights on the market share of various regions Request for a FREE sample now!

53% of the market’s growth will originate from North America during the forecast period. US and Canada are the key markets for horizontal directional drilling in North America. Market growth in this region will be faster than the growth of the market in the European, MEA and South American regions.

The increasing drilling activities will facilitate the horizontal directional drilling market growth in North America over the forecast period. This market research report entails detailed information on the competitive intelligence, marketing gaps, and regional opportunities in store for vendors, which will assist in creating efficient business plans.

COVID Impact and Recovery Analysis

In 2020, the COVID-19 outbreak negatively impacted the horizontal directional drilling market in North America. However, with the lifting of lockdown restrictions in 2021, major horizontal directional drilling operations were resumed. Hence, the market is expected to recover and grow during the forecast period, owing to the increasing number of offshore exploration projects in the region.

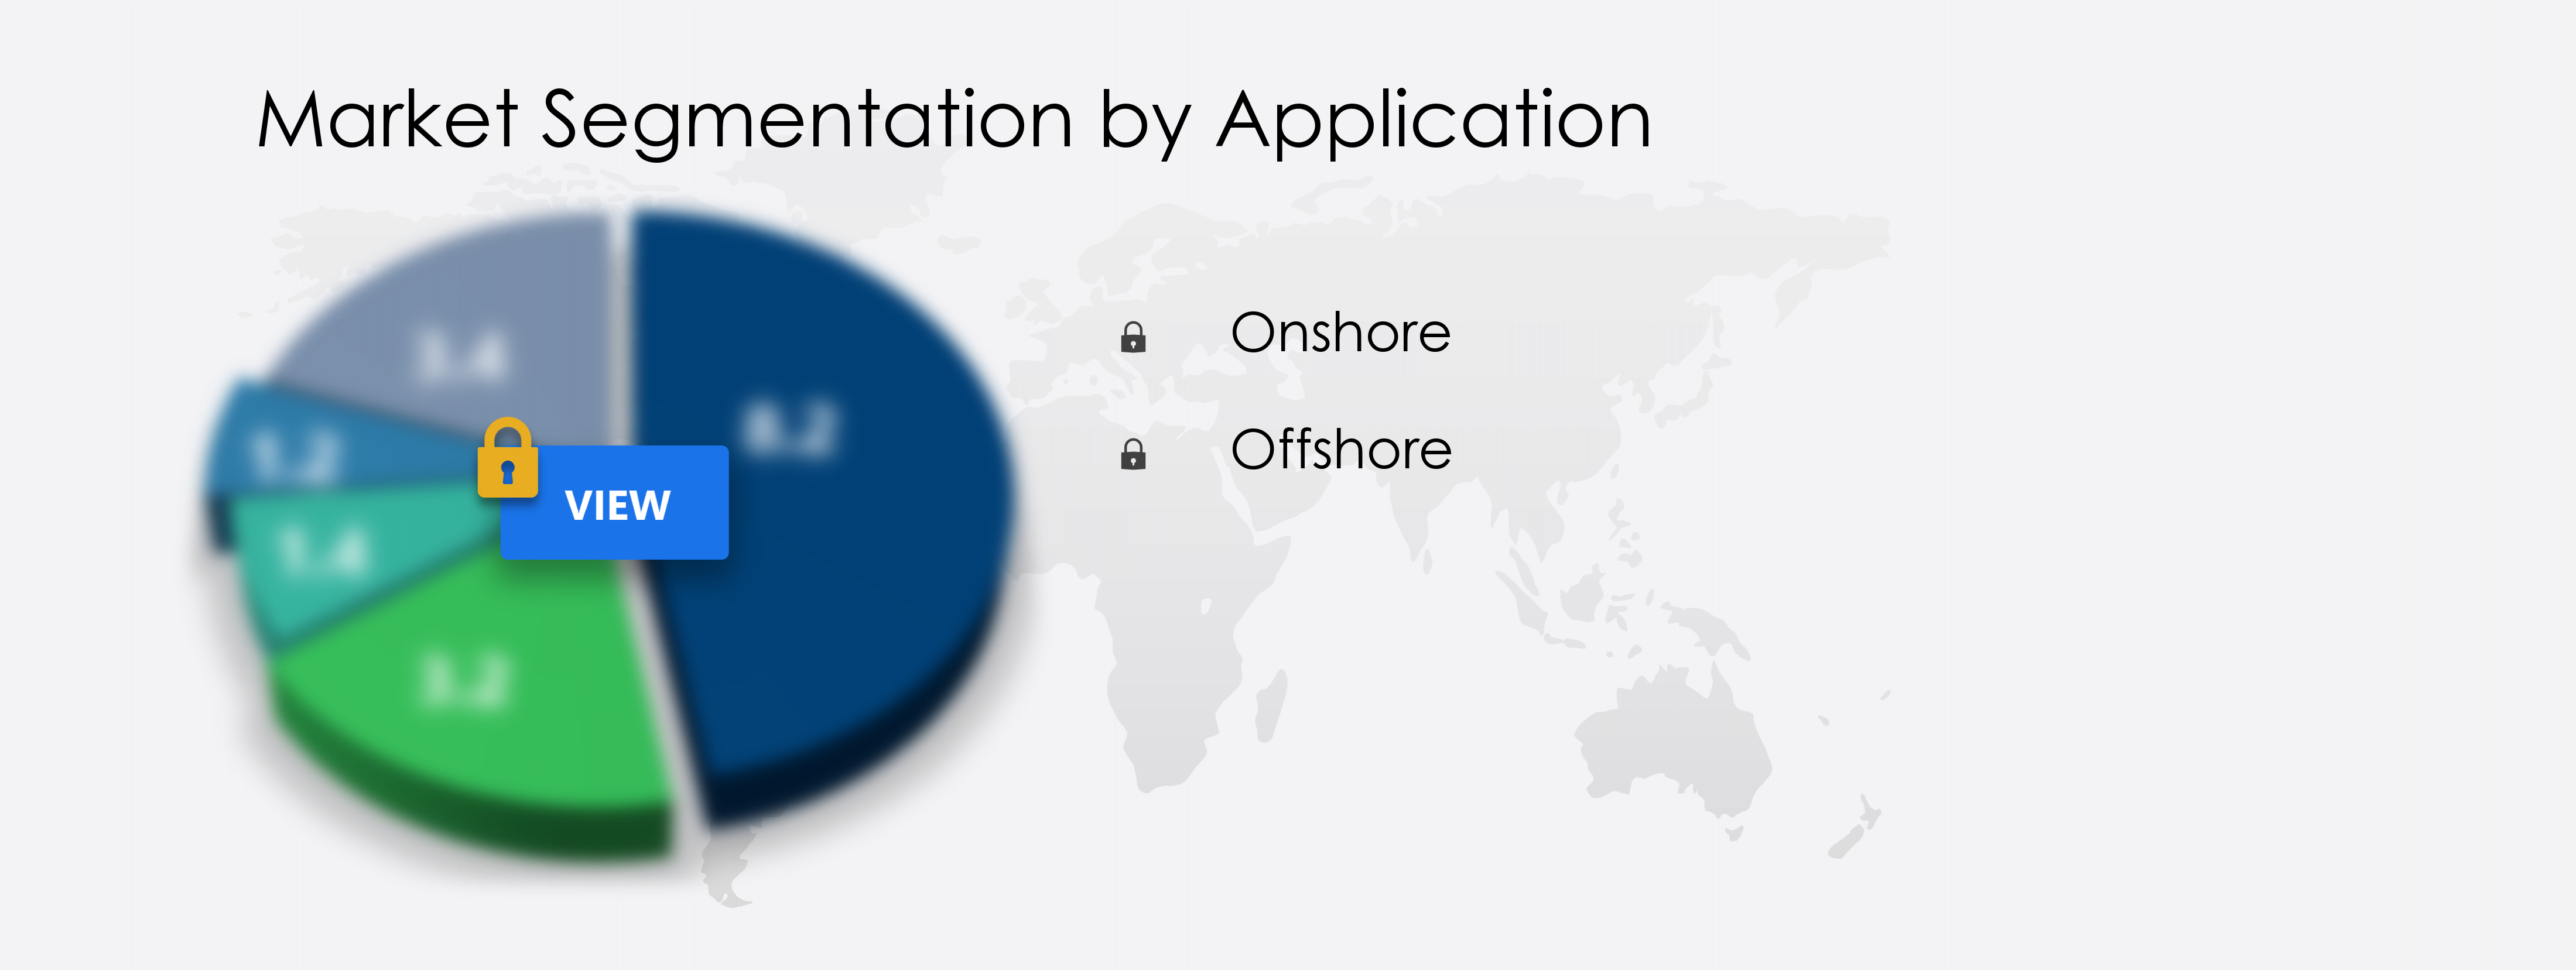
What are the Revenue-generating Application Segments in the Horizontal Directional Drilling Market?

To gain further insights on the market contribution of various segments Request for a FREE sample

The horizontal directional drilling market share growth by the onshore segment will be significant during the forecast period. Onshore E&P activities have a lower cost of operation and require less advanced technologies to drill compared with offshore E&P activities. As a result, their adoption is high. The recent recovery of the global crude oil prices has resulted in increased investments by the US oil and gas producers in shale oil and gas. Most of the US oil and gas producing regions are onshore. The increase in E&P activities in the US will contribute to the growth of the onshore segment of the market. 

This report provides an accurate prediction of the contribution of all the segments to the growth of the horizontal directional drilling market size and actionable market insights on post COVID-19 impact on each segment.

You may be interested in:

Directional Drilling market - The market size will grow by USD 4.36 billion during the 2019-2023 forecast period.

Offshore Drilling market - The market share is expected to increase by USD 7.04 billion from 2020 to 2025, and the market's growth momentum will accelerate at a CAGR of 4.36%. 

Logging While Drilling market - The market size has the potential to grow by USD 556.71 million during 2020-2024, and the market's growth momentum will accelerate during the forecast period.

Horizontal Directional Drilling Market Scope

Report Coverage

Details

Page number

120

Base year

2021

Forecast period

2022-2026

Growth momentum & CAGR

Accelerate at a CAGR of 7.96%

Market growth 2022-2026

$ 3.28 billion

Market structure

Fragmented

YoY growth (%)

6.64

Regional analysis

North America, APAC, Europe, Middle East and Africa, and South America

Performing market contribution

North America at 53%

Key consumer countries

US, Canada, China, India, and Russia

Competitive landscape

Leading companies, Competitive strategies, Consumer engagement scope

Key companies profiled

APS Technology Inc., Baker Hughes Co., Barbco Inc., China Oilfield Services Ltd.  , Cathedral Energy Services Ltd., Compass Directional Services Ltd., Halliburton Co., Helmerich and Payne Inc., Huisman Equipment BV, Koltek LLC, Millennium Directional Service Ltd., MS Directional, Nabors Industries Ltd., National Energy Services Reunited Corp., NOV Inc., PHX Energy Services Corp., Precision HDD LLC, Schlumberger Ltd., Scientific Drilling International, and Weatherford International Plc

Market dynamics

Parent market analysis, Market growth inducers and obstacles, Fast-growing and slow-growing segment analysis, COVID-19 impact and recovery analysis and future consumer dynamics, Market condition analysis for the forecast period

Customization purview

If our report has not included the data that you are looking for, you can reach out to our analysts and get segments customized.

Request for a FREE sample

What are the Key Data Covered in this Horizontal Directional Drilling Market Report?

  • CAGR of the market during the forecast period 2022-2026
  • Detailed information on factors that will drive horizontal directional drilling market growth during the next five years
  • Precise estimation of the horizontal directional drilling market size and its contribution to the parent market
  • Accurate predictions on upcoming trends and changes in consumer behavior
  • The growth of the horizontal directional drilling industry across North America, APAC, Europe, Middle East and Africa, and South America
  • A thorough analysis of the market’s competitive landscape and detailed information on vendors
  • Comprehensive details of factors that will challenge the growth of horizontal directional drilling market vendors

We can help! Our analysts can customize this report to meet your requirements. Get in touch

1 Executive Summary

  • 1.1 Market overview
    • Exhibit 01: Executive Summary – Chart on Market Overview
    • Exhibit 02: Executive Summary – Data Table on Market Overview
    • Exhibit 03: Executive Summary – Chart on Global Market Characteristics
    • Exhibit 04: Executive Summary – Chart on Market by Geography
    • Exhibit 05: Executive Summary – Chart on Market Segmentation by Application
    • Exhibit 06: Executive Summary – Chart on Incremental Growth
    • Exhibit 07: Executive Summary – Data Table on Incremental Growth
    • Exhibit 08: Executive Summary – Chart on Vendor Market Positioning

2 Market Landscape

  • 2.1 Market ecosystem
    • Exhibit 09: Parent market
    • Exhibit 10: Market Characteristics

3 Market Sizing

  • 3.1 Market definition
    • Exhibit 11: Offerings of vendors included in the market definition
  • 3.2 Market segment analysis
    • Exhibit 12: Market segments
  • 3.3 Market size 2021
    • 3.4 Market outlook: Forecast for 2021-2026
      • Exhibit 13: Chart on Global - Market size and forecast 2021-2026 ($ million)
      • Exhibit 14: Data Table on Global - Market size and forecast 2021-2026 ($ million)
      • Exhibit 15: Chart on Global Market: Year-over-year growth 2021-2026 (%)
      • Exhibit 16: Data Table on Global Market: Year-over-year growth 2021-2026 (%)

    4 Five Forces Analysis

    • 4.1 Five forces summary
      • Exhibit 17: Five forces analysis - Comparison between 2021 and 2026
    • 4.2 Bargaining power of buyers
      • Exhibit 18: Bargaining power of buyers – Impact of key factors in 2021 and 2026
    • 4.3 Bargaining power of suppliers
      • Exhibit 19: Bargaining power of suppliers – Impact of key factors in 2021 and 2026
    • 4.4 Threat of new entrants
      • Exhibit 20: Threat of new entrants – Impact of key factors in 2021 and 2026
    • 4.5 Threat of substitutes
      • Exhibit 21: Threat of substitutes – Impact of key factors in 2021 and 2026
    • 4.6 Threat of rivalry
      • Exhibit 22: Threat of rivalry – Impact of key factors in 2021 and 2026
    • 4.7 Market condition
      • Exhibit 23: Chart on Market condition - Five forces 2021 and 2026

    5 Market Segmentation by Application

    • 5.1 Market segments
      • Exhibit 24: Chart on Application - Market share 2021-2026 (%)
      • Exhibit 25: Data Table on Application - Market share 2021-2026 (%)
    • 5.2 Comparison by Application
      • Exhibit 26: Chart on Comparison by Application
      • Exhibit 27: Data Table on Comparison by Application
    • 5.3 Onshore - Market size and forecast 2021-2026
      • Exhibit 28: Chart on Onshore - Market size and forecast 2021-2026 ($ million)
      • Exhibit 29: Data Table on Onshore - Market size and forecast 2021-2026 ($ million)
      • Exhibit 30: Chart on Onshore - Year-over-year growth 2021-2026 (%)
      • Exhibit 31: Data Table on Onshore - Year-over-year growth 2021-2026 (%)
    • 5.4 Offshore - Market size and forecast 2021-2026
      • Exhibit 32: Chart on Offshore - Market size and forecast 2021-2026 ($ million)
      • Exhibit 33: Data Table on Offshore - Market size and forecast 2021-2026 ($ million)
      • Exhibit 34: Chart on Offshore - Year-over-year growth 2021-2026 (%)
      • Exhibit 35: Data Table on Offshore - Year-over-year growth 2021-2026 (%)
    • 5.5 Market opportunity by Application
      • Exhibit 36: Market opportunity by Application ($ million)

    6 Customer Landscape

    • 6.1 Customer landscape overview
      • Exhibit 37: Analysis of price sensitivity, lifecycle, customer purchase basket, adoption rates, and purchase criteria

    7 Geographic Landscape

    • 7.1 Geographic segmentation
      • Exhibit 38: Chart on Market share by geography 2021-2026 (%)
      • Exhibit 39: Data Table on Market share by geography 2021-2026 (%)
    • 7.2 Geographic comparison
      • Exhibit 40: Chart on Geographic comparison
      • Exhibit 41: Data Table on Geographic comparison
    • 7.3 North America - Market size and forecast 2021-2026
      • Exhibit 42: Chart on North America - Market size and forecast 2021-2026 ($ million)
      • Exhibit 43: Data Table on North America - Market size and forecast 2021-2026 ($ million)
      • Exhibit 44: Chart on North America - Year-over-year growth 2021-2026 (%)
      • Exhibit 45: Data Table on North America - Year-over-year growth 2021-2026 (%)
    • 7.4 APAC - Market size and forecast 2021-2026
      • Exhibit 46: Chart on APAC - Market size and forecast 2021-2026 ($ million)
      • Exhibit 47: Data Table on APAC - Market size and forecast 2021-2026 ($ million)
      • Exhibit 48: Chart on APAC - Year-over-year growth 2021-2026 (%)
      • Exhibit 49: Data Table on APAC - Year-over-year growth 2021-2026 (%)
    • 7.5 Europe - Market size and forecast 2021-2026
      • Exhibit 50: Chart on Europe - Market size and forecast 2021-2026 ($ million)
      • Exhibit 51: Data Table on Europe - Market size and forecast 2021-2026 ($ million)
      • Exhibit 52: Chart on Europe - Year-over-year growth 2021-2026 (%)
      • Exhibit 53: Data Table on Europe - Year-over-year growth 2021-2026 (%)
    • 7.6 Middle East and Africa - Market size and forecast 2021-2026
      • Exhibit 54: Chart on Middle East and Africa - Market size and forecast 2021-2026 ($ million)
      • Exhibit 55: Data Table on Middle East and Africa - Market size and forecast 2021-2026 ($ million)
      • Exhibit 56: Chart on Middle East and Africa - Year-over-year growth 2021-2026 (%)
      • Exhibit 57: Data Table on Middle East and Africa - Year-over-year growth 2021-2026 (%)
    • 7.7 South America - Market size and forecast 2021-2026
      • Exhibit 58: Chart on South America - Market size and forecast 2021-2026 ($ million)
      • Exhibit 59: Data Table on South America - Market size and forecast 2021-2026 ($ million)
      • Exhibit 60: Chart on South America - Year-over-year growth 2021-2026 (%)
      • Exhibit 61: Data Table on South America - Year-over-year growth 2021-2026 (%)
    • 7.8 US - Market size and forecast 2021-2026
      • Exhibit 62: Chart on US - Market size and forecast 2021-2026 ($ million)
      • Exhibit 63: Data Table on US - Market size and forecast 2021-2026 ($ million)
      • Exhibit 64: Chart on US - Year-over-year growth 2021-2026 (%)
      • Exhibit 65: Data Table on US - Year-over-year growth 2021-2026 (%)
    • 7.9 China - Market size and forecast 2021-2026
      • Exhibit 66: Chart on China - Market size and forecast 2021-2026 ($ million)
      • Exhibit 67: Data Table on China - Market size and forecast 2021-2026 ($ million)
      • Exhibit 68: Chart on China - Year-over-year growth 2021-2026 (%)
      • Exhibit 69: Data Table on China - Year-over-year growth 2021-2026 (%)
    • 7.10 Russia - Market size and forecast 2021-2026
      • Exhibit 70: Chart on Russia - Market size and forecast 2021-2026 ($ million)
      • Exhibit 71: Data Table on Russia - Market size and forecast 2021-2026 ($ million)
      • Exhibit 72: Chart on Russia - Year-over-year growth 2021-2026 (%)
      • Exhibit 73: Data Table on Russia - Year-over-year growth 2021-2026 (%)
    • 7.11 Canada - Market size and forecast 2021-2026
      • Exhibit 74: Chart on Canada - Market size and forecast 2021-2026 ($ million)
      • Exhibit 75: Data Table on Canada - Market size and forecast 2021-2026 ($ million)
      • Exhibit 76: Chart on Canada - Year-over-year growth 2021-2026 (%)
      • Exhibit 77: Data Table on Canada - Year-over-year growth 2021-2026 (%)
    • 7.12 India - Market size and forecast 2021-2026
      • Exhibit 78: Chart on India - Market size and forecast 2021-2026 ($ million)
      • Exhibit 79: Data Table on India - Market size and forecast 2021-2026 ($ million)
      • Exhibit 80: Chart on India - Year-over-year growth 2021-2026 (%)
      • Exhibit 81: Data Table on India - Year-over-year growth 2021-2026 (%)
    • 7.13 Market opportunity by geography
      • Exhibit 82: Market opportunity by geography ($ million)

    8 Drivers, Challenges, and Trends

    • 8.1 Market drivers
      • 8.2 Market challenges
        • 8.3 Impact of drivers and challenges
          • Exhibit 83: Impact of drivers and challenges in 2021 and 2026
        • 8.4 Market trends

          9 Vendor Landscape

          • 9.1 Overview
            • 9.2 Vendor landscape
              • Exhibit 84: Overview on Criticality of inputs and Factors of differentiation
            • 9.3 Landscape disruption
              • Exhibit 85: Overview on factors of disruption
            • 9.4 Industry risks
              • Exhibit 86: Impact of key risks on business

            10 Vendor Analysis

            • 10.1 Vendors covered
              • Exhibit 87: Vendors covered
            • 10.2 Market positioning of vendors
              • Exhibit 88: Matrix on vendor position and classification
            • 10.3 Baker Hughes Co.
              • Exhibit 89: Baker Hughes Co. - Overview
              • Exhibit 90: Baker Hughes Co. - Business segments
              • Exhibit 91: Baker Hughes Co. - Key news
              • Exhibit 92: Baker Hughes Co. - Key offerings
              • Exhibit 93: Baker Hughes Co. - Segment focus
            • 10.4 Barbco Inc.
              • Exhibit 94: Barbco Inc. - Overview
              • Exhibit 95: Barbco Inc. - Product / Service
              • Exhibit 96: Barbco Inc. - Key offerings
            • 10.5 Halliburton Co.
              • Exhibit 97: Halliburton Co. - Overview
              • Exhibit 98: Halliburton Co. - Business segments
              • Exhibit 99: Halliburton Co. - Key news
              • Exhibit 100: Halliburton Co. - Key offerings
              • Exhibit 101: Halliburton Co. - Segment focus
            • 10.6 Helmerich and Payne Inc.
              • Exhibit 102: Helmerich and Payne Inc. - Overview
              • Exhibit 103: Helmerich and Payne Inc. - Business segments
              • Exhibit 104: Helmerich and Payne Inc. - Key offerings
              • Exhibit 105: Helmerich and Payne Inc. - Segment focus
            • 10.7 Huisman Equipment BV
              • Exhibit 106: Huisman Equipment BV - Overview
              • Exhibit 107: Huisman Equipment BV - Product / Service
              • Exhibit 108: Huisman Equipment BV - Key offerings
            • 10.8 Koltek LLC
              • Exhibit 109: Koltek LLC - Overview
              • Exhibit 110: Koltek LLC - Product / Service
              • Exhibit 111: Koltek LLC - Key offerings
            • 10.9 Nabors Industries Ltd.
              • Exhibit 112: Nabors Industries Ltd. - Overview
              • Exhibit 113: Nabors Industries Ltd. - Business segments
              • Exhibit 114: Nabors Industries Ltd. - Key news
              • Exhibit 115: Nabors Industries Ltd. - Key offerings
              • Exhibit 116: Nabors Industries Ltd. - Segment focus
            • 10.10 Schlumberger Ltd.
              • Exhibit 117: Schlumberger Ltd. - Overview
              • Exhibit 118: Schlumberger Ltd. - Business segments
              • Exhibit 119: Schlumberger Ltd. - Key offerings
              • Exhibit 120: Schlumberger Ltd. - Segment focus
            • 10.11 Scientific Drilling International
              • Exhibit 121: Scientific Drilling International - Overview
              • Exhibit 122: Scientific Drilling International - Product / Service
              • Exhibit 123: Scientific Drilling International - Key offerings
            • 10.12 Weatherford International Plc
              • Exhibit 124: Weatherford International Plc - Overview
              • Exhibit 125: Weatherford International Plc - Business segments
              • Exhibit 126: Weatherford International Plc - Key offerings
              • Exhibit 127: Weatherford International Plc - Segment focus

            11 Appendix

            • 11.1 Scope of the report
              • 11.2 Inclusions and exclusions checklist
                • Exhibit 128: Inclusions checklist
              • 11.3 Currency conversion rates for US$
                • Exhibit 129: Currency conversion rates for US$
              • 11.4 Research methodology
                • Exhibit 130: Research methodology
                • Exhibit 131: Validation techniques employed for market sizing
                • Exhibit 132: Information sources
              • 11.5 List of abbreviations
                • Exhibit 133: List of abbreviations

              Research Methodology

              Technavio presents a detailed picture of the market by way of study, synthesis, and summation of data from multiple sources. The analysts have presented the various facets of the market with a particular focus on identifying the key industry influencers. The data thus presented is comprehensive, reliable, and the result of extensive research, both primary and secondary.

              INFORMATION SOURCES

              Primary sources

              • Manufacturers and suppliers
              • Channel partners
              • Industry experts
              • Strategic decision makers

              Secondary sources

              • Industry journals and periodicals
              • Government data
              • Financial reports of key industry players
              • Historical data
              • Press releases

              DATA ANALYSIS

              Data Synthesis

              • Collation of data
              • Estimation of key figures
              • Analysis of derived insights

              Data Validation

              • Triangulation with data models
              • Reference against proprietary databases
              • Corroboration with industry experts

              REPORT WRITING

              Qualitative

              • Market drivers
              • Market challenges
              • Market trends
              • Five forces analysis

              Quantitative

              • Market size and forecast
              • Market segmentation
              • Geographical insights
              • Competitive landscape

              Interested in this report?

              Get your sample now to see our research methodology and insights!

              Download Now

              Frequently Asked Questions

              Horizontal Directional Drilling market growth will increase by 3280.38 million during 2021-2026.

              The Horizontal Directional Drilling market is expected to grow at a CAGR of 7.96% during 2021-2026.

              Horizontal Directional Drilling market is segmented by Application( Onshore, Offshore) Geographic( North America, APAC, Europe, Middle East and Africa, South America)

              APS Technology Inc., Baker Hughes Co., Barbco Inc., China Oilfield Services Ltd.?é?á?é?á, Cathedral Energy Services Ltd., Compass Directional Services Ltd., Halliburton Co., Helmerich and Payne Inc., Huisman Equipment BV, Koltek LLC, Millennium Directional Service Ltd., MS Directional, Nabors Industries Ltd., National Energy Services Reunited Corp., NOV Inc., PHX Energy Services Corp., Precision HDD LLC, Schlumberger Ltd., Scientific Drilling International, Weatherford International Plc are a few of the key vendors in the Horizontal Directional Drilling market.

              North America will register the highest growth rate of 53.27% among the other regions. Therefore, the Horizontal Directional Drilling market in North America is expected to garner significant business opportunities for the vendors during the forecast period.

              US, Canada, China, India, Russia

              • Rising unconventional drilling activitiesShale is a low-permeability sedimentary rock formation is the driving factor this market.
              • which contains trapped oil and gas. Shale rocks are a good source of petroleum is the driving factor this market.
              • and they ensure that the oil or gas is not lost through the cracks of the rock. To harness oil and gas from these rocks is the driving factor this market.
              • horizontal directional drilling and hydraulic fracturing are used. The production process of shale gas involves the application of pressure using a combination of water is the driving factor this market.
              • sand is the driving factor this market.
              • chemicals is the driving factor this market.
              • and other stimulation fluids to fracture the rock and allow the oil and gas to rise to the surface where it is collected for processing. Adoption of unconventional drilling technologies in regions with large shale deposits has widened opportunities for upstream oil and gas companies in countries like the US and Canada. Large oil and gas producers such as Chevron is the driving factor this market.
              • Exxon Mobil is the driving factor this market.
              • and ConocoPhillips have increased their investments in shale oil and gas. Thus is the driving factor this market.
              • an increase in unconventional oil and gas drilling activities are likely to boost the market as horizontal directional drilling is the major technology employed in the process. Therefore is the driving factor this market.
              • the rising unconventional drilling activities lead to an increase in drilling activities is the driving factor this market.
              • thereby driving the market. is the driving factor this market.

              The Horizontal Directional Drilling market vendors should focus on grabbing business opportunities from the Onshore segment as it accounted for the largest market share in the base year.