High Purity Alumina Market Analysis APAC, North America, Europe, South America, Middle East and Africa - China, Taiwan, US, South Korea, Japan - Size and Forecast 2024-2028

High Purity Alumina Market Analysis APAC, North America, Europe, South America, Middle East and Africa - China, Taiwan, US, South Korea, Japan - Size and Forecast 2024-2028

Published: May 2024 181 Pages SKU: IRTNTR41567

Market Overview at a Glance

$6.83 B
Market Opportunity
33.95%
CAGR
26.78
YoY growth 2023-2024(%)

High Purity Alumina Market Size 2024-2028

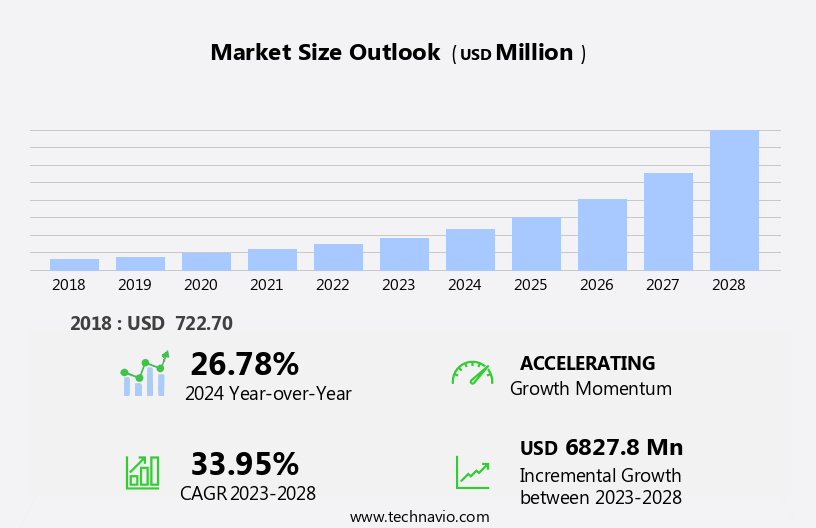
The high purity alumina market size is forecast to increase by USD 6.83 billion at a CAGR of 33.95% between 2023 and 2028.

  • The high purity alumina (HPA) market is experiencing significant growth due to several key trends. The increasing adoption of LED lighting and the declining manufacturing costs of LED and lithium-ion batteries are major drivers for the market. However, the high cost of production of HPA remains a significant challenge. The rising demand for HPA in various end-use industries, such as electronics, refractories, and catalysts, is also contributing to market growth. 
  • Additionally, the development of new applications for HPA in emerging technologies, such as fuel cells and solar panels, is expected to further boost market demand. Despite these opportunities, the market faces challenges such as stringent regulations and the availability of alternative materials.
  • To remain competitive, market participants must focus on reducing production costs and improving efficiency while maintaining high product quality. Overall, the HPA market is poised for steady growth In the coming years due to its essential role in various high-tech industries.

What will be the Size of the High Purity Alumina Market During the Forecast Period?

High Purity Alumina Market Size

 Request Free Sample

  • The high-purity alumina (HPA) market experiences significant growth due to its increasing application in various industries, particularly In the production of batteries for electric vehicles (EVs) and lithium-ion batteries. HPA is essential in manufacturing separator sheets for these batteries, which ensure optimal battery performance and durability. Beyond batteries, HPA finds extensive use In the lighting sector, contributing to energy-efficient LED lighting technology and LCD displays. 
  • In microelectronics, HPA is indispensable in the production of sapphire substrates for semiconductors and LEDs. Additionally, HPA plays a crucial role in gas separation processes, including the production of boehmite, a chemical product used in wastewater treatment and ultra-filtration processes.
  • The demand for HPA continues to escalate as industries prioritize energy efficiency and sustainability, with the Energy Department's lighting installation projects and advancements in LED lighting technology driving market growth.

How is this High Purity Alumina Industry segmented and which is the largest segment?

The high purity alumina industry research report provides comprehensive data (region-wise segment analysis), with forecasts and estimates in "USD billion" for the period 2024-2028, as well as historical data from 2018-2022 for the following segments.

  • Application
    • LEDs
    • Semiconductors
    • Phosphors
    • Others
  • Type
    • 4N HPA
    • 5N HPA
    • 6N HPA
  • Geography
    • APAC
      • China
      • Japan
      • South Korea
    • North America
      • US
    • Europe
    • South America
    • Middle East and Africa

By Application Insights

The LEDs segment is estimated to witness significant growth during the forecast period. High-Purity Alumina (HPA) plays a pivotal role In the manufacturing of sapphire crystals, which serve as substrates In the production of Light Emitting Diodes (LEDs). LEDs, with their superior brightness and energy efficiency, are extensively utilized in various applications, including automobile headlights, home illumination projects, multimedia displays, advertisement lighting, and backlights in electronic devices. The rising adoption of energy-efficient LED lighting technology over conventional lights and lamps is expected to boost the demand for HPA In the LED industry. Additionally, HPA is employed In the production of alumina-coated separators for lithium-ion batteries used in electric vehicles (EVs) and mobile phones, enhancing battery performance and durability. The increasing focus on reducing electricity consumption and the growing popularity of LED technology in various industries will further fuel the market growth for HPA.

High Purity Alumina Market Size

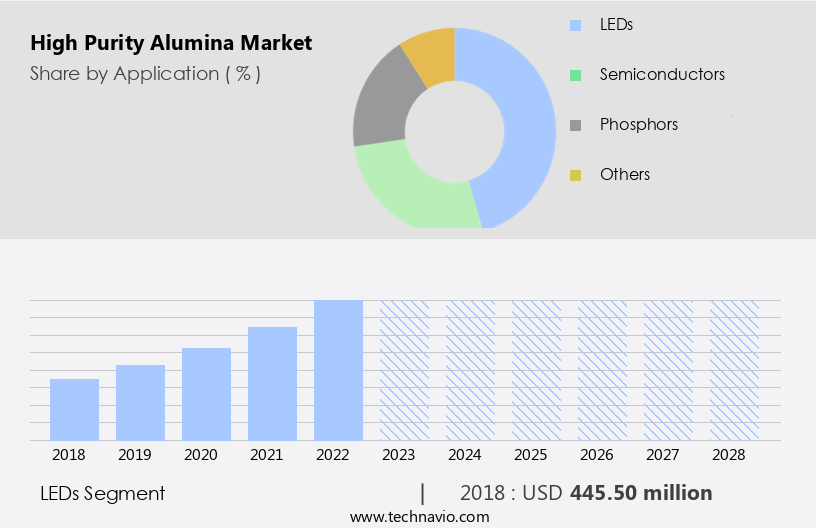
Get a glance at the share of various segments. Request Free Sample

The LEDs segment was valued at USD 445.50 million in 2018 and showed a gradual increase during the forecast period.
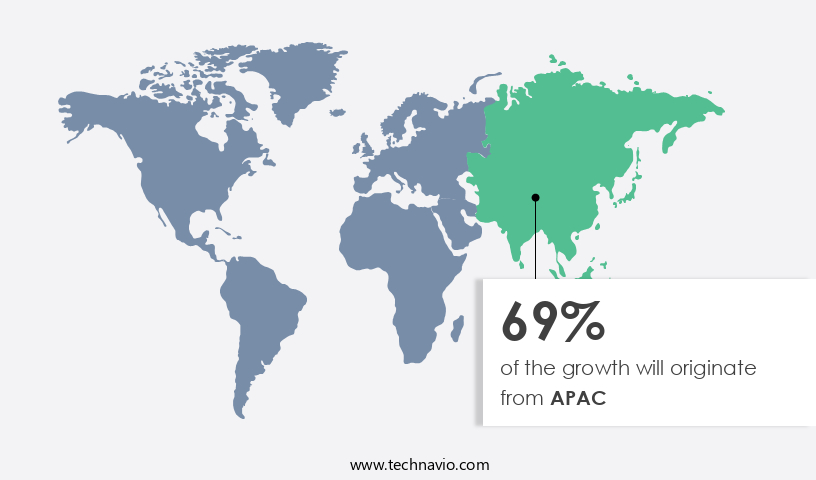
Regional Analysis

APAC is estimated to contribute 69% to the growth of the global market during the forecast period. Technavio's analysts have elaborately explained the regional trends and drivers that shape the market during the forecast period.

High Purity Alumina Market Share by Geography

For more insights on the market share of various regions, Request Free Sample

High Purity Alumina (HPA) is a critical industrial intermediate with significant applications in various sectors, including LED lighting, semiconductors, and lithium-ion batteries. The Asia Pacific (APAC) region dominates the global HPA market due to its large consumer base and robust manufacturing industry. Key APAC countries, such as China, Japan, South Korea, India, Australia, New Zealand, and Indonesia, are significant consumers of HPA. The rapid growth of the APAC HPA market can be attributed to the expanding demand for energy-efficient technologies like LED lighting and semiconductors. The semiconductor industry, which includes countries like China, Japan, Taiwan, Vietnam, South Korea, Singapore, and Malaysia, is a significant contributor to the global semiconductor market.

Additionally, the industrial LED market, which is a major consumer of HPA, is also experiencing substantial growth. The increasing demand for high-performance, durable batteries, particularly in electric vehicles (EVs) and mobile phones, is driving the demand for HPA In the lithium-ion battery sector. HPA is used In the production of alumina-coated separators, anode and cathode materials, and thermal capacity materials, ensuring optimal battery performance and durability. The HPA market's growth is also influenced by the increasing focus on energy efficiency and the reduction of electricity consumption in various industries.

Market Dynamics

Our  researchers analyzed the data with 2023 as the base year, along with the key drivers, trends, and challenges. A holistic analysis of drivers will help companies refine their marketing strategies to gain a competitive advantage.

What are the key market drivers leading to the rise In the adoption of High Purity Alumina Industry?

Rising adoption of LED lighting is the key driver of the market.

  • The High Purity Alumina (HPA) market is witnessing significant growth due to its extensive applications in various industries, particularly In the production of lithium-ion batteries for electric vehicles (EVs) and batteries for LED lighting technology. The demand for HPA is driven by the increasing adoption of EVs and the growing focus on energy efficiency and eco-friendliness. HPA is used In the manufacturing of alumina-coated separators, which play a crucial role in improving battery performance and durability by preventing the anode and cathode from coming into direct contact and preventing thermal capacity issues such as thermal runaway and burns. In addition to batteries, HPA is also used In the production of sapphire for LED lighting, scratch-resistant glass, optical lenses, and LED preparation.
  • The LED lighting market is experiencing continued growth due to the high adoption of smart lighting systems and the need to reduce electricity consumption. The use of HPA in LED lighting technology also contributes to the production of energy-efficient and eco-friendly lights. Furthermore, HPA is used In the manufacturing of semiconductor wafers for microelectronics, including Silicon Carbide and Gallium Nitride, which are essential components in various electronic devices such as mobile phones, watches, televisions, and LCD screens. HPA is also used In the recovery of Boehmite, a chemical product used in gas separation and ultra-filtration processes. In conclusion, the HPA market is experiencing significant growth due to its extensive applications in various industries, including batteries, LED lighting, microelectronics, and chemical products.

What are the market trends shaping the High Purity Alumina Industry?

Declining manufacturing cost of LED and lithium-ion batteries is the upcoming market trend.

  • The High Purity Alumina (HPA) market has experienced significant growth due to the increasing demand for lithium-ion batteries, particularly In the electric vehicles (EVs) sector. HPA is a crucial component In the production of alumina-coated separators used in lithium-ion batteries, which enhance battery performance and durability. The demand for HPA is also driven by the expanding use of LED technology in lighting installation projects, as HPA is used In the production of LEDs, sapphire, and other energy-efficient products. The cost reduction in manufacturing LEDs between 2012 and 2020 has led to a surge in demand for LED-based products, including LED lighting, LCD screens, and microelectronics.
  • HPA's role in producing high-quality separator sheets with nano-thickness has contributed to the improvement of battery stability and reduction of capacity losses. Furthermore, HPA is used In the production of anode and cathode materials in EV batteries, which require high thermal capacity to prevent thermal runaway and potential burns. Moreover, HPA is used In the production of scratch-resistant glass, optical lenses, and LED preparation. The demand for HPA In the semiconductor industry is also increasing due to its use In the production of Silicon Carbide, Gallium Nitride, and other semiconductor wafers. The growth in HPA demand is expected to continue as the market for energy-efficient products expands.

What challenges does the High Purity Alumina Industry face during its growth?

High cost of production of HPA is a key challenge affecting the industry growth.

  • High Purity Alumina (HPA) is a crucial component in various industries, including batteries for electric vehicles (EVs) and lithium-ion batteries. The demand for HPA is driven by the growing adoption of EVs and the advancement of energy-efficient technologies such as LED lighting and LCD screens. HPA is used In the production of alumina-coated separators for lithium-ion batteries, which enhance battery performance and durability. In the battery industry, HPA is used to manufacture anode and cathode materials for EV batteries. Its thermal capacity helps prevent thermal runaway and subsequent battery burns. HPA is also used In the production of sapphire for LED technology, scratch-resistant glass for watches and televisions, and optical lenses.
  • The production of HPA involves various methods, including the thermal decomposition method, water-soluble process, and alkoxide hydrolysis process. The thermal decomposition method uses ammonium aluminum sulfate or ammonium aluminum carbonate hydroxide as raw materials. The increasing cost of raw materials, energy, and labor, along with stringent government regulations, contribute to the high production cost of HPA. Furthermore, HPA is used In the production of semiconductor wafers made from Silicon Carbide and Gallium Nitride. In the energy sector, HPA is used in gas separation and ultra-filtration processes for LEDs and other energy-efficient applications. In conclusion, HPA is a high-value product with a wide range of applications in various industries.

Exclusive Customer Landscape

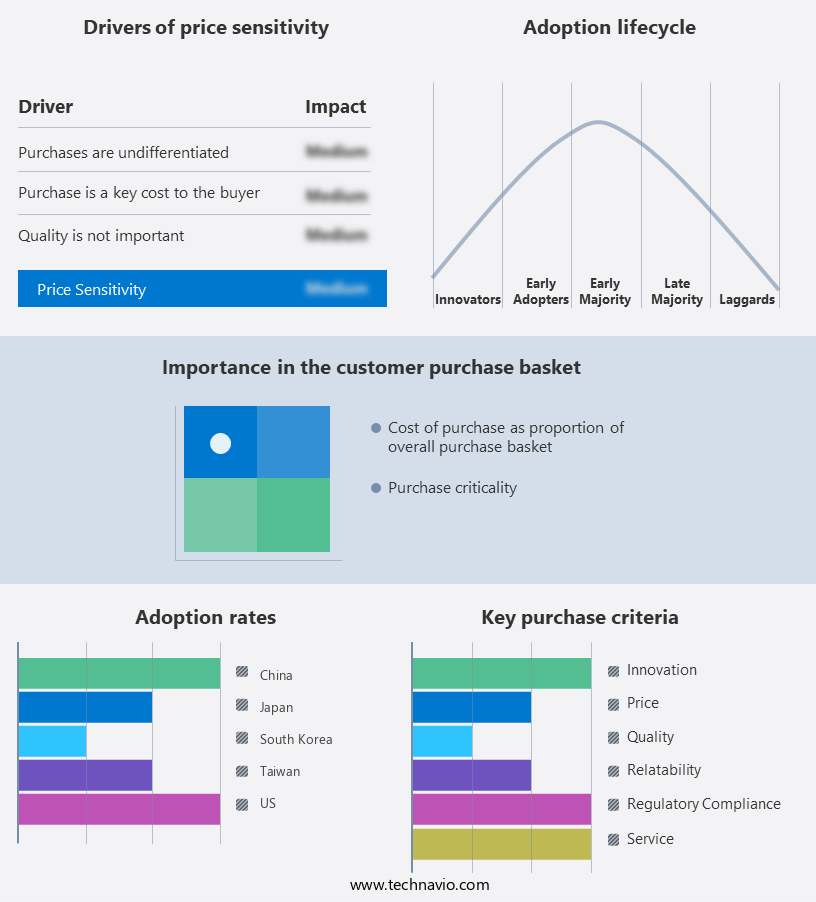
The high purity alumina market forecasting report includes the adoption lifecycle of the market, covering from the innovator's stage to the laggard's stage. It focuses on adoption rates in different regions based on penetration. Furthermore, the high purity alumina market report also includes key purchase criteria and drivers of price sensitivity to help companies evaluate and develop their market growth analysis strategies.

High Purity Alumina Market Share by Geography

 Customer Landscape

Key Companies & Market Insights

Companies are implementing various strategies, such as strategic alliances, high purity alumina market forecast, partnerships, mergers and acquisitions, geographical expansion, and product/service launches, to enhance their presence In the industry.

Advanced Energy Minerals - High Purity Alumina (HPA) is a critical material used in various industries, including electronics, refractories, and chemicals. The global HPA market is driven by increasing demand for advanced technologies, such as lithium-ion batteries and LED lighting. HPA is produced through the calcination of bauxite ore, followed by the precipitation of aluminum hydroxide and subsequent heating to produce alumina trihydrate (ATH) or alumina trioxide (Al2O3).

The industry research and growth report includes detailed analyses of the competitive landscape of the market and information about key companies, including:

  • Advanced Energy Minerals
  • Alcoa Corp.
  • Alpha HPA Ltd.
  • Altech Advanced Materials AG
  • Altech Chemicals Ltd.
  • AluChem Inc.
  • Baikowski SA
  • CoorsTek Inc.
  • Devtaar GmbH
  • FYI Resources Ltd.
  • HPA Sonics
  • Nippon Light Metal Co. Ltd.
  • Norsk Hydro ASA
  • Orient Abrasives Ltd.
  • Oyak
  • Polar Sapphire Ltd.
  • Sasol Ltd.
  • Sumitomo Chemical Co. Ltd.
  • United Company RUSAL
  • Vizag Chemical International

Qualitative and quantitative analysis of companies has been conducted to help clients understand the wider business environment as well as the strengths and weaknesses of key industry players. Data is qualitatively analyzed to categorize companies as pure play, category-focused, industry-focused, and diversified; it is quantitatively analyzed to categorize companies as dominant, leading, strong, tentative, and weak.

Research Analyst Overview

High Purity Alumina (HPA) is a critical material in various industries, including electronics, energy storage, and optoelectronics. HPA is essential In the production of alumina-coated separators for lithium-ion (Li-ion) batteries, which are a key component in powering electric vehicles (EVs) and portable electronics. The demand for HPA is driven by the increasing adoption of energy-efficient technologies, such as LED lighting and LCD displays, which require high-quality alumina for their manufacturing. HPA is also used In the production of sapphire, a material used In the manufacturing of semiconductor wafers for microelectronics and In the production of scratch-resistant glass for watches and optical lenses.

The production of HPA involves several processes, including gas separation and ultra-filtration. These processes ensure the purity of the alumina, which is crucial for the optimal performance and durability of end-use applications. HPA is also used In the production of anodes and cathodes for Li-ion batteries, which require high thermal capacity to prevent thermal runaway and associated risks of burns. The use of HPA in Li-ion batteries is a significant market driver, as the demand for EVs and portable electronics continues to grow. HPA is also used In the production of LED lighting technology, which is becoming increasingly popular due to its energy efficiency and long lifespan.

The production of HPA involves the use of raw materials such as bauxite ore, which is processed through a series of chemical reactions to produce alumina trihydrate (ATH) and then further refined to produce HPA. The production process requires high temperatures and precise control of reaction conditions to ensure the purity of the final product. HPA is also used In the production of nano-thickness separator sheets for Li-ion batteries, which are essential for improving battery performance and reducing capacity losses. The use of HPA In these applications is expected to drive the growth of the HPA market In the coming years.

The HPA market is highly competitive, with several players producing and supplying the material to various industries. The market is also subject to fluctuations in raw material prices and production costs, which can impact the profitability of HPA producers. In conclusion, the HPA market is driven by the increasing demand for energy-efficient technologies and the need for high-purity alumina in various industries, including electronics, energy storage, and optoelectronics. The production of HPA involves several processes to ensure its purity and quality, making it a critical material for various end-use applications. The market is highly competitive, and producers must navigate fluctuations in raw material prices and production costs to remain profitable.

Market Scope

Report Coverage

Details

Page number

181

Base year

2023

Historic period

2018-2022

Forecast period

2024-2028

Growth momentum & CAGR

Accelerate at a CAGR of 33.95%

Market growth 2024-2028

USD 6.83 billion

Market structure

Fragmented

YoY growth 2023-2024(%)

26.78

Key countries

China, Taiwan, US, South Korea, and Japan

Competitive landscape

Leading Companies, Market Positioning of Companies, Competitive Strategies, and Industry Risks

Request Free Sample

What are the Key Data Covered in this High Purity Alumina Market Research and Growth Report?

  • CAGR of the High Purity Alumina industry during the forecast period
  • Detailed information on factors that will drive the growth and forecasting between 2024 and 2028
  • Precise estimation of the size of the market and its contribution of the industry in focus to the parent market
  • Accurate predictions about upcoming growth and trends and changes in consumer behaviour
  • Growth of the market across APAC, North America, Europe, South America, and Middle East and Africa
  • Thorough analysis of the market's competitive landscape and detailed information about companies
  • Comprehensive analysis of factors that will challenge the high purity alumina market growth of industry companies

We can help! Our analysts can customize this high purity alumina market research report to meet your requirements.

Get in touch

1 Executive Summary

  • 1.1 Market overview
    • Executive Summary - Chart on Market Overview
    • Executive Summary - Data Table on Market Overview
    • Executive Summary - Chart on Global Market Characteristics
    • Executive Summary - Chart on Market by Geography
    • Executive Summary - Chart on Market Segmentation by Application
    • Executive Summary - Chart on Market Segmentation by Type
    • Executive Summary - Chart on Incremental Growth
    • Executive Summary - Data Table on Incremental Growth
    • Executive Summary - Chart on Company Market Positioning

2 Market Landscape

  • 2.1 Market ecosystem
    • Parent Market
    • Data Table on - Parent Market
  • 2.2 Market characteristics
    • Market characteristics analysis
  • 2.3 Value chain analysis
    • Value Chain Analysis

3 Market Sizing

  • 3.1 Market definition
    • Offerings of companies included in the market definition
  • 3.2 Market segment analysis
    • Market segments
  • 3.3 Market size 2023
    • 3.4 Market outlook: Forecast for 2023-2028
      • Chart on Global - Market size and forecast 2023-2028 ($ million)
      • Data Table on Global - Market size and forecast 2023-2028 ($ million)
      • Chart on Global Market: Year-over-year growth 2023-2028 (%)
      • Data Table on Global Market: Year-over-year growth 2023-2028 (%)

    4 Historic Market Size

    • 4.1 Global High Purity Alumina Market 2018 - 2022
      • Historic Market Size - Data Table on Global High Purity Alumina Market 2018 - 2022 ($ million)
    • 4.2 Application segment analysis 2018 - 2022
      • Historic Market Size - Application Segment 2018 - 2022 ($ million)
    • 4.3 Type segment analysis 2018 - 2022
      • Historic Market Size - Type Segment 2018 - 2022 ($ million)
    • 4.4 Geography segment analysis 2018 - 2022
      • Historic Market Size - Geography Segment 2018 - 2022 ($ million)
    • 4.5 Country segment analysis 2018 - 2022
      • Historic Market Size - Country Segment 2018 - 2022 ($ million)

    5 Five Forces Analysis

    • 5.1 Five forces summary
      • Five forces analysis - Comparison between 2023 and 2028
    • 5.2 Bargaining power of buyers
      • Bargaining power of buyers - Impact of key factors 2023 and 2028
    • 5.3 Bargaining power of suppliers
      • Bargaining power of suppliers - Impact of key factors in 2023 and 2028
    • 5.4 Threat of new entrants
      • Threat of new entrants - Impact of key factors in 2023 and 2028
    • 5.5 Threat of substitutes
      • Threat of substitutes - Impact of key factors in 2023 and 2028
    • 5.6 Threat of rivalry
      • Threat of rivalry - Impact of key factors in 2023 and 2028
    • 5.7 Market condition
      • Chart on Market condition - Five forces 2023 and 2028

    6 Market Segmentation by Application

    • 6.1 Market segments
      • Chart on Application - Market share 2023-2028 (%)
      • Data Table on Application - Market share 2023-2028 (%)
    • 6.2 Comparison by Application
      • Chart on Comparison by Application
      • Data Table on Comparison by Application
    • 6.3 LEDs - Market size and forecast 2023-2028
      • Chart on LEDs - Market size and forecast 2023-2028 ($ million)
      • Data Table on LEDs - Market size and forecast 2023-2028 ($ million)
      • Chart on LEDs - Year-over-year growth 2023-2028 (%)
      • Data Table on LEDs - Year-over-year growth 2023-2028 (%)
    • 6.4 Semiconductors - Market size and forecast 2023-2028
      • Chart on Semiconductors - Market size and forecast 2023-2028 ($ million)
      • Data Table on Semiconductors - Market size and forecast 2023-2028 ($ million)
      • Chart on Semiconductors - Year-over-year growth 2023-2028 (%)
      • Data Table on Semiconductors - Year-over-year growth 2023-2028 (%)
    • 6.5 Phosphors - Market size and forecast 2023-2028
      • Chart on Phosphors - Market size and forecast 2023-2028 ($ million)
      • Data Table on Phosphors - Market size and forecast 2023-2028 ($ million)
      • Chart on Phosphors - Year-over-year growth 2023-2028 (%)
      • Data Table on Phosphors - Year-over-year growth 2023-2028 (%)
    • 6.6 Others - Market size and forecast 2023-2028
      • Chart on Others - Market size and forecast 2023-2028 ($ million)
      • Data Table on Others - Market size and forecast 2023-2028 ($ million)
      • Chart on Others - Year-over-year growth 2023-2028 (%)
      • Data Table on Others - Year-over-year growth 2023-2028 (%)
    • 6.7 Market opportunity by Application
      • Market opportunity by Application ($ million)
      • Data Table on Market opportunity by Application ($ million)

    7 Market Segmentation by Type

    • 7.1 Market segments
      • Chart on Type - Market share 2023-2028 (%)
      • Data Table on Type - Market share 2023-2028 (%)
    • 7.2 Comparison by Type
      • Chart on Comparison by Type
      • Data Table on Comparison by Type
    • 4N HPA - Market size and forecast 2023-2028
      • Chart on 4N HPA - Market size and forecast 2023-2028 ($ million)
      • Data Table on 4N HPA - Market size and forecast 2023-2028 ($ million)
      • Chart on 4N HPA - Year-over-year growth 2023-2028 (%)
      • Data Table on 4N HPA - Year-over-year growth 2023-2028 (%)
    • 5N HPA - Market size and forecast 2023-2028
      • Chart on 5N HPA - Market size and forecast 2023-2028 ($ million)
      • Data Table on 5N HPA - Market size and forecast 2023-2028 ($ million)
      • Chart on 5N HPA - Year-over-year growth 2023-2028 (%)
      • Data Table on 5N HPA - Year-over-year growth 2023-2028 (%)
    • 6N HPA - Market size and forecast 2023-2028
      • Chart on 6N HPA - Market size and forecast 2023-2028 ($ million)
      • Data Table on 6N HPA - Market size and forecast 2023-2028 ($ million)
      • Chart on 6N HPA - Year-over-year growth 2023-2028 (%)
      • Data Table on 6N HPA - Year-over-year growth 2023-2028 (%)
    • 7.6 Market opportunity by Type
      • Market opportunity by Type ($ million)
      • Data Table on Market opportunity by Type ($ million)

    8 Customer Landscape

    • 8.1 Customer landscape overview
      • Analysis of price sensitivity, lifecycle, customer purchase basket, adoption rates, and purchase criteria

    9 Geographic Landscape

    • 9.1 Geographic segmentation
      • Chart on Market share by geography 2023-2028 (%)
      • Data Table on Market share by geography 2023-2028 (%)
    • 9.2 Geographic comparison
      • Chart on Geographic comparison
      • Data Table on Geographic comparison
    • 9.3 APAC - Market size and forecast 2023-2028
      • Chart on APAC - Market size and forecast 2023-2028 ($ million)
      • Data Table on APAC - Market size and forecast 2023-2028 ($ million)
      • Chart on APAC - Year-over-year growth 2023-2028 (%)
      • Data Table on APAC - Year-over-year growth 2023-2028 (%)
    • 9.4 North America - Market size and forecast 2023-2028
      • Chart on North America - Market size and forecast 2023-2028 ($ million)
      • Data Table on North America - Market size and forecast 2023-2028 ($ million)
      • Chart on North America - Year-over-year growth 2023-2028 (%)
      • Data Table on North America - Year-over-year growth 2023-2028 (%)
    • 9.5 Europe - Market size and forecast 2023-2028
      • Chart on Europe - Market size and forecast 2023-2028 ($ million)
      • Data Table on Europe - Market size and forecast 2023-2028 ($ million)
      • Chart on Europe - Year-over-year growth 2023-2028 (%)
      • Data Table on Europe - Year-over-year growth 2023-2028 (%)
    • 9.6 South America - Market size and forecast 2023-2028
      • Chart on South America - Market size and forecast 2023-2028 ($ million)
      • Data Table on South America - Market size and forecast 2023-2028 ($ million)
      • Chart on South America - Year-over-year growth 2023-2028 (%)
      • Data Table on South America - Year-over-year growth 2023-2028 (%)
    • 9.7 Middle East and Africa - Market size and forecast 2023-2028
      • Chart on Middle East and Africa - Market size and forecast 2023-2028 ($ million)
      • Data Table on Middle East and Africa - Market size and forecast 2023-2028 ($ million)
      • Chart on Middle East and Africa - Year-over-year growth 2023-2028 (%)
      • Data Table on Middle East and Africa - Year-over-year growth 2023-2028 (%)
    • 9.8 China - Market size and forecast 2023-2028
      • Chart on China - Market size and forecast 2023-2028 ($ million)
      • Data Table on China - Market size and forecast 2023-2028 ($ million)
      • Chart on China - Year-over-year growth 2023-2028 (%)
      • Data Table on China - Year-over-year growth 2023-2028 (%)
    • 9.9 Taiwan - Market size and forecast 2023-2028
      • Chart on Taiwan - Market size and forecast 2023-2028 ($ million)
      • Data Table on Taiwan - Market size and forecast 2023-2028 ($ million)
      • Chart on Taiwan - Year-over-year growth 2023-2028 (%)
      • Data Table on Taiwan - Year-over-year growth 2023-2028 (%)
    • 9.10 US - Market size and forecast 2023-2028
      • Chart on US - Market size and forecast 2023-2028 ($ million)
      • Data Table on US - Market size and forecast 2023-2028 ($ million)
      • Chart on US - Year-over-year growth 2023-2028 (%)
      • Data Table on US - Year-over-year growth 2023-2028 (%)
    • 9.11 South Korea - Market size and forecast 2023-2028
      • Chart on South Korea - Market size and forecast 2023-2028 ($ million)
      • Data Table on South Korea - Market size and forecast 2023-2028 ($ million)
      • Chart on South Korea - Year-over-year growth 2023-2028 (%)
      • Data Table on South Korea - Year-over-year growth 2023-2028 (%)
    • 9.12 Japan - Market size and forecast 2023-2028
      • Chart on Japan - Market size and forecast 2023-2028 ($ million)
      • Data Table on Japan - Market size and forecast 2023-2028 ($ million)
      • Chart on Japan - Year-over-year growth 2023-2028 (%)
      • Data Table on Japan - Year-over-year growth 2023-2028 (%)
    • 9.13 Market opportunity by geography
      • Market opportunity by geography ($ million)
      • Data Tables on Market opportunity by geography ($ million)

    10 Drivers, Challenges, and Opportunity/Restraints

    • 10.1 Market drivers
      • 10.2 Market challenges
        • 10.3 Impact of drivers and challenges
          • Impact of drivers and challenges in 2023 and 2028
        • 10.4 Market opportunities/restraints

          11 Competitive Landscape

          • 11.1 Overview
            • 11.2 Competitive Landscape
              • Overview on criticality of inputs and factors of differentiation
            • 11.3 Landscape disruption
              • Overview on factors of disruption
            • 11.4 Industry risks
              • Impact of key risks on business

            12 Competitive Analysis

            • 12.1 Companies profiled
              • Companies covered
            • 12.2 Market positioning of companies
              • Matrix on companies position and classification
            • 12.3 Advanced Energy Minerals
              • Advanced Energy Minerals - Overview
              • Advanced Energy Minerals - Product / Service
              • Advanced Energy Minerals - Key offerings
            • 12.4 Alcoa Corp.
              • Alcoa Corp. - Overview
              • Alcoa Corp. - Business segments
              • Alcoa Corp. - Key offerings
              • Alcoa Corp. - Segment focus
            • 12.5 Alpha HPA Ltd.
              • Alpha HPA Ltd. - Overview
              • Alpha HPA Ltd. - Business segments
              • Alpha HPA Ltd. - Key offerings
              • Alpha HPA Ltd. - Segment focus
            • 12.6 Altech Chemicals Ltd.
              • Altech Chemicals Ltd. - Overview
              • Altech Chemicals Ltd. - Product / Service
              • Altech Chemicals Ltd. - Key offerings
            • 12.7 Baikowski SA
              • Baikowski SA - Overview
              • Baikowski SA - Product / Service
              • Baikowski SA - Key offerings
            • 12.8 CoorsTek Inc.
              • CoorsTek Inc. - Overview
              • CoorsTek Inc. - Product / Service
              • CoorsTek Inc. - Key news
              • CoorsTek Inc. - Key offerings
            • 12.9 Devtaar GmbH
              • Devtaar GmbH - Overview
              • Devtaar GmbH - Product / Service
              • Devtaar GmbH - Key offerings
            • 12.10 FYI Resources Ltd.
              • FYI Resources Ltd. - Overview
              • FYI Resources Ltd. - Product / Service
              • FYI Resources Ltd. - Key offerings
            • 12.11 HPA Sonics
              • HPA Sonics - Overview
              • HPA Sonics - Product / Service
              • HPA Sonics - Key offerings
            • 12.12 Nippon Light Metal Co. Ltd.
              • Nippon Light Metal Co. Ltd. - Overview
              • Nippon Light Metal Co. Ltd. - Business segments
              • Nippon Light Metal Co. Ltd. - Key offerings
              • Nippon Light Metal Co. Ltd. - Segment focus
            • 12.13 Norsk Hydro ASA
              • Norsk Hydro ASA - Overview
              • Norsk Hydro ASA - Business segments
              • Norsk Hydro ASA - Key offerings
              • Norsk Hydro ASA - Segment focus
            • 12.14 Oyak
              • Oyak - Overview
              • Oyak - Product / Service
              • Oyak - Key offerings
            • 12.15 Polar Sapphire Ltd.
              • Polar Sapphire Ltd. - Overview
              • Polar Sapphire Ltd. - Product / Service
              • Polar Sapphire Ltd. - Key offerings
            • 12.16 Sasol Ltd.
              • Sasol Ltd. - Overview
              • Sasol Ltd. - Business segments
              • Sasol Ltd. - Key news
              • Sasol Ltd. - Key offerings
              • Sasol Ltd. - Segment focus
            • 12.17 Vizag Chemical International
              • Vizag Chemical International - Overview
              • Vizag Chemical International - Product / Service
              • Vizag Chemical International - Key offerings

            13 Appendix

            • 13.1 Scope of the report
              • 13.2 Inclusions and exclusions checklist
                • Inclusions checklist
                • Exclusions checklist
              • 13.3 Currency conversion rates for US$
                • Currency conversion rates for US$
              • 13.4 Research methodology
                • Research methodology
              • 13.5 Data procurement
                • Information sources
              • 13.6 Data validation
                • Data validation
              • 13.7 Validation techniques employed for market sizing
                • Validation techniques employed for market sizing
              • 13.8 Data synthesis
                • Data synthesis
              • 13.9 360 degree market analysis
                • 360 degree market analysis
              • 13.10 List of abbreviations
                • List of abbreviations

              Research Methodology

              Technavio presents a detailed picture of the market by way of study, synthesis, and summation of data from multiple sources. The analysts have presented the various facets of the market with a particular focus on identifying the key industry influencers. The data thus presented is comprehensive, reliable, and the result of extensive research, both primary and secondary.

              INFORMATION SOURCES

              Primary sources

              • Manufacturers and suppliers
              • Channel partners
              • Industry experts
              • Strategic decision makers

              Secondary sources

              • Industry journals and periodicals
              • Government data
              • Financial reports of key industry players
              • Historical data
              • Press releases

              DATA ANALYSIS

              Data Synthesis

              • Collation of data
              • Estimation of key figures
              • Analysis of derived insights

              Data Validation

              • Triangulation with data models
              • Reference against proprietary databases
              • Corroboration with industry experts

              REPORT WRITING

              Qualitative

              • Market drivers
              • Market challenges
              • Market trends
              • Five forces analysis

              Quantitative

              • Market size and forecast
              • Market segmentation
              • Geographical insights
              • Competitive landscape

              Interested in this report?

              Get your sample now to see our research methodology and insights!

              Download Now

              Frequently Asked Questions

              High Purity Alumina market growth will increase by $ 6827.8 mn during 2024-2028.

              The High Purity Alumina market is expected to grow at a CAGR of 33.95% during 2024-2028.

              High Purity Alumina market is segmented by Application( LEDs, Semiconductors, Phosphors, Others) Type( 4N HPA, 5N HPA, 6N HPA, South America)

              Advanced Energy Minerals, Alcoa Corp., Alpha HPA Ltd., Altech Advanced Materials AG, Altech Chemicals Ltd., AluChem Inc., Baikowski SA, CoorsTek Inc., Devtaar GmbH, FYI Resources Ltd., HPA Sonics, Nippon Light Metal Co. Ltd., Norsk Hydro ASA, Orient Abrasives Ltd., Oyak, Polar Sapphire Ltd., Sasol Ltd., Sumitomo Chemical Co. Ltd., United Company RUSAL, Vizag Chemical International are a few of the key vendors in the High Purity Alumina market.

              APAC will register the highest growth rate of 69% among the other regions. Therefore, the High Purity Alumina market in APAC is expected to garner significant business opportunities for the vendors during the forecast period.

              China, Taiwan, US, South Korea, Japan

              • Rising adoption of LED lightingThe LED lighting market is experiencing continued demand due to the high adoption of smart lighting systems across different industries and growing concern over the depletion of non-renewable sources of power. High consumption of LED lights in the residential segment and high use of street lights in the general lighting application are the factors driving the demand for LED lighting. In addition is the driving factor this market.
              • the need to reduce electricity consumption and growing awareness of green technology has made manufacturers focus on energy-efficient and eco-friendly lights such as LED lighting.LED lights used in general lighting applications will be in high demand during the forecast period is the driving factor this market.
              • primarily because of favorable incentives provided by governments. In addition is the driving factor this market.
              • the promotion of LED lighting systems by governments of many countries has encouraged the use of energy-efficient light sources. Various governments are also taking up multiple projects and providing subsidies to promote LED lights. Countries such as China is the driving factor this market.
              • India is the driving factor this market.
              • and Japan have started promotional campaigns to make LEDs available at subsidized rates and provide land at low prices to companies to set up LED factories. Infrastructure development across the world and the emergence of smart cities will drive the demand for LED lighting. In the US is the driving factor this market.
              • domestic users can enjoy federal tax credits is the driving factor this market.
              • known as residential energy-efficiency tax credits is the driving factor this market.
              • for improving the energy efficiency of their homes.Huge investments in infrastructure development in emerging countries are also expected to drive the demand for LED lighting over the forecast period. The applications of LED lights for residential purposes include lighting in bathrooms is the driving factor this market.
              • dining rooms is the driving factor this market.
              • hallways is the driving factor this market.
              • and kitchens. LED lights are the best replacement options for fluorescent lights. They are available in different styles and help in reducing energy usage. LEDs have many advantages over traditional light sources in industrial applications due to their explosion-proof light design is the driving factor this market.
              • which makes them compact is the driving factor this market.
              • lightweight is the driving factor this market.
              • and low cost and makes them last longer. The oil and gas and petrochemical industries are most likely to opt for LED lighting systems because explosion-proof LEDs are not only of high quality and ensure greater safety but are also cost-effective. The demand for explosion-proof LED lighting systems is expected to rise in the future is the driving factor this market.
              • as mercury-vapor lighting systems are being banned by governments worldwide.The growing availability of various types of LED lights is the driving factor this market.
              • such as high-intensity discharge bulbs is the driving factor this market.
              • metal halide bulbs is the driving factor this market.
              • high-intensity fluorescent bulbs is the driving factor this market.
              • and high-pressure sodium bulbs is the driving factor this market.
              • is a major growth driver for the global LED lighting market. LED lights are long-lasting and is the driving factor this market.
              • thus is the driving factor this market.
              • have a relatively lower cost of ownership as compared with traditional lighting systems. The growing global LED lighting market is expected to drive the global market for HPA during the forecast period. A sapphire-based substrate is majorly used in LED lights is the driving factor this market.
              • and HPA is the starting material used to produce sapphire. Thus is the driving factor this market.
              • the growing demand for LED lighting will increase the demand for the sapphire-based substrate is the driving factor this market.
              • which is the driving factor this market.
              • in turn is the driving factor this market.
              • is expected to drive the global high purity alumina market during the forecast period. is the driving factor this market.

              The High Purity Alumina market vendors should focus on grabbing business opportunities from the LEDs segment as it accounted for the largest market share in the base year.