Green Petroleum Coke And Calcined Petroleum Coke Market Analysis, Size, and Forecast 2025-2029: North America (US and Canada), Europe (France, Germany, Italy, and UK), APAC (China, India, Japan, and South Korea), and Rest of World (ROW)

Green Petroleum Coke And Calcined Petroleum Coke Market Analysis, Size, and Forecast 2025-2029:
North America (US and Canada), Europe (France, Germany, Italy, and UK), APAC (China, India, Japan, and South Korea), and Rest of World (ROW)

Published: Jul 2025 208 Pages SKU: IRTNTR75051

Market Overview at a Glance

$12.94 B
Market Opportunity
7.1%
CAGR
6.5
YoY growth 2024-2025(%)

Green Petroleum Coke And Calcined Petroleum Coke Market Size 2025-2029

The green petroleum coke and calcined petroleum coke market size is forecast to increase by USD 12.94 billion at a CAGR of 7.1% between 2024 and 2029.

  • The market is driven by the surging demand for aluminum and steel, with these industries being significant consumers of petroleum coke. The advances in the oil and gas industry, particularly in the extraction and refining processes, contribute to the market's growth. However, the market faces challenges due to the volatility of crude oil prices, which can significantly impact the production costs and profitability of petroleum coke manufacturers. Navigating these price fluctuations requires strategic planning and adaptability. Companies in this market must closely monitor crude oil prices and explore alternative feedstocks or production methods to mitigate risks and maintain competitiveness.
  • Additionally, focusing on improving the efficiency of production processes and exploring new applications for petroleum coke can provide opportunities for market growth. Overall, the market presents both challenges and opportunities for players, with the potential for significant growth in industries that rely on these products. The calcination process, whether it be rotary kiln calcination or otherwise, significantly impacts the petroleum coke quality, including its fixed carbon, surface area, and thermal conductivity. Companies that can effectively manage production costs, improve efficiency, and explore new applications will be well-positioned to capitalize on market trends and navigate challenges.

What will be the Size of the Green Petroleum Coke And Calcined Petroleum Coke Market during the forecast period?

Green Petroleum Coke And Calcined Petroleum Coke Market Size

 Explore in-depth regional segment analysis with market size data - historical 2019-2023 and forecasts 2025-2029 - in the full report.  
Request Free Sample

The global petroleum coke market encompasses two primary forms: green and calcined. Green petroleum coke, also known as uncalcined petroleum coke, is a byproduct of refinery processes. Calcined petroleum coke, on the other hand, undergoes additional thermal treatment to enhance its properties. Quality assurance and process optimization are crucial in the petroleum coke market, ensuring consistent product quality and efficient production. Global competition intensifies as players seek to gain market penetration through innovation strategies and sustainability practices. Investment opportunities abound in the petroleum coke industry, driven by the future outlook's technical potential and the circular economy's growing importance. While the environmental regulations aim to minimize the carbon footprint, the economic factors, such as the availability and cost of alternative fuels impact the demand for petroleum coke.

Technological development, such as bulk shipping and waste reduction, plays a significant role in cost reduction and price volatility mitigation. Demand forecasting for end-user industries, including energy, steel, and chemicals, influences market analysis and application development. Economic outlooks and production technology advancements also impact the competitive landscape and consumer behavior. Environmental impact, supply chain resilience, and regulatory compliance are essential considerations for petroleum coke market participants. Technological innovation, including energy efficiency, carbon capture, and trade relations, shapes the industry's future. Raw material sourcing and cost reduction remain critical factors, with price volatility influencing market dynamics.

Understanding the competitive landscape, including regulatory frameworks and consumer preferences, is vital for success.

How is this Green Petroleum Coke And Calcined Petroleum Coke Industry segmented?

The green petroleum coke and calcined petroleum coke industry research report provides comprehensive data (region-wise segment analysis), with forecasts and estimates in "USD million" for the period 2025-2029, as well as historical data from 2019-2023 for the following segments.

  • Application
    • Green petroleum coke
    • Calcined petroleum coke
  • Type
    • Fuel grade
    • Calcined coke
  • End-user
    • Aluminum industry
    • Steel industry
    • Cement industry
    • Others
  • Geography
    • North America
      • US
      • Canada
    • Europe
      • France
      • Germany
      • Italy
      • UK
    • APAC
      • China
      • India
      • Japan
      • South Korea
    • Rest of World (ROW)

By Application Insights

The Green petroleum coke segment is estimated to witness significant growth during the forecast period. Green petroleum coke, a carbonaceous solid residue derived from petroleum fractions, is a vital component in various industries. With a high ignition point and non-explosive properties, it is water-insoluble and non-reactive. The primary application of green petroleum coke is in the aluminum industry, where it is used to manufacture carbon anodes for smelting. This material also finds usage in the steel industry as a replacement for metallurgical coal. In addition, green petroleum coke serves as a raw material in the production of graphite and carbon products. Fluidized bed calcination is a common process used to upgrade green petroleum coke to calcined petroleum coke.

This upgraded product is employed in numerous applications, including fuel for cement kilns and steel production. The calcination process enhances the fixed carbon content, surface area, and thermal conductivity of the coke. Government policies and safety regulations play a crucial role in the green petroleum coke market. Waste management and emission control are essential considerations for producers, as they strive to minimize environmental impact. Byproduct recovery and carbon footprint reduction are also key priorities. The supply chain for green petroleum coke involves transportation costs, import/export, and quality control. Trade tariffs and economic factors influence market dynamics, while industry standards and particle size distribution impact production capacity and inventory management.

In the aluminum smelting process, green petroleum coke's mechanical strength and electrical conductivity are essential. In the steel industry, the sulfur content and ash content of calcined petroleum coke are crucial factors. Risk management and coke blending are essential strategies for managing supply and demand. The global trade of green petroleum coke is subject to various economic and environmental regulations. As the demand for sustainable and efficient energy sources grows, the market for green petroleum coke is expected to evolve, with potential applications in fuel and refractory materials.

Green Petroleum Coke And Calcined Petroleum Coke Market Size

 Download Free Sample Report

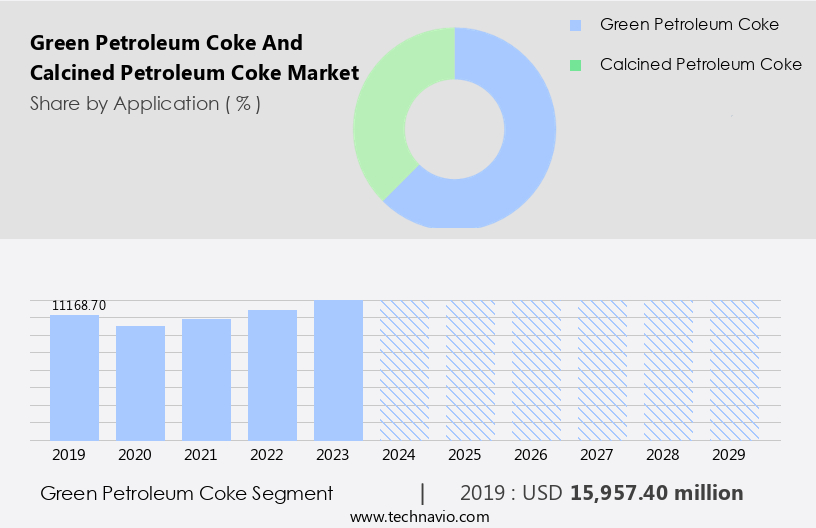
The Green petroleum coke segment was valued at USD 15.96 billion in 2019 and showed a gradual increase during the forecast period.

The Green Petroleum Coke and Calcined Petroleum Coke Market is shaped by evolving energy demands, industrial processing, and sustainability goals. Efficient coke handling is critical to maintaining production flow and environmental safety. In-depth market analysis (technical) and competitive landscape (technical) assessments reveal expanding applications in metals, cement, and chemicals. The economic outlook remains resilient due to rising steel and aluminum demand, though price volatility poses short-term challenges. The future outlook (technical) suggests innovation in purification processes and quality control. A key driver is alignment with the circular economy, as industries seek to reuse by-products, reduce emissions, and increase energy efficiency throughout the coke lifecycle.  The petroleum coke market is driven by the petroleum refining industry's ongoing transformation, fueled by technological advancements in automation, machine learning, and artificial intelligence.

Regional Analysis

APAC is estimated to contribute 51% to the growth of the global market during the forecast period.Technavio's analysts have elaborately explained the regional trends and drivers that shape the market during the forecast period.

Green Petroleum Coke And Calcined Petroleum Coke Market Share by Geography

View Free PDF Sample

The market in APAC is driven by several key factors. China and India are the major contributors to this market, with China leading the way. The calcined petroleum coke produced in China is primarily used in the aluminum industry, given China's position as one of the world's leading aluminum producers. Fluidized bed calcination is a common process used in the production of green petroleum coke and calcined petroleum coke, ensuring high mechanical strength and emission control. Government policies and safety regulations play a crucial role in the market's growth. For instance, the aluminum industry's focus on reducing carbon footprint has led to increased demand for calcined petroleum coke as a substitute for coal in the smelting process.

Occupational health concerns have also led to the adoption of green petroleum coke due to its lower sulfur content and improved combustion properties. The supply chain is an essential aspect of the market, with import/export and transportation costs influencing the market dynamics. The presence of major calcined petroleum coke companies such as Atha, Hebei Kangnaixing Carbon New Material, China National Offshore Oil, and China National Petroleum in the region ensures a steady supply of the product. Quality control is another critical factor, with industry standards and testing methods ensuring the consistency and reliability of the product.

These properties determine the product's suitability for various applications, including carbon black production, graphite production, cement industry, and fuel applications. Economic factors, such as production capacity and inventory management, also impact the market. For example, the cost of heat treatment and volatile matter content can significantly affect the profitability of the calcined petroleum coke production. Additionally, trade tariffs and environmental regulations can influence the market dynamics, with some countries implementing stricter regulations to reduce their carbon footprint. The market in APAC is expected to grow significantly during the forecast period, driven by the presence of major companies, increasing demand from the aluminum industry, and government policies and regulations.

The market's dynamics are influenced by various factors, including the calcination process, quality control, economic factors, and supply chain considerations.

Market Dynamics

Our researchers analyzed the data with 2024 as the base year, along with the key drivers, trends, and challenges. A holistic analysis of drivers will help companies refine their marketing strategies to gain a competitive advantage.

What are the Green Petroleum Coke And Calcined Petroleum Coke market drivers leading to the rise in the adoption of Industry?

  • The market is primarily driven by the rising demand for aluminum and steel, making it essential for businesses in this sector to stay informed about the latest trends and supply dynamics. Green petroleum coke and calcined petroleum coke are essential raw materials in various industries, including aluminum and steel production. In the aluminum industry, these coke types are utilized to manufacture aluminum smelting electrodes, which are integral to aluminum production. In the steel sector, they are used to produce synthetic graphite electrodes, indispensable for steel manufacturing. The steel industry holds significant importance due to its role in economic growth, with major crude steel producers being countries like China, Japan, and India in the Asia Pacific region. Rapid infrastructural development and high economic growth in China are key drivers for the steel industry's expansion.
  • Green petroleum coke and calcined petroleum coke possess desirable properties such as mechanical strength and high fixed carbon content, making them suitable for these applications. Their surface area and transportation costs also impact their usage in different industries. In the global trade of these coke types, factors like emission control, quality control, import/export regulations, and trade tariffs play significant roles. The calcined petroleum coke is also used in graphite production, which is a crucial component in various industries, including the cement industry. Ensuring a robust supply chain and maintaining consistent quality are essential for businesses dealing with these coke types.

What are the Green Petroleum Coke And Calcined Petroleum Coke market trends shaping the Industry?

  • The oil and gas industry is currently experiencing significant advances, representing a notable market trend. These progressions encompass technological innovations and operational efficiencies that are shaping the future of energy production. These innovations have led to the adoption of self-driving ore trucks and robotic drills, enhancing safety, production efficiency, and capacity in the oil and gas sector. This trend is expected to boost global oil production, the primary feedstock for producing green petroleum coke and calcined petroleum coke. Green petroleum coke and calcined petroleum coke are essential by-products of the petroleum refining process. Green petroleum coke, also known as uncalcined petroleum coke, has a higher volatile matter and lower carbon content compared to calcined petroleum coke.
  • Calcined petroleum coke undergoes heat treatment through the calcination process using a rotary kiln, resulting in a significant reduction in volatile matter and an increase in carbon content. Both green and calcined petroleum coke find extensive applications as fuels due to their high thermal conductivity, electrical conductivity, and low ash content. The environmental regulations and economic factors influence the market dynamics of petroleum coke. Additionally, refractory materials, which are essential in various industries, are derived from petroleum coke, further expanding its market potential.

How does Green Petroleum Coke and Calcined Petroleum Coke market faces challenges during its growth?

  • The volatility in crude oil prices poses a significant challenge to the growth of the industry. Petroleum coke, a solid carbon byproduct of crude oil refining, plays a significant role in various industries, including steel production. Metallurgical coke and calcined petroleum coke are two primary types of petroleum coke. Metallurgical coke is used in the blast furnace process to produce iron and steel, while calcined petroleum coke is employed as a fuel and a reducing agent in the steel industry. The particle size distribution of petroleum coke is essential, as it impacts the coke's performance in steel production. Industry standards dictate specific particle size distributions for optimal coke utilization. Sulfur content is another critical factor, as high sulfur content can negatively affect steel quality.
  • Risk management and inventory management are crucial for refineries and steel mills dealing with petroleum coke. Coke blending is a common practice to adjust the sulfur content and particle size distribution to meet industry standards. Proper storage facilities and testing methods are necessary to maintain the quality of petroleum coke. Production capacity and inventory management are essential for refineries to meet the demand for petroleum coke. Fluctuations in crude oil prices significantly impact the production of petroleum coke and the profitability of upstream oil and gas companies and oil refineries. Effective risk management and inventory management strategies are necessary to mitigate the impact of crude oil price volatility on petroleum coke production and utilization.

Exclusive Customer Landscape

The green petroleum coke and calcined petroleum coke market forecasting report includes the adoption lifecycle of the market, covering from the innovator's stage to the laggard's stage. It focuses on adoption rates in different regions based on penetration. Furthermore, the green petroleum coke and calcined petroleum coke market report also includes key purchase criteria and drivers of price sensitivity to help companies evaluate and develop their market growth analysis strategies.

Green Petroleum Coke And Calcined Petroleum Coke Market Share by Geography

 Customer Landscape

Key Companies & Market Insights

Companies are implementing various strategies, such as strategic alliances, green petroleum coke and calcined petroleum coke market forecast, partnerships, mergers and acquisitions, geographical expansion, and product/service launches, to enhance their presence in the industry.

Aluminium Bahrain BSC - This company specializes in the production of Green Petroleum Coke And Calcined Petroleum Coke calcination technology and seawater desalination solutions, providing innovative and sustainable offerings in the energy and water sectors.

The industry research and growth report includes detailed analyses of the competitive landscape of the market and information about key companies, including:

  • Aluminium Bahrain BSC
  • Asbury Carbons Inc.
  • Atha Group
  • BP Plc
  • Chevron Corp.
  • China National Offshore Oil Corp.
  • China National Petroleum Corp.
  • China Shenhua Energy Co. Ltd.
  • ConocoPhillips
  • Exxon Mobil Corp.
  • Gautam ZEN UK LTD.
  • Hebei Kangnaixing Carbon New Material Co. Ltd.
  • Minmat Ferro Alloys Pvt. Ltd.
  • National Iranian Oil Products Refining and Distribution Co.
  • Oxbow Corp.
  • Rain Industries Ltd.
  • RIZHAO HENGQIAO CARBON CO. LTD.
  • Shell plc
  • TotalEnergies SE
  • Valero Energy Corp.

Qualitative and quantitative analysis of companies has been conducted to help clients understand the wider business environment as well as the strengths and weaknesses of key industry players. Data is qualitatively analyzed to categorize companies as pure play, category-focused, industry-focused, and diversified; it is quantitatively analyzed to categorize companies as dominant, leading, strong, tentative, and weak.

Recent Development and News in Green Petroleum Coke And Calcined Petroleum Coke Market

  • In January 2024, Shell Chemicals, a leading global chemical company, announced the successful commissioning of its new Green Petroleum Coke (GPC) plant in Deer Park, Texas. This plant, which utilizes Shell's proprietary Eco-Cracking process, reduces greenhouse gas emissions by up to 25% compared to traditional petroleum coke production methods (Shell press release, 2024).
  • In March 2024, SABIC, a leading petrochemicals manufacturer, and INEOS Styrolution, the world's largest styrenics supplier, formed a strategic partnership to develop a calcined petroleum coke (CPC) production facility in Saudi Arabia. This collaboration aims to strengthen both companies' positions in the global CPC market (INEOS Styrolution press release, 2024).
  • In May 2024, Neste Corporation, a Finnish renewable energy company, announced the successful completion of its acquisition of Lioec, a leading European producer of green petroleum coke. This acquisition enhances Neste's position in the European market and provides access to Lioec's advanced technology for producing high-quality green petroleum coke (Neste press release, 2024).
  • In April 2025, the European Union passed the Fit for 55 package, which includes the Revised Emissions Trading System (ETS) regulation. This policy change increases the carbon price and incentivizes the production of low-carbon petroleum coke, such as green petroleum coke, to reduce the carbon footprint of the European petrochemicals industry (European Commission press release, 2025).

Research Analyst Overview

The market continues to evolve, driven by the dynamic interplay of various factors. Petroleum coke's carbon content, heat treatment, volatile matter, thermal conductivity, and fuel applications find applications across diverse sectors, including aluminum smelting, cement production, and steel manufacturing. The calcination process, a critical step in producing calcined petroleum coke, involves heat treatment to enhance its mechanical strength, electrical conductivity, and reduce its ash content. Environmental regulations and economic factors shape the market's landscape, with emission control and byproduct recovery becoming increasingly important. The calcination process's impact on carbon footprint and occupational health is under scrutiny, leading to stricter safety regulations.

The supply chain's efficiency and risk management are essential considerations, with factors like transportation costs, import/export regulations, and production capacity influencing market dynamics. Industry standards and testing methods ensure petroleum coke's quality, with particle size distribution, sulfur content, and fixed carbon playing significant roles. The ongoing evolution of the market sees continued innovation in technologies like fluidized bed calcination and rotary kiln calcination, as well as the emergence of new applications in sectors like graphite production and carbon anodes. The market's complexity necessitates a nuanced understanding of the interplay between various factors, from refractory materials to industry trends and economic indicators.

As the market continues to unfold, stakeholders must stay informed and adapt to the ever-changing landscape.

Dive into Technavio's robust research methodology, blending expert interviews, extensive data synthesis, and validated models for unparalleled Green Petroleum Coke And Calcined Petroleum Coke Market insights. See full methodology.

Market Scope

Report Coverage

Details

Page number

208

Base year

2024

Historic period

2019-2023

Forecast period

2025-2029

Growth momentum & CAGR

Accelerate at a CAGR of 7.1%

Market growth 2025-2029

USD 12.94 billion

Market structure

Fragmented

YoY growth 2024-2025(%)

6.5

Key countries

China, US, India, Germany, UK, Japan, Canada, France, South Korea, and Italy

Competitive landscape

Leading Companies, Market Positioning of Companies, Competitive Strategies, and Industry Risks

Request Free Sample

What are the Key Data Covered in this Green Petroleum Coke And Calcined Petroleum Coke Market Research and Growth Report?

  • CAGR of the Green Petroleum Coke And Calcined Petroleum Coke industry during the forecast period
  • Detailed information on factors that will drive the growth and forecasting between 2025 and 2029
  • Precise estimation of the size of the market and its contribution of the industry in focus to the parent market
  • Accurate predictions about upcoming growth and trends and changes in consumer behaviour
  • Growth of the market across APAC, North America, Europe, Middle East and Africa, and South America
  • Thorough analysis of the market's competitive landscape and detailed information about companies
  • Comprehensive analysis of factors that will challenge the green petroleum coke and calcined petroleum coke market growth of industry companies

We can help! Our analysts can customize this green petroleum coke and calcined petroleum coke market research report to meet your requirements.

Get in touch

1 Executive Summary

  • 1.1 Market overview
    • Executive Summary - Chart on Market Overview
    • Executive Summary - Data Table on Market Overview
    • Executive Summary - Chart on Global Market Characteristics
    • Executive Summary - Chart on Market by Geography
    • Executive Summary - Chart on Market Segmentation by Application
    • Executive Summary - Chart on Market Segmentation by Type
    • Executive Summary - Chart on Market Segmentation by End-user
    • Executive Summary - Chart on Incremental Growth
    • Executive Summary - Data Table on Incremental Growth
    • Executive Summary - Chart on Company Market Positioning

2 Technavio Analysis

  • 2.1 Analysis of price sensitivity, lifecycle, customer purchase basket, adoption rates, and purchase criteria
    • Analysis of price sensitivity, lifecycle, customer purchase basket, adoption rates, and purchase criteria
  • 2.2 Criticality of inputs and Factors of differentiation
    • Overview on criticality of inputs and factors of differentiation
  • 2.3 Factors of disruption
    • Overview on factors of disruption
  • 2.4 Impact of drivers and challenges
    • Impact of drivers and challenges in 2024 and 2029

3 Market Landscape

  • 3.1 Market ecosystem
    • Parent Market
    • Data Table on - Parent Market
  • 3.2 Market characteristics
    • Market characteristics analysis
  • 3.3 Value chain analysis
    • Value chain analysis

4 Market Sizing

  • 4.1 Market definition
    • Offerings of companies included in the market definition
  • 4.2 Market segment analysis
    • Market segments
  • 4.3 Market size 2024
    • 4.4 Market outlook: Forecast for 2024-2029
      • Chart on Global - Market size and forecast 2024-2029 ($ million)
      • Data Table on Global - Market size and forecast 2024-2029 ($ million)
      • Chart on Global Market: Year-over-year growth 2024-2029 (%)
      • Data Table on Global Market: Year-over-year growth 2024-2029 (%)

    5 Historic Market Size

    • 5.1 Global Green Petroleum Coke And Calcined Petroleum Coke Market 2019 - 2023
      • Historic Market Size - Data Table on Global Green Petroleum Coke And Calcined Petroleum Coke Market 2019 - 2023 ($ million)
    • 5.2 Application segment analysis 2019 - 2023
      • Historic Market Size - Application Segment 2019 - 2023 ($ million)
    • 5.3 Type segment analysis 2019 - 2023
      • Historic Market Size - Type Segment 2019 - 2023 ($ million)
    • 5.4 End-user segment analysis 2019 - 2023
      • Historic Market Size - End-user Segment 2019 - 2023 ($ million)
    • 5.5 Geography segment analysis 2019 - 2023
      • Historic Market Size - Geography Segment 2019 - 2023 ($ million)
    • 5.6 Country segment analysis 2019 - 2023
      • Historic Market Size - Country Segment 2019 - 2023 ($ million)

    6 Qualitative Analysis

    • 6.1 Impact of AI on Global Green Petroleum Coke and Calcined Petroleum Coke Market

      7 Five Forces Analysis

      • 7.1 Five forces summary
        • Five forces analysis - Comparison between 2024 and 2029
      • 7.2 Bargaining power of buyers
        • Bargaining power of buyers - Impact of key factors 2024 and 2029
      • 7.3 Bargaining power of suppliers
        • Bargaining power of suppliers - Impact of key factors in 2024 and 2029
      • 7.4 Threat of new entrants
        • Threat of new entrants - Impact of key factors in 2024 and 2029
      • 7.5 Threat of substitutes
        • Threat of substitutes - Impact of key factors in 2024 and 2029
      • 7.6 Threat of rivalry
        • Threat of rivalry - Impact of key factors in 2024 and 2029
      • 7.7 Market condition
        • Chart on Market condition - Five forces 2024 and 2029

      8 Market Segmentation by Application

      • 8.1 Market segments
        • Chart on Application - Market share 2024-2029 (%)
        • Data Table on Application - Market share 2024-2029 (%)
      • 8.2 Comparison by Application
        • Chart on Comparison by Application
        • Data Table on Comparison by Application
      • 8.3 Green petroleum coke - Market size and forecast 2024-2029
        • Chart on Green petroleum coke - Market size and forecast 2024-2029 ($ million)
        • Data Table on Green petroleum coke - Market size and forecast 2024-2029 ($ million)
        • Chart on Green petroleum coke - Year-over-year growth 2024-2029 (%)
        • Data Table on Green petroleum coke - Year-over-year growth 2024-2029 (%)
      • 8.4 Calcined petroleum coke - Market size and forecast 2024-2029
        • Chart on Calcined petroleum coke - Market size and forecast 2024-2029 ($ million)
        • Data Table on Calcined petroleum coke - Market size and forecast 2024-2029 ($ million)
        • Chart on Calcined petroleum coke - Year-over-year growth 2024-2029 (%)
        • Data Table on Calcined petroleum coke - Year-over-year growth 2024-2029 (%)
      • 8.5 Market opportunity by Application
        • Market opportunity by Application ($ million)
        • Data Table on Market opportunity by Application ($ million)

      9 Market Segmentation by Type

      • 9.1 Market segments
        • Chart on Type - Market share 2024-2029 (%)
        • Data Table on Type - Market share 2024-2029 (%)
      • 9.2 Comparison by Type
        • Chart on Comparison by Type
        • Data Table on Comparison by Type
      • 9.3 Fuel grade - Market size and forecast 2024-2029
        • Chart on Fuel grade - Market size and forecast 2024-2029 ($ million)
        • Data Table on Fuel grade - Market size and forecast 2024-2029 ($ million)
        • Chart on Fuel grade - Year-over-year growth 2024-2029 (%)
        • Data Table on Fuel grade - Year-over-year growth 2024-2029 (%)
      • 9.4 Calcined coke - Market size and forecast 2024-2029
        • Chart on Calcined coke - Market size and forecast 2024-2029 ($ million)
        • Data Table on Calcined coke - Market size and forecast 2024-2029 ($ million)
        • Chart on Calcined coke - Year-over-year growth 2024-2029 (%)
        • Data Table on Calcined coke - Year-over-year growth 2024-2029 (%)
      • 9.5 Market opportunity by Type
        • Market opportunity by Type ($ million)
        • Data Table on Market opportunity by Type ($ million)

      10 Market Segmentation by End-user

      • 10.1 Market segments
        • Chart on End-user - Market share 2024-2029 (%)
        • Data Table on End-user - Market share 2024-2029 (%)
      • 10.2 Comparison by End-user
        • Chart on Comparison by End-user
        • Data Table on Comparison by End-user
      • 10.3 Aluminum industry - Market size and forecast 2024-2029
        • Chart on Aluminum industry - Market size and forecast 2024-2029 ($ million)
        • Data Table on Aluminum industry - Market size and forecast 2024-2029 ($ million)
        • Chart on Aluminum industry - Year-over-year growth 2024-2029 (%)
        • Data Table on Aluminum industry - Year-over-year growth 2024-2029 (%)
      • 10.4 Steel industry - Market size and forecast 2024-2029
        • Chart on Steel industry - Market size and forecast 2024-2029 ($ million)
        • Data Table on Steel industry - Market size and forecast 2024-2029 ($ million)
        • Chart on Steel industry - Year-over-year growth 2024-2029 (%)
        • Data Table on Steel industry - Year-over-year growth 2024-2029 (%)
      • 10.5 Cement industry - Market size and forecast 2024-2029
        • Chart on Cement industry - Market size and forecast 2024-2029 ($ million)
        • Data Table on Cement industry - Market size and forecast 2024-2029 ($ million)
        • Chart on Cement industry - Year-over-year growth 2024-2029 (%)
        • Data Table on Cement industry - Year-over-year growth 2024-2029 (%)
      • 10.6 Others - Market size and forecast 2024-2029
        • Chart on Others - Market size and forecast 2024-2029 ($ million)
        • Data Table on Others - Market size and forecast 2024-2029 ($ million)
        • Chart on Others - Year-over-year growth 2024-2029 (%)
        • Data Table on Others - Year-over-year growth 2024-2029 (%)
      • 10.7 Market opportunity by End-user
        • Market opportunity by End-user ($ million)
        • Data Table on Market opportunity by End-user ($ million)

      11 Customer Landscape

      • 11.1 Customer landscape overview
        • Analysis of price sensitivity, lifecycle, customer purchase basket, adoption rates, and purchase criteria

      12 Geographic Landscape

      • 12.1 Geographic segmentation
        • Chart on Market share by geography 2024-2029 (%)
        • Data Table on Market share by geography 2024-2029 (%)
      • 12.2 Geographic comparison
        • Chart on Geographic comparison
        • Data Table on Geographic comparison
      • 12.3 APAC - Market size and forecast 2024-2029
        • Chart on APAC - Market size and forecast 2024-2029 ($ million)
        • Data Table on APAC - Market size and forecast 2024-2029 ($ million)
        • Chart on APAC - Year-over-year growth 2024-2029 (%)
        • Data Table on APAC - Year-over-year growth 2024-2029 (%)
      • 12.4 North America - Market size and forecast 2024-2029
        • Chart on North America - Market size and forecast 2024-2029 ($ million)
        • Data Table on North America - Market size and forecast 2024-2029 ($ million)
        • Chart on North America - Year-over-year growth 2024-2029 (%)
        • Data Table on North America - Year-over-year growth 2024-2029 (%)
      • 12.5 Europe - Market size and forecast 2024-2029
        • Chart on Europe - Market size and forecast 2024-2029 ($ million)
        • Data Table on Europe - Market size and forecast 2024-2029 ($ million)
        • Chart on Europe - Year-over-year growth 2024-2029 (%)
        • Data Table on Europe - Year-over-year growth 2024-2029 (%)
      • 12.6 Middle East and Africa - Market size and forecast 2024-2029
        • Chart on Middle East and Africa - Market size and forecast 2024-2029 ($ million)
        • Data Table on Middle East and Africa - Market size and forecast 2024-2029 ($ million)
        • Chart on Middle East and Africa - Year-over-year growth 2024-2029 (%)
        • Data Table on Middle East and Africa - Year-over-year growth 2024-2029 (%)
      • 12.7 South America - Market size and forecast 2024-2029
        • Chart on South America - Market size and forecast 2024-2029 ($ million)
        • Data Table on South America - Market size and forecast 2024-2029 ($ million)
        • Chart on South America - Year-over-year growth 2024-2029 (%)
        • Data Table on South America - Year-over-year growth 2024-2029 (%)
      • 12.8 China - Market size and forecast 2024-2029
        • Chart on China - Market size and forecast 2024-2029 ($ million)
        • Data Table on China - Market size and forecast 2024-2029 ($ million)
        • Chart on China - Year-over-year growth 2024-2029 (%)
        • Data Table on China - Year-over-year growth 2024-2029 (%)
      • 12.9 US - Market size and forecast 2024-2029
        • Chart on US - Market size and forecast 2024-2029 ($ million)
        • Data Table on US - Market size and forecast 2024-2029 ($ million)
        • Chart on US - Year-over-year growth 2024-2029 (%)
        • Data Table on US - Year-over-year growth 2024-2029 (%)
      • 12.10 India - Market size and forecast 2024-2029
        • Chart on India - Market size and forecast 2024-2029 ($ million)
        • Data Table on India - Market size and forecast 2024-2029 ($ million)
        • Chart on India - Year-over-year growth 2024-2029 (%)
        • Data Table on India - Year-over-year growth 2024-2029 (%)
      • 12.11 Germany - Market size and forecast 2024-2029
        • Chart on Germany - Market size and forecast 2024-2029 ($ million)
        • Data Table on Germany - Market size and forecast 2024-2029 ($ million)
        • Chart on Germany - Year-over-year growth 2024-2029 (%)
        • Data Table on Germany - Year-over-year growth 2024-2029 (%)
      • 12.12 UK - Market size and forecast 2024-2029
        • Chart on UK - Market size and forecast 2024-2029 ($ million)
        • Data Table on UK - Market size and forecast 2024-2029 ($ million)
        • Chart on UK - Year-over-year growth 2024-2029 (%)
        • Data Table on UK - Year-over-year growth 2024-2029 (%)
      • 12.13 Japan - Market size and forecast 2024-2029
        • Chart on Japan - Market size and forecast 2024-2029 ($ million)
        • Data Table on Japan - Market size and forecast 2024-2029 ($ million)
        • Chart on Japan - Year-over-year growth 2024-2029 (%)
        • Data Table on Japan - Year-over-year growth 2024-2029 (%)
      • 12.14 Canada - Market size and forecast 2024-2029
        • Chart on Canada - Market size and forecast 2024-2029 ($ million)
        • Data Table on Canada - Market size and forecast 2024-2029 ($ million)
        • Chart on Canada - Year-over-year growth 2024-2029 (%)
        • Data Table on Canada - Year-over-year growth 2024-2029 (%)
      • 12.15 France - Market size and forecast 2024-2029
        • Chart on France - Market size and forecast 2024-2029 ($ million)
        • Data Table on France - Market size and forecast 2024-2029 ($ million)
        • Chart on France - Year-over-year growth 2024-2029 (%)
        • Data Table on France - Year-over-year growth 2024-2029 (%)
      • 12.16 South Korea - Market size and forecast 2024-2029
        • Chart on South Korea - Market size and forecast 2024-2029 ($ million)
        • Data Table on South Korea - Market size and forecast 2024-2029 ($ million)
        • Chart on South Korea - Year-over-year growth 2024-2029 (%)
        • Data Table on South Korea - Year-over-year growth 2024-2029 (%)
      • 12.17 Italy - Market size and forecast 2024-2029
        • Chart on Italy - Market size and forecast 2024-2029 ($ million)
        • Data Table on Italy - Market size and forecast 2024-2029 ($ million)
        • Chart on Italy - Year-over-year growth 2024-2029 (%)
        • Data Table on Italy - Year-over-year growth 2024-2029 (%)
      • 12.18 Market opportunity by geography
        • Market opportunity by geography ($ million)
        • Data Tables on Market opportunity by geography ($ million)

      13 Drivers, Challenges, and Opportunity/Restraints

      • 13.1 Market drivers
        • 13.2 Market challenges
          • 13.3 Impact of drivers and challenges
            • Impact of drivers and challenges in 2024 and 2029
          • 13.4 Market opportunities/restraints

            14 Competitive Landscape

            • 14.1 Overview
              • 14.2 Competitive Landscape
                • Overview on criticality of inputs and factors of differentiation
              • 14.3 Landscape disruption
                • Overview on factors of disruption
              • 14.4 Industry risks
                • Impact of key risks on business

              15 Competitive Analysis

              • 15.1 Companies profiled
                • Companies covered
              • 15.2 Company ranking index
                • Company ranking index
              • 15.3 Market positioning of companies
                • Matrix on companies position and classification
              • 15.4 Aluminium Bahrain BSC
                • Aluminium Bahrain BSC - Overview
                • Aluminium Bahrain BSC - Product / Service
                • Aluminium Bahrain BSC - Key offerings
                • SWOT
              • 15.5 Asbury Carbons Inc.
                • Asbury Carbons Inc. - Overview
                • Asbury Carbons Inc. - Product / Service
                • Asbury Carbons Inc. - Key offerings
                • SWOT
              • 15.6 Atha Group
                • Atha Group - Overview
                • Atha Group - Product / Service
                • Atha Group - Key offerings
                • SWOT
              • 15.7 Chevron Corp.
                • Chevron Corp. - Overview
                • Chevron Corp. - Business segments
                • Chevron Corp. - Key news
                • Chevron Corp. - Key offerings
                • Chevron Corp. - Segment focus
                • SWOT
              • 15.8 China National Offshore Oil Corp.
                • China National Offshore Oil Corp. - Overview
                • China National Offshore Oil Corp. - Business segments
                • China National Offshore Oil Corp. - Key offerings
                • China National Offshore Oil Corp. - Segment focus
                • SWOT
              • 15.9 China National Petroleum Corp.
                • China National Petroleum Corp. - Overview
                • China National Petroleum Corp. - Product / Service
                • China National Petroleum Corp. - Key offerings
                • SWOT
              • 15.10 ConocoPhillips
                • ConocoPhillips - Overview
                • ConocoPhillips - Business segments
                • ConocoPhillips - Key offerings
                • ConocoPhillips - Segment focus
                • SWOT
              • 15.11 Exxon Mobil Corp.
                • Exxon Mobil Corp. - Overview
                • Exxon Mobil Corp. - Business segments
                • Exxon Mobil Corp. - Key news
                • Exxon Mobil Corp. - Key offerings
                • Exxon Mobil Corp. - Segment focus
                • SWOT
              • 15.12 Hebei Kangnaixing Carbon New Material Co. Ltd.
                • Hebei Kangnaixing Carbon New Material Co. Ltd. - Overview
                • Hebei Kangnaixing Carbon New Material Co. Ltd. - Product / Service
                • Hebei Kangnaixing Carbon New Material Co. Ltd. - Key offerings
                • SWOT
              • 15.13 National Iranian Oil Products Refining and Distribution Co.
                • National Iranian Oil Products Refining and Distribution Co. - Overview
                • National Iranian Oil Products Refining and Distribution Co. - Product / Service
                • National Iranian Oil Products Refining and Distribution Co. - Key offerings
                • SWOT
              • 15.14 Oxbow Corp.
                • Oxbow Corp. - Overview
                • Oxbow Corp. - Product / Service
                • Oxbow Corp. - Key offerings
                • SWOT
              • 15.15 Rain Industries Ltd.
                • Rain Industries Ltd. - Overview
                • Rain Industries Ltd. - Business segments
                • Rain Industries Ltd. - Key offerings
                • Rain Industries Ltd. - Segment focus
                • SWOT
              • 15.16 Shell plc
                • Shell plc - Overview
                • Shell plc - Business segments
                • Shell plc - Key news
                • Shell plc - Key offerings
                • Shell plc - Segment focus
                • SWOT
              • 15.17 TotalEnergies SE
                • TotalEnergies SE - Overview
                • TotalEnergies SE - Business segments
                • TotalEnergies SE - Key news
                • TotalEnergies SE - Key offerings
                • TotalEnergies SE - Segment focus
                • SWOT
              • 15.18 Valero Energy Corp.
                • Valero Energy Corp. - Overview
                • Valero Energy Corp. - Business segments
                • Valero Energy Corp. - Key offerings
                • Valero Energy Corp. - Segment focus
                • SWOT

              16 Appendix

              • 16.1 Scope of the report
                • 16.2 Inclusions and exclusions checklist
                  • Inclusions checklist
                  • Exclusions checklist
                • 16.3 Currency conversion rates for US$
                  • Currency conversion rates for US$
                • 16.4 Research methodology
                  • Research methodology
                • 16.5 Data procurement
                  • Information sources
                • 16.6 Data validation
                  • Data validation
                • 16.7 Validation techniques employed for market sizing
                  • Validation techniques employed for market sizing
                • 16.8 Data synthesis
                  • Data synthesis
                • 16.9 360 degree market analysis
                  • 360 degree market analysis
                • 16.10 List of abbreviations
                  • List of abbreviations

                Research Methodology

                Technavio presents a detailed picture of the market by way of study, synthesis, and summation of data from multiple sources. The analysts have presented the various facets of the market with a particular focus on identifying the key industry influencers. The data thus presented is comprehensive, reliable, and the result of extensive research, both primary and secondary.

                INFORMATION SOURCES

                Primary sources

                • Manufacturers and suppliers
                • Channel partners
                • Industry experts
                • Strategic decision makers

                Secondary sources

                • Industry journals and periodicals
                • Government data
                • Financial reports of key industry players
                • Historical data
                • Press releases

                DATA ANALYSIS

                Data Synthesis

                • Collation of data
                • Estimation of key figures
                • Analysis of derived insights

                Data Validation

                • Triangulation with data models
                • Reference against proprietary databases
                • Corroboration with industry experts

                REPORT WRITING

                Qualitative

                • Market drivers
                • Market challenges
                • Market trends
                • Five forces analysis

                Quantitative

                • Market size and forecast
                • Market segmentation
                • Geographical insights
                • Competitive landscape

                Interested in this report?

                Get your sample now to see our research methodology and insights!

                Download Now

                Frequently Asked Questions

                Green Petroleum Coke And Calcined Petroleum Coke market growth will increase by $ 12936 mn during 2025-2029.

                The Green Petroleum Coke And Calcined Petroleum Coke market is expected to grow at a CAGR of 7.1% during 2025-2029.

                Green Petroleum Coke And Calcined Petroleum Coke market is segmented by Application( Green petroleum coke, Calcined petroleum coke) Type( Fuel grade, Calcined coke) End-user( Aluminum industry, Steel industry, Cement industry, Others, South America)

                Aluminium Bahrain BSC, Asbury Carbons Inc., Atha Group, BP Plc, Chevron Corp., China National Offshore Oil Corp., China National Petroleum Corp., China Shenhua Energy Co. Ltd., ConocoPhillips, Exxon Mobil Corp., Gautam ZEN UK LTD., Hebei Kangnaixing Carbon New Material Co. Ltd., Minmat Ferro Alloys Pvt. Ltd., National Iranian Oil Products Refining and Distribution Co., Oxbow Corp., Rain Industries Ltd., RIZHAO HENGQIAO CARBON CO. LTD., Shell plc, TotalEnergies SE, Valero Energy Corp. are a few of the key vendors in the Green Petroleum Coke And Calcined Petroleum Coke market.

                APAC will register the highest growth rate of 51% among the other regions. Therefore, the Green Petroleum Coke And Calcined Petroleum Coke market in APAC is expected to garner significant business opportunities for the vendors during the forecast period.

                China, US, India, Germany, UK, Japan, Canada, France, South Korea, Italy

                • Increasing demand for aluminum and steelGreen petroleum coke and calcined petroleum coke have various applications in many industries is the driving factor this market.
                • including aluminum and steel. In the aluminum industry is the driving factor this market.
                • green petroleum coke and calcined petroleum coke is used as raw material to manufacture aluminum smelting electrodes is the driving factor this market.
                • which are used in the production of aluminum. In the steel industry is the driving factor this market.
                • green petroleum coke and calcined petroleum coke is used as raw material for making synthetic graphite electrodes that are used in steel production.Steel is crucial for economic growth. APAC countries such as China is the driving factor this market.
                • Japan is the driving factor this market.
                • and India are the major crude steel manufacturers in the world. The rapid infrastructural development and high economic growth in China are driving the growth of the steel industry. The growth of the automotive and construction industries in China is one of the major factors driving the demand for steel. India is one of the major regions that produce steel products due to the rising construction activities in the country. This indicates the high growth in steel production across the world is the driving factor this market.
                • which will spur the demand for green petroleum coke and calcined petroleum coke in steel production. Therefore is the driving factor this market.
                • the rising demand for aluminum and steel from various industries will stimulate the consumption of green petroleum coke and calcined petroleum coke is the driving factor this market.
                • which is the driving factor this market.
                • in turn is the driving factor this market.
                • will drive the growth of the global green petroleum coke and calcined petroleum coke market during the forecast period. is the driving factor this market.

                The Green Petroleum Coke And Calcined Petroleum Coke market vendors should focus on grabbing business opportunities from the Green petroleum coke segment as it accounted for the largest market share in the base year.