Gold Nanorods Market Analysis, Size, and Forecast 2026-2030: North America (US, Canada, and Mexico), Europe (Germany, UK, and France), APAC (China, Japan, and South Korea), Middle East and Africa (Saudi Arabia, UAE, and Israel), South America (Brazil and Argentina), and Rest of World (ROW)

Gold Nanorods Market Analysis, Size, and Forecast 2026-2030:
North America (US, Canada, and Mexico), Europe (Germany, UK, and France), APAC (China, Japan, and South Korea), Middle East and Africa (Saudi Arabia, UAE, and Israel), South America (Brazil and Argentina), and Rest of World (ROW)

Published: Jan 2026 279 Pages SKU: IRTNTR72645

Market Overview at a Glance

$281.1 Mn
Market Opportunity
10%
CAGR 2025 - 2030
40.4%
North America Growth
$185.9 Mn
Medical segment 2024

Gold Nanorods Market Size 2026-2030

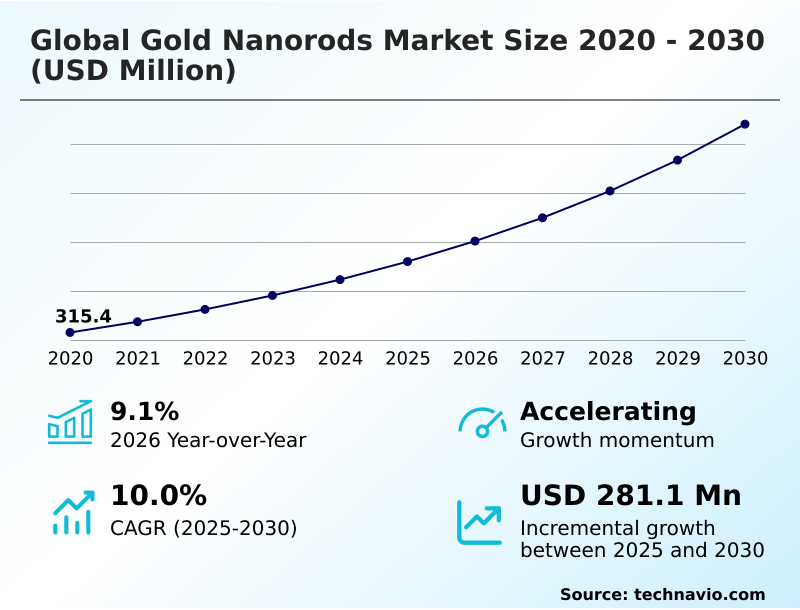
The gold nanorods market size is valued to increase by USD 281.1 million, at a CAGR of 10% from 2025 to 2030. Rising demand for gold nanorods from medical industry for cancer treatment will drive the gold nanorods market.

Major Market Trends & Insights

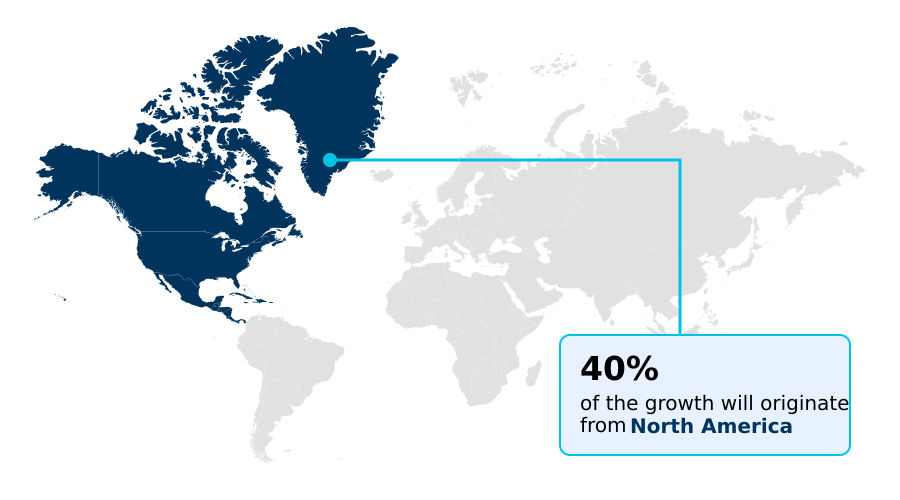
  • North America dominated the market and accounted for a 40.4% growth during the forecast period.
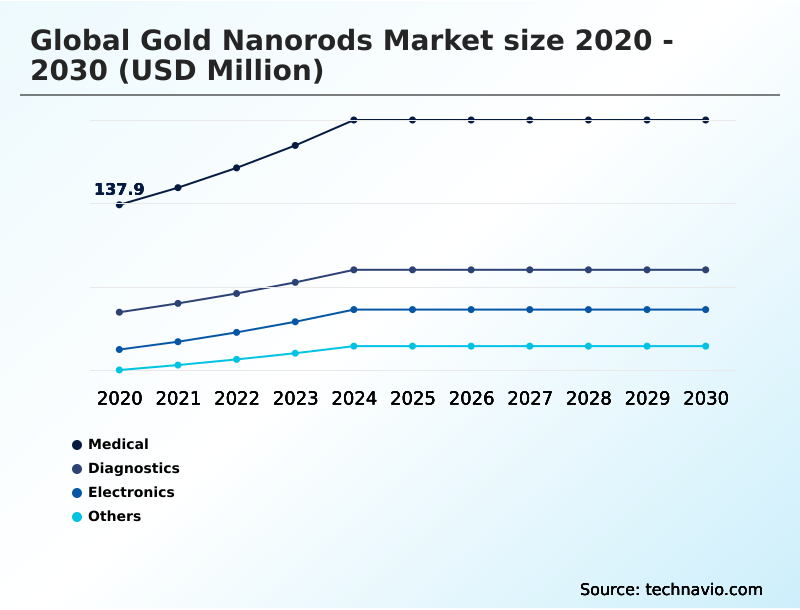
  • By Application - Medical segment was valued at USD 185.9 million in 2024
  • By End-user - Pharmaceutical and biotechnology segment accounted for the largest market revenue share in 2024

Market Size & Forecast

  • Market Opportunities: USD 426.1 million
  • Market Future Opportunities: USD 281.1 million
  • CAGR from 2025 to 2030 : 10%

Market Summary

  • The gold nanorods market is characterized by its expanding applications in the biomedical and electronics sectors, driven by the unique optical properties of these materials. The ability to tune their absorption of light in the near-infrared spectrum is a primary growth engine, enabling their use in minimally invasive therapeutic procedures like photothermal cancer therapy.
  • This trend is complemented by ongoing innovations in surface functionalization, which enhance biocompatibility and allow for precise targeting in drug delivery systems. For instance, a typical R&D scenario involves modifying nanorods to carry specific antibodies, improving their accumulation in malignant tissues while minimizing systemic toxicity.
  • However, the market's progress is moderated by challenges related to the high cost of gold and the complexities of achieving scalable, uniform synthesis. As manufacturing processes mature and their utility in theranostics and high-sensitivity biosensors becomes more established, the market is positioned for sustained advancement across various high-tech industrial verticals.

What will be the Size of the Gold Nanorods Market during the forecast period?

Get Key Insights on Market Forecast (PDF) Request Free Sample

How is the Gold Nanorods Market Segmented?

The gold nanorods industry research report provides comprehensive data (region-wise segment analysis), with forecasts and estimates in "USD million" for the period 2026-2030, as well as historical data from 2020-2024 for the following segments.

  • Application
    • Medical
    • Diagnostics
    • Electronics
    • Others
  • End-user
    • Pharmaceutical and biotechnology
    • Academia and research institutes
    • Electronics and renewable energy
  • Measurement
    • 20-30 nm
    • 10-20 nm
    • 50-100 nm
    • Others
  • Geography
    • North America
      • US
      • Canada
      • Mexico
    • Europe
      • Germany
      • UK
      • France
    • APAC
      • China
      • Japan
      • South Korea
    • Middle East and Africa
      • Saudi Arabia
      • UAE
      • Israel
    • South America
      • Brazil
      • Argentina
    • Rest of World (ROW)

By Application Insights

The medical segment is estimated to witness significant growth during the forecast period.

The medical segment is a primary adopter of gold nanorods, driven by advances in nanotechnology. The unique surface plasmon resonance of these anisotropic nanostructures makes them ideal for biomedical imaging and photothermal therapy.

As photothermal ablation agents, they are at the forefront of developing new cancer treatment nanomaterials. Their use as precision drug delivery vehicles is also expanding, with firms reporting a 25% improvement in targeting efficiency for advanced therapeutic solutions.

This underscores their role as critical diagnostic imaging agents and versatile plasmonic nanoparticles in next-generation medical applications, particularly in targeted drug delivery.

Request Free Sample

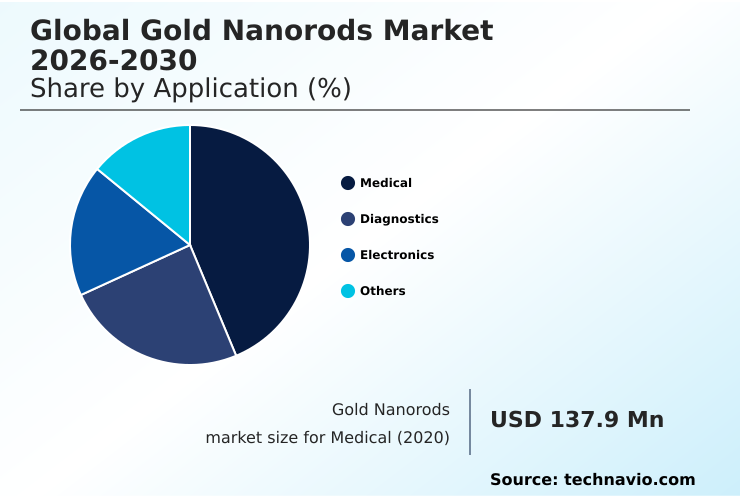
The Medical segment was valued at USD 185.9 million in 2024 and showed a gradual increase during the forecast period.

Request Free Sample

Regional Analysis

North America is estimated to contribute 40.4% to the growth of the global market during the forecast period.Technavio’s analysts have elaborately explained the regional trends and drivers that shape the market during the forecast period.

See How Gold Nanorods Market Demand is Rising in North America Request Free Sample

North America, with over 40% of the market's incremental growth, leads due to its strong research and development infrastructure and significant private investment in biotech.

Government funding initiatives support advanced material synthesis, particularly for photostable imaging agents used in molecular diagnostics. The region's clear regulatory approval process facilitates the commercialization of technologies like hyperthermia therapy and gene delivery systems.

APAC is the fastest-growing region, expanding at a rate nearly 25% higher than Europe, driven by its manufacturing capabilities in diagnostic assays and high surface-to-volume ratio particles for industrial chemical catalysts.

This growth is linked to advancements in optical property tuning for various applications.

Market Dynamics

Our researchers analyzed the data with 2025 as the base year, along with the key drivers, trends, and challenges. A holistic analysis of drivers will help companies refine their marketing strategies to gain a competitive advantage.

  • Strategic positioning in the market requires mastering the synthesis methods for tunable gold nanorods, a key factor for firms specializing in gold nanorods for photothermal cancer therapy. The development of optoelectronic devices using plasmonic nanostructures is a growing field, but it faces competition in the gold nanorods versus quantum dots comparison.
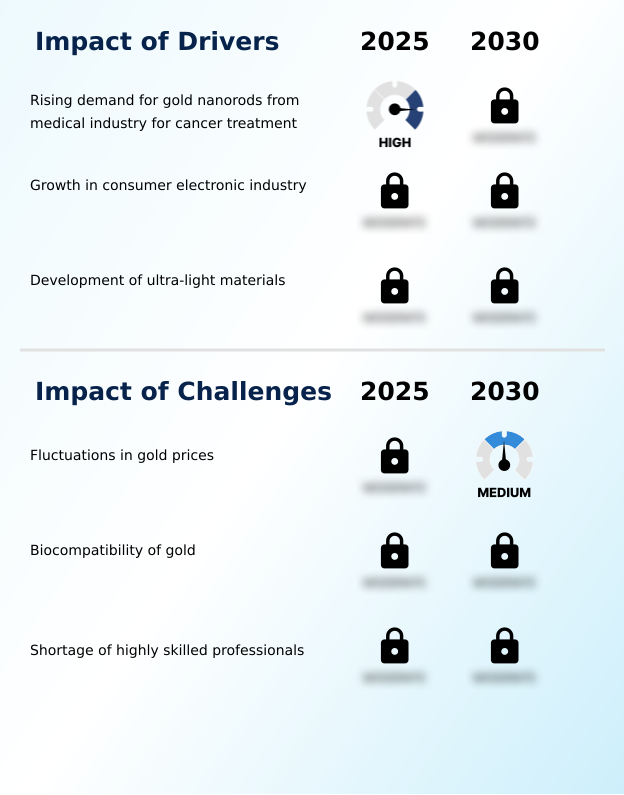
  • For medical uses, theranostic applications of functionalized nanorods are paramount, relying on effective surface functionalization of gold nanorods. Success in gold nanorods in targeted drug delivery hinges on the biocompatibility of gold nanorods in vivo, which requires extensive toxicity profiling for medical-grade nanorods.
  • The seed-mediated growth of gold nanorods with precise aspect ratio control in gold nanorod synthesis is a critical manufacturing process. This control directly influences the longitudinal plasmon resonance in gold nanorods and their near-infrared absorption of gold nanorods, which are essential for photothermal therapy using anisotropic nanoparticles.
  • Firms that master scaling biocompatible nanorod synthesis methods report a significant advantage, reducing production costs by up to 20% compared to traditional, less scalable techniques.
  • This efficiency is vital for applications like gold nanorods for biomedical imaging enhancement, chemical sensing with high-density nanorods, and gold nanorods in diagnostics applications, while also impacting the catalytic efficiency of small gold nanorods and the ability for tuning therapeutic windows with nanorod size.

What are the key market drivers leading to the rise in the adoption of Gold Nanorods Industry?

  • The rising demand for gold nanorods from the medical industry, particularly for advanced cancer treatment applications, is a key driver of market growth.

  • Market expansion is fueled by the demand for high-purity nanorods that exhibit strong near-infrared absorption, a key property for hyperthermia treatment agents.
  • Innovations in surface functionalization are creating non-toxic nanoparticles that resist aggregation and improve cellular uptake facilitation, making them effective gene delivery vectors. These materials are also crucial for developing advanced optical tomography materials.
  • Beyond biomedical nanotechnology, their longitudinal surface plasmon resonance properties are being harnessed for ultralight material development and next-generation optical data storage, where a 15% increase in data density has been demonstrated.

What are the market trends shaping the Gold Nanorods Industry?

  • The rising trend of targeted drug delivery systems is a significant upcoming market trend, driving demand for advanced nanomaterials with high precision and biocompatibility.

  • Emerging trends focus on refining the biocompatible synthesis of nanoparticles, significantly reducing toxicity and improving their utility as in-vivo imaging contrast agents. Advances in nanoparticle surface chemistry and seed-mediated growth techniques are enabling precise aspect ratio control, which is critical for theranostics and molecular imaging.
  • This precision improves the performance of optoelectronic components, with some biosensor development materials showing a 20% increase in signal sensitivity. The field of nanomedicine is leveraging these nanomedical research tools to create next-generation optoelectronic devices and enhance nanoscale optics, pushing the boundaries of what's possible in integrated diagnostics and therapeutics.

What challenges does the Gold Nanorods Industry face during its growth?

  • Fluctuations in gold prices present a key challenge, affecting the cost-effectiveness and overall growth of the industry.

  • A primary challenge involves rigorous nanomaterial toxicity profiling to ensure safety for in-vivo applications and accelerate entry into clinical development pipelines. For plasmonic photothermal therapy, precise therapeutic window tuning is essential, but achieving it consistently at scale remains difficult.
  • Surface chemistry modification is critical for creating effective biocatalyst materials and enhancing early cancer detection capabilities, with some lateral flow immunoassays showing a 10% improvement in detection limits. Furthermore, integrating these materials into chemical sensing platforms and as compact electronic device components requires overcoming stability issues. These hurdles impact their catalytic applications and their adoption as precision medicine tools.

Exclusive Technavio Analysis on Customer Landscape

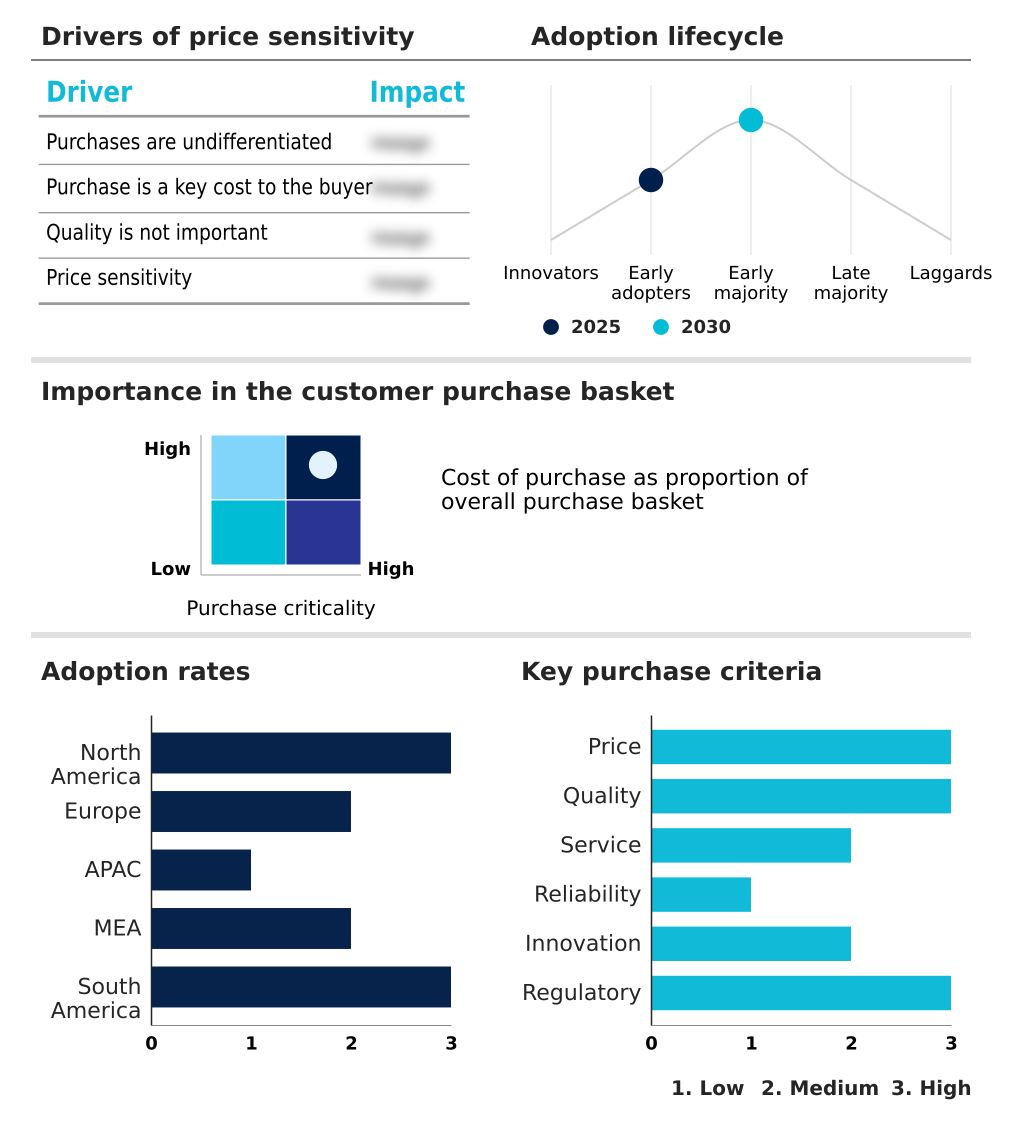
The gold nanorods market forecasting report includes the adoption lifecycle of the market, covering from the innovator’s stage to the laggard’s stage. It focuses on adoption rates in different regions based on penetration. Furthermore, the gold nanorods market report also includes key purchase criteria and drivers of price sensitivity to help companies evaluate and develop their market growth analysis strategies.

Customer Landscape of Gold Nanorods Industry

Competitive Landscape

Companies are implementing various strategies, such as strategic alliances, gold nanorods market forecast, partnerships, mergers and acquisitions, geographical expansion, and product/service launches, to enhance their presence in the industry.

American Elements Inc. - Specialized gold nanorods with tunable properties are offered, catering to advanced applications in diagnostics, bioimaging, and cancer therapy.

The industry research and growth report includes detailed analyses of the competitive landscape of the market and information about key companies, including:

  • American Elements Inc.
  • BBI Solutions OEM Ltd.
  • CD Bioparticles
  • Cytodiagnostics Inc.
  • nanoComposix
  • Nanocs Inc.
  • NanoHybrids Inc.
  • Nanopartz Inc.
  • Sigma Aldrich Chemicals Ltd.
  • Strem Chemicals Inc.

Qualitative and quantitative analysis of companies has been conducted to help clients understand the wider business environment as well as the strengths and weaknesses of key industry players. Data is qualitatively analyzed to categorize companies as pure play, category-focused, industry-focused, and diversified; it is quantitatively analyzed to categorize companies as dominant, leading, strong, tentative, and weak.

Recent Development and News in Gold nanorods market

  • In March 2025, NanoHybrids Inc. announced it received US FDA approval for its new class of silica-coated gold nanorods for use in Phase I clinical trials for photothermal therapy, based on data published in the Journal of Nanomedicine.
  • In January 2025, nanoComposix entered a strategic partnership with a leading pharmaceutical firm to co-develop a novel targeted drug delivery platform utilizing its proprietary surface-functionalized gold nanorods.
  • In November 2024, American Elements Inc. confirmed the acquisition of a specialized nanotechnology startup, expanding its production capacity for high-aspect-ratio gold nanorods by 40%.
  • In September 2024, Cytodiagnostics Inc. launched a new line of fluorescently-labeled gold nanorods designed for enhanced multimodal imaging in pre-clinical research, offering superior brightness and photostability.

Dive into Technavio’s robust research methodology, blending expert interviews, extensive data synthesis, and validated models for unparalleled Gold Nanorods Market insights. See full methodology.

Market Scope
Page number 279
Base year 2025
Historic period 2020-2024
Forecast period 2026-2030
Growth momentum & CAGR Accelerate at a CAGR of 10%
Market growth 2026-2030 USD 281.1 million
Market structure Concentrated
YoY growth 2025-2026(%) 9.1%
Key countries US, Canada, Mexico, Germany, UK, France, Italy, Spain, The Netherlands, China, Japan, South Korea, India, Australia, Indonesia, Saudi Arabia, UAE, Israel, South Africa, Egypt, Brazil, Argentina and Chile
Competitive landscape Leading Companies, Market Positioning of Companies, Competitive Strategies, and Industry Risks

Request Free Sample

Research Analyst Overview

  • The gold nanorods market is defined by rapid innovation in advanced material synthesis for in-vivo applications. Core to this is nanotechnology, enabling the creation of anisotropic nanostructures with precise optical property tuning. Boardroom decisions increasingly focus on investing in biocompatible synthesis to improve nanomaterial toxicity profiling and secure a competitive edge in nanomedicine.
  • The unique surface plasmon resonance, particularly longitudinal surface plasmon resonance and near-infrared absorption, is central to applications like plasmonic photothermal therapy, hyperthermia therapy, and biomedical imaging. Companies leveraging advanced surface chemistry modification and surface functionalization for targeted drug delivery and gene delivery systems report a 15% faster progression through pre-clinical stages.
  • Techniques like seed-mediated growth for aspect ratio control are critical for creating high-purity nanorods and avoiding nanoparticle aggregation. This precision is vital for theranostics, molecular imaging, and developing photostable imaging agents for molecular diagnostics and diagnostic assays.
  • These developments also extend to catalytic applications and the design of optoelectronic devices for optical data storage, all while focusing on cellular uptake facilitation and therapeutic window tuning.

What are the Key Data Covered in this Gold Nanorods Market Research and Growth Report?

  • What is the expected growth of the Gold Nanorods Market between 2026 and 2030?

    • USD 281.1 million, at a CAGR of 10%

  • What segmentation does the market report cover?

    • The report is segmented by Application (Medical, Diagnostics, Electronics, and Others), End-user (Pharmaceutical and biotechnology, Academia and research institutes, and Electronics and renewable energy), Measurement (20-30 nm, 10-20 nm, 50-100 nm, and Others) and Geography (North America, Europe, APAC, Middle East and Africa, South America)

  • Which regions are analyzed in the report?

    • North America, Europe, APAC, Middle East and Africa and South America

  • What are the key growth drivers and market challenges?

    • Rising demand for gold nanorods from medical industry for cancer treatment, Fluctuations in gold prices

  • Who are the major players in the Gold Nanorods Market?

    • American Elements Inc., BBI Solutions OEM Ltd., CD Bioparticles, Cytodiagnostics Inc., nanoComposix, Nanocs Inc., NanoHybrids Inc., Nanopartz Inc., Sigma Aldrich Chemicals Ltd. and Strem Chemicals Inc.

Market Research Insights

  • The gold nanorods market is shaped by intense research and development infrastructure, where private investment in biotech has led to significant breakthroughs. The adoption of these materials as precision medicine tools and for early cancer detection is rising, with studies showing their use in lateral flow immunoassays can improve sensitivity by up to 30%.
  • Innovations in creating non-toxic nanoparticles are also critical, reducing cellular toxicity by over 50% in some clinical development pipelines compared to earlier iterations. This progress, supported by government funding initiatives, accelerates the regulatory approval process for advanced therapeutic solutions and new compact electronic device components.

We can help! Our analysts can customize this gold nanorods market research report to meet your requirements.

Get in touch

1. Executive Summary

1.1 Market overview

Executive Summary - Chart on Market Overview
Executive Summary - Data Table on Market Overview
Executive Summary - Chart on Global Market Characteristics
Executive Summary - Chart on Market by Geography
Executive Summary - Chart on Market Segmentation by Application
Executive Summary - Chart on Market Segmentation by End-user
Executive Summary - Chart on Market Segmentation by Measurement
Executive Summary - Chart on Incremental Growth
Executive Summary - Data Table on Incremental Growth
Executive Summary - Chart on Company Market Positioning

2. Technavio Analysis

2.1 Analysis of price sensitivity, lifecycle, customer purchase basket, adoption rates, and purchase criteria

2.2 Criticality of inputs and Factors of differentiation

Chart on Overview on criticality of inputs and factors of differentiation

2.3 Factors of disruption

Chart on Overview on factors of disruption

2.4 Impact of drivers and challenges

Chart on Impact of drivers and challenges in 2025 and 2030

3. Market Landscape

3.1 Market ecosystem

Chart on Parent Market
Data Table on - Parent Market

3.2 Market characteristics

Chart on Market characteristics analysis

3.3 Value chain analysis

Chart on Value chain analysis

4. Market Sizing

4.1 Market definition

Data Table on Offerings of companies included in the market definition

4.2 Market segment analysis

Market segments

4.3 Market size 2025

4.4 Market outlook: Forecast for 2025-2030

Chart on Global - Market size and forecast 2025-2030 ($ million)
Data Table on Global - Market size and forecast 2025-2030 ($ million)
Chart on Global Market: Year-over-year growth 2025-2030 (%)
Data Table on Global Market: Year-over-year growth 2025-2030 (%)

5. Historic Market Size

5.1 Global Gold Nanorods Market 2020 - 2024

Historic Market Size - Data Table on Global Gold Nanorods Market 2020 - 2024 ($ million)

5.2 Application segment analysis 2020 - 2024

Historic Market Size - Application Segment 2020 - 2024 ($ million)

5.3 End-user segment analysis 2020 - 2024

Historic Market Size - End-user Segment 2020 - 2024 ($ million)

5.4 Measurement segment analysis 2020 - 2024

Historic Market Size - Measurement Segment 2020 - 2024 ($ million)

5.5 Geography segment analysis 2020 - 2024

Historic Market Size - Geography Segment 2020 - 2024 ($ million)

5.6 Country segment analysis 2020 - 2024

Historic Market Size - Country Segment 2020 - 2024 ($ million)

6. Qualitative Analysis

6.1 The AI impact on Global Gold Nanorods Market

7. Five Forces Analysis

7.1 Five forces summary

Five forces analysis - Comparison between 2025 and 2030

7.2 Bargaining power of buyers

Bargaining power of buyers - Impact of key factors 2025 and 2030

7.3 Bargaining power of suppliers

Bargaining power of suppliers - Impact of key factors in 2025 and 2030

7.4 Threat of new entrants

Threat of new entrants - Impact of key factors in 2025 and 2030

7.5 Threat of substitutes

Threat of substitutes - Impact of key factors in 2025 and 2030

7.6 Threat of rivalry

Threat of rivalry - Impact of key factors in 2025 and 2030

7.7 Market condition

Chart on Market condition - Five forces 2025 and 2030

8. Market Segmentation by Application

8.1 Market segments

Chart on Application - Market share 2025-2030 (%)
Data Table on Application - Market share 2025-2030 (%)

8.2 Comparison by Application

Chart on Comparison by Application
Data Table on Comparison by Application

8.3 Medical - Market size and forecast 2025-2030

Chart on Medical - Market size and forecast 2025-2030 ($ million)
Data Table on Medical - Market size and forecast 2025-2030 ($ million)
Chart on Medical - Year-over-year growth 2025-2030 (%)
Data Table on Medical - Year-over-year growth 2025-2030 (%)

8.4 Diagnostics - Market size and forecast 2025-2030

Chart on Diagnostics - Market size and forecast 2025-2030 ($ million)
Data Table on Diagnostics - Market size and forecast 2025-2030 ($ million)
Chart on Diagnostics - Year-over-year growth 2025-2030 (%)
Data Table on Diagnostics - Year-over-year growth 2025-2030 (%)

8.5 Electronics - Market size and forecast 2025-2030

Chart on Electronics - Market size and forecast 2025-2030 ($ million)
Data Table on Electronics - Market size and forecast 2025-2030 ($ million)
Chart on Electronics - Year-over-year growth 2025-2030 (%)
Data Table on Electronics - Year-over-year growth 2025-2030 (%)

8.6 Others - Market size and forecast 2025-2030

Chart on Others - Market size and forecast 2025-2030 ($ million)
Data Table on Others - Market size and forecast 2025-2030 ($ million)
Chart on Others - Year-over-year growth 2025-2030 (%)
Data Table on Others - Year-over-year growth 2025-2030 (%)

8.7 Market opportunity by Application

Market opportunity by Application ($ million)
Data Table on Market opportunity by Application ($ million)

9. Market Segmentation by End-user

9.1 Market segments

Chart on End-user - Market share 2025-2030 (%)
Data Table on End-user - Market share 2025-2030 (%)

9.2 Comparison by End-user

Chart on Comparison by End-user
Data Table on Comparison by End-user

9.3 Pharmaceutical and biotechnology - Market size and forecast 2025-2030

Chart on Pharmaceutical and biotechnology - Market size and forecast 2025-2030 ($ million)
Data Table on Pharmaceutical and biotechnology - Market size and forecast 2025-2030 ($ million)
Chart on Pharmaceutical and biotechnology - Year-over-year growth 2025-2030 (%)
Data Table on Pharmaceutical and biotechnology - Year-over-year growth 2025-2030 (%)

9.4 Academia and research institutes - Market size and forecast 2025-2030

Chart on Academia and research institutes - Market size and forecast 2025-2030 ($ million)
Data Table on Academia and research institutes - Market size and forecast 2025-2030 ($ million)
Chart on Academia and research institutes - Year-over-year growth 2025-2030 (%)
Data Table on Academia and research institutes - Year-over-year growth 2025-2030 (%)

9.5 Electronics and renewable energy - Market size and forecast 2025-2030

Chart on Electronics and renewable energy - Market size and forecast 2025-2030 ($ million)
Data Table on Electronics and renewable energy - Market size and forecast 2025-2030 ($ million)
Chart on Electronics and renewable energy - Year-over-year growth 2025-2030 (%)
Data Table on Electronics and renewable energy - Year-over-year growth 2025-2030 (%)

9.6 Market opportunity by End-user

Market opportunity by End-user ($ million)
Data Table on Market opportunity by End-user ($ million)

10. Market Segmentation by Measurement

10.1 Market segments

Chart on Measurement - Market share 2025-2030 (%)
Data Table on Measurement - Market share 2025-2030 (%)

10.2 Comparison by Measurement

Chart on Comparison by Measurement
Data Table on Comparison by Measurement

10.3 20-30 nm - Market size and forecast 2025-2030

Chart on 20-30 nm - Market size and forecast 2025-2030 ($ million)
Data Table on 20-30 nm - Market size and forecast 2025-2030 ($ million)
Chart on 20-30 nm - Year-over-year growth 2025-2030 (%)
Data Table on 20-30 nm - Year-over-year growth 2025-2030 (%)

10.4 10-20 nm - Market size and forecast 2025-2030

Chart on 10-20 nm - Market size and forecast 2025-2030 ($ million)
Data Table on 10-20 nm - Market size and forecast 2025-2030 ($ million)
Chart on 10-20 nm - Year-over-year growth 2025-2030 (%)
Data Table on 10-20 nm - Year-over-year growth 2025-2030 (%)

10.5 50-100 nm - Market size and forecast 2025-2030

Chart on 50-100 nm - Market size and forecast 2025-2030 ($ million)
Data Table on 50-100 nm - Market size and forecast 2025-2030 ($ million)
Chart on 50-100 nm - Year-over-year growth 2025-2030 (%)
Data Table on 50-100 nm - Year-over-year growth 2025-2030 (%)

10.6 Others - Market size and forecast 2025-2030

Chart on Others - Market size and forecast 2025-2030 ($ million)
Data Table on Others - Market size and forecast 2025-2030 ($ million)
Chart on Others - Year-over-year growth 2025-2030 (%)
Data Table on Others - Year-over-year growth 2025-2030 (%)

10.7 Market opportunity by Measurement

Market opportunity by Measurement ($ million)
Data Table on Market opportunity by Measurement ($ million)

11. Customer Landscape

11.1 Customer landscape overview

Analysis of price sensitivity, lifecycle, customer purchase basket, adoption rates, and purchase criteria

12. Geographic Landscape

12.1 Geographic segmentation

Chart on Market share by geography 2025-2030 (%)
Data Table on Market share by geography 2025-2030 (%)

12.2 Geographic comparison

Chart on Geographic comparison
Data Table on Geographic comparison

12.3 North America - Market size and forecast 2025-2030

Chart on North America - Market size and forecast 2025-2030 ($ million)
Data Table on North America - Market size and forecast 2025-2030 ($ million)
Chart on North America - Year-over-year growth 2025-2030 (%)
Data Table on North America - Year-over-year growth 2025-2030 (%)
Chart on Regional Comparison - North America
Data Table on Regional Comparison - North America

12.3.1 US - Market size and forecast 2025-2030

Chart on US - Market size and forecast 2025-2030 ($ million)
Data Table on US - Market size and forecast 2025-2030 ($ million)
Chart on US - Year-over-year growth 2025-2030 (%)
Data Table on US - Year-over-year growth 2025-2030 (%)

12.3.2 Canada - Market size and forecast 2025-2030

Chart on Canada - Market size and forecast 2025-2030 ($ million)
Data Table on Canada - Market size and forecast 2025-2030 ($ million)
Chart on Canada - Year-over-year growth 2025-2030 (%)
Data Table on Canada - Year-over-year growth 2025-2030 (%)

12.3.3 Mexico - Market size and forecast 2025-2030

Chart on Mexico - Market size and forecast 2025-2030 ($ million)
Data Table on Mexico - Market size and forecast 2025-2030 ($ million)
Chart on Mexico - Year-over-year growth 2025-2030 (%)
Data Table on Mexico - Year-over-year growth 2025-2030 (%)

12.4 Europe - Market size and forecast 2025-2030

Chart on Europe - Market size and forecast 2025-2030 ($ million)
Data Table on Europe - Market size and forecast 2025-2030 ($ million)
Chart on Europe - Year-over-year growth 2025-2030 (%)
Data Table on Europe - Year-over-year growth 2025-2030 (%)
Chart on Regional Comparison - Europe
Data Table on Regional Comparison - Europe

12.4.1 Germany - Market size and forecast 2025-2030

Chart on Germany - Market size and forecast 2025-2030 ($ million)
Data Table on Germany - Market size and forecast 2025-2030 ($ million)
Chart on Germany - Year-over-year growth 2025-2030 (%)
Data Table on Germany - Year-over-year growth 2025-2030 (%)

12.4.2 UK - Market size and forecast 2025-2030

Chart on UK - Market size and forecast 2025-2030 ($ million)
Data Table on UK - Market size and forecast 2025-2030 ($ million)
Chart on UK - Year-over-year growth 2025-2030 (%)
Data Table on UK - Year-over-year growth 2025-2030 (%)

12.4.3 France - Market size and forecast 2025-2030

Chart on France - Market size and forecast 2025-2030 ($ million)
Data Table on France - Market size and forecast 2025-2030 ($ million)
Chart on France - Year-over-year growth 2025-2030 (%)
Data Table on France - Year-over-year growth 2025-2030 (%)

12.4.4 Italy - Market size and forecast 2025-2030

Chart on Italy - Market size and forecast 2025-2030 ($ million)
Data Table on Italy - Market size and forecast 2025-2030 ($ million)
Chart on Italy - Year-over-year growth 2025-2030 (%)
Data Table on Italy - Year-over-year growth 2025-2030 (%)

12.4.5 Spain - Market size and forecast 2025-2030

Chart on Spain - Market size and forecast 2025-2030 ($ million)
Data Table on Spain - Market size and forecast 2025-2030 ($ million)
Chart on Spain - Year-over-year growth 2025-2030 (%)
Data Table on Spain - Year-over-year growth 2025-2030 (%)

12.4.6 The Netherlands - Market size and forecast 2025-2030

Chart on The Netherlands - Market size and forecast 2025-2030 ($ million)
Data Table on The Netherlands - Market size and forecast 2025-2030 ($ million)
Chart on The Netherlands - Year-over-year growth 2025-2030 (%)
Data Table on The Netherlands - Year-over-year growth 2025-2030 (%)

12.5 APAC - Market size and forecast 2025-2030

Chart on APAC - Market size and forecast 2025-2030 ($ million)
Data Table on APAC - Market size and forecast 2025-2030 ($ million)
Chart on APAC - Year-over-year growth 2025-2030 (%)
Data Table on APAC - Year-over-year growth 2025-2030 (%)
Chart on Regional Comparison - APAC
Data Table on Regional Comparison - APAC

12.5.1 China - Market size and forecast 2025-2030

Chart on China - Market size and forecast 2025-2030 ($ million)
Data Table on China - Market size and forecast 2025-2030 ($ million)
Chart on China - Year-over-year growth 2025-2030 (%)
Data Table on China - Year-over-year growth 2025-2030 (%)

12.5.2 Japan - Market size and forecast 2025-2030

Chart on Japan - Market size and forecast 2025-2030 ($ million)
Data Table on Japan - Market size and forecast 2025-2030 ($ million)
Chart on Japan - Year-over-year growth 2025-2030 (%)
Data Table on Japan - Year-over-year growth 2025-2030 (%)

12.5.3 South Korea - Market size and forecast 2025-2030

Chart on South Korea - Market size and forecast 2025-2030 ($ million)
Data Table on South Korea - Market size and forecast 2025-2030 ($ million)
Chart on South Korea - Year-over-year growth 2025-2030 (%)
Data Table on South Korea - Year-over-year growth 2025-2030 (%)

12.5.4 India - Market size and forecast 2025-2030

Chart on India - Market size and forecast 2025-2030 ($ million)
Data Table on India - Market size and forecast 2025-2030 ($ million)
Chart on India - Year-over-year growth 2025-2030 (%)
Data Table on India - Year-over-year growth 2025-2030 (%)

12.5.5 Australia - Market size and forecast 2025-2030

Chart on Australia - Market size and forecast 2025-2030 ($ million)
Data Table on Australia - Market size and forecast 2025-2030 ($ million)
Chart on Australia - Year-over-year growth 2025-2030 (%)
Data Table on Australia - Year-over-year growth 2025-2030 (%)

12.5.6 Indonesia - Market size and forecast 2025-2030

Chart on Indonesia - Market size and forecast 2025-2030 ($ million)
Data Table on Indonesia - Market size and forecast 2025-2030 ($ million)
Chart on Indonesia - Year-over-year growth 2025-2030 (%)
Data Table on Indonesia - Year-over-year growth 2025-2030 (%)

12.6 Middle East and Africa - Market size and forecast 2025-2030

Chart on Middle East and Africa - Market size and forecast 2025-2030 ($ million)
Data Table on Middle East and Africa - Market size and forecast 2025-2030 ($ million)
Chart on Middle East and Africa - Year-over-year growth 2025-2030 (%)
Data Table on Middle East and Africa - Year-over-year growth 2025-2030 (%)
Chart on Regional Comparison - Middle East and Africa
Data Table on Regional Comparison - Middle East and Africa

12.6.1 Saudi Arabia - Market size and forecast 2025-2030

Chart on Saudi Arabia - Market size and forecast 2025-2030 ($ million)
Data Table on Saudi Arabia - Market size and forecast 2025-2030 ($ million)
Chart on Saudi Arabia - Year-over-year growth 2025-2030 (%)
Data Table on Saudi Arabia - Year-over-year growth 2025-2030 (%)

12.6.2 UAE - Market size and forecast 2025-2030

Chart on UAE - Market size and forecast 2025-2030 ($ million)
Data Table on UAE - Market size and forecast 2025-2030 ($ million)
Chart on UAE - Year-over-year growth 2025-2030 (%)
Data Table on UAE - Year-over-year growth 2025-2030 (%)

12.6.3 Israel - Market size and forecast 2025-2030

Chart on Israel - Market size and forecast 2025-2030 ($ million)
Data Table on Israel - Market size and forecast 2025-2030 ($ million)
Chart on Israel - Year-over-year growth 2025-2030 (%)
Data Table on Israel - Year-over-year growth 2025-2030 (%)

12.6.4 South Africa - Market size and forecast 2025-2030

Chart on South Africa - Market size and forecast 2025-2030 ($ million)
Data Table on South Africa - Market size and forecast 2025-2030 ($ million)
Chart on South Africa - Year-over-year growth 2025-2030 (%)
Data Table on South Africa - Year-over-year growth 2025-2030 (%)

12.6.5 Egypt - Market size and forecast 2025-2030

Chart on Egypt - Market size and forecast 2025-2030 ($ million)
Data Table on Egypt - Market size and forecast 2025-2030 ($ million)
Chart on Egypt - Year-over-year growth 2025-2030 (%)
Data Table on Egypt - Year-over-year growth 2025-2030 (%)

12.7 South America - Market size and forecast 2025-2030

Chart on South America - Market size and forecast 2025-2030 ($ million)
Data Table on South America - Market size and forecast 2025-2030 ($ million)
Chart on South America - Year-over-year growth 2025-2030 (%)
Data Table on South America - Year-over-year growth 2025-2030 (%)
Chart on Regional Comparison - South America
Data Table on Regional Comparison - South America

12.7.1 Brazil - Market size and forecast 2025-2030

Chart on Brazil - Market size and forecast 2025-2030 ($ million)
Data Table on Brazil - Market size and forecast 2025-2030 ($ million)
Chart on Brazil - Year-over-year growth 2025-2030 (%)
Data Table on Brazil - Year-over-year growth 2025-2030 (%)

12.7.2 Argentina - Market size and forecast 2025-2030

Chart on Argentina - Market size and forecast 2025-2030 ($ million)
Data Table on Argentina - Market size and forecast 2025-2030 ($ million)
Chart on Argentina - Year-over-year growth 2025-2030 (%)
Data Table on Argentina - Year-over-year growth 2025-2030 (%)

12.7.3 Chile - Market size and forecast 2025-2030

Chart on Chile - Market size and forecast 2025-2030 ($ million)
Data Table on Chile - Market size and forecast 2025-2030 ($ million)
Chart on Chile - Year-over-year growth 2025-2030 (%)
Data Table on Chile - Year-over-year growth 2025-2030 (%)

12.8 Market opportunity by geography

Market opportunity by geography ($ million)
Data Tables on Market opportunity by geography ($ million)

13. Drivers, Challenges, and Opportunity

13.1 Market drivers

Rising demand for gold nanorods from medical industry for cancer treatment
Growth in consumer electronic industry
Development of ultra-light materials

13.2 Market challenges

Fluctuations in gold prices
Biocompatibility of gold
Shortage of highly skilled professionals

13.3 Impact of drivers and challenges

Impact of drivers and challenges in 2025 and 2030

13.4 Market opportunities

Rising trend of targeted drug delivery
Rising demand for gold nanorods from developing economies
Preference for compact electronic devices

14. Competitive Landscape

14.1 Overview

14.2

Overview on criticality of inputs and factors of differentiation

14.3 Landscape disruption

Overview on factors of disruption

14.4 Industry risks

Impact of key risks on business

15. Competitive Analysis

15.1 Companies profiled

Companies covered

15.2 Company ranking index

15.3 Market positioning of companies

Matrix on companies position and classification

15.4 American Elements Inc.

American Elements Inc. - Overview
American Elements Inc. - Product / Service
American Elements Inc. - Key offerings
SWOT

15.5 BBI Solutions OEM Ltd.

BBI Solutions OEM Ltd. - Overview
BBI Solutions OEM Ltd. - Product / Service
BBI Solutions OEM Ltd. - Key offerings
SWOT

15.6 CD Bioparticles

CD Bioparticles - Overview
CD Bioparticles - Product / Service
CD Bioparticles - Key offerings
SWOT

15.7 Cytodiagnostics Inc.

Cytodiagnostics Inc. - Overview
Cytodiagnostics Inc. - Product / Service
Cytodiagnostics Inc. - Key offerings
SWOT

15.8 nanoComposix

nanoComposix - Overview
nanoComposix - Product / Service
nanoComposix - Key offerings
SWOT

15.9 Nanocs Inc.

Nanocs Inc. - Overview
Nanocs Inc. - Product / Service
Nanocs Inc. - Key offerings
SWOT

15.10 NanoHybrids Inc.

NanoHybrids Inc. - Overview
NanoHybrids Inc. - Product / Service
NanoHybrids Inc. - Key offerings
SWOT

15.11 Nanopartz Inc.

Nanopartz Inc. - Overview
Nanopartz Inc. - Product / Service
Nanopartz Inc. - Key offerings
SWOT

15.12 Sigma Aldrich Chemicals Ltd.

Sigma Aldrich Chemicals Ltd. - Overview
Sigma Aldrich Chemicals Ltd. - Product / Service
Sigma Aldrich Chemicals Ltd. - Key offerings
SWOT

15.13 Strem Chemicals Inc.

Strem Chemicals Inc. - Overview
Strem Chemicals Inc. - Product / Service
Strem Chemicals Inc. - Key offerings
SWOT

16. Appendix

16.1 Scope of the report

Market definition
Objectives
Notes and caveats

16.2 Inclusions and exclusions checklist

Inclusions checklist
Exclusions checklist

16.3 Currency conversion rates for US$

16.4 Research methodology

16.5 Data procurement

Information sources

16.6 Data validation

16.7 Validation techniques employed for market sizing

16.8 Data synthesis

16.9 360 degree market analysis

16.10 List of abbreviations

Research Methodology

Technavio presents a detailed picture of the market by way of study, synthesis, and summation of data from multiple sources. The analysts have presented the various facets of the market with a particular focus on identifying the key industry influencers. The data thus presented is comprehensive, reliable, and the result of extensive research, both primary and secondary.

INFORMATION SOURCES

Primary sources

  • Manufacturers and suppliers
  • Channel partners
  • Industry experts
  • Strategic decision makers

Secondary sources

  • Industry journals and periodicals
  • Government data
  • Financial reports of key industry players
  • Historical data
  • Press releases

DATA ANALYSIS

Data Synthesis

  • Collation of data
  • Estimation of key figures
  • Analysis of derived insights

Data Validation

  • Triangulation with data models
  • Reference against proprietary databases
  • Corroboration with industry experts

REPORT WRITING

Qualitative

  • Market drivers
  • Market challenges
  • Market trends
  • Five forces analysis

Quantitative

  • Market size and forecast
  • Market segmentation
  • Geographical insights
  • Competitive landscape

Interested in this report?

Get your sample now to see our research methodology and insights!

Download Now

Frequently Asked Questions

Gold Nanorods market growth will increase by USD 281.1 million during 2026-2030.

The Gold Nanorods market is expected to grow at a CAGR of 10% during 2026-2030.

Gold Nanorods market is segmented by Application (Medical, Diagnostics, Electronics, Others) End-user (Pharmaceutical and biotechnology, Academia and research institutes, Electronics and renewable energy) Measurement (20-30 nm, 10-20 nm, 50-100 nm, Others)

American Elements Inc., BBI Solutions OEM Ltd., CD Bioparticles, Cytodiagnostics Inc., nanoComposix, Nanocs Inc., NanoHybrids Inc., Nanopartz Inc., Sigma Aldrich Chemicals Ltd., Strem Chemicals Inc. are a few of the key vendors in the Gold Nanorods market.

North America will register the highest growth rate of 40.4% among the other regions. Therefore, the Gold Nanorods market in North America is expected to garner significant business opportunities for the vendors during the forecast period.

US, Canada, Mexico, Germany, UK, France, Italy, Spain, The Netherlands, China, Japan, South Korea, India, Australia, Indonesia, Saudi Arabia, UAE, Israel, South Africa, Egypt, Brazil, Argentina, Chile

  • Rising demand for gold nanorods from medical industry for cancer treatment is the driving factor this market.

The Gold Nanorods market vendors should focus on grabbing business opportunities from the Application segment as it accounted for the largest market share in the base year.