Goat Milk Market Analysis APAC, Europe, North America, South America, Middle East and Africa - US, China, India, France, Spain - Size and Forecast 2024-2028

Goat Milk Market Analysis APAC, Europe, North America, South America, Middle East and Africa - US, China, India, France, Spain - Size and Forecast 2024-2028

Published: Mar 2024 156 Pages SKU: IRTNTR72313

Market Overview at a Glance

$3.14 B
Market Opportunity
6.05%
CAGR
5.02
YoY growth 2023-2024(%)

Goat Milk Market Size 2024-2028 

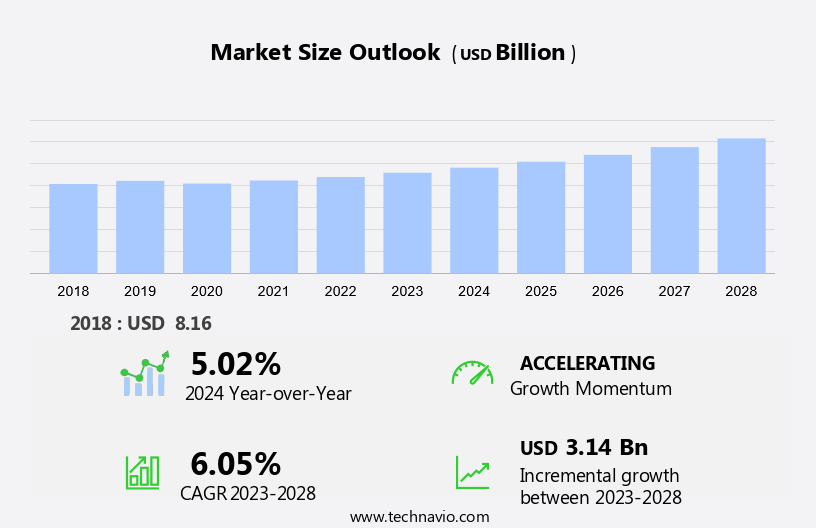
The goat milk market size is forecast to increase by USD 3.14 billion at a CAGR of 6.05% between 2023 and 2028.

  • The market is witnessing significant growth due to several key factors. One of the primary drivers is the increasing demand for lactose-free and lower lactose dairy products. Goat milk, being naturally lower in lactose compared to cow's milk, is gaining popularity among consumers with lactose intolerance or sensitivity. Another trend influencing the market is the rising preference for flavored goat milk, especially among children and health-conscious consumers. However, the market faces challenges from stringent government regulations in goat milk production. These regulations ensure the safety and quality of goat milk products but also increase production costs. Producers must comply with these regulations to maintain market credibility and consumer trust. Overall, the market is expected to continue its growth trajectory, driven by consumer preferences and regulatory requirements.

What will the size of the market be during the forecast period?

Goat Milk Market Size

 Request Free Sample

  • The dairy industry has witnessed a significant shift in consumer preferences towards healthier and more digestion-friendly alternatives. Goat dairy products have emerged as a viable solution for those with lactose intolerance, digestion problems, and allergies, offering a more natural and nutrient-dense choice compared to conventional dairy products. Goat dairy products, derived from goat's milk, have gained popularity among health-conscious consumers seeking alternatives to unhealthy lifestyles. These consumers appreciate the various health benefits associated with goat milk, including its high potassium, vitamin A, calcium, and protein content. The lactose intolerant population represents a substantial market segment for goat dairy products. Goat milk contains less lactose than cow's milk, making it an accessible choice for individuals who struggle with lactose intolerance. Moreover, goat milk is easier to digest due to its smaller fat globule size and shorter protein molecules.
  • The infant population is another market segment that benefits from goat milk. Goat milk formula is a popular alternative to cow's milk formula, providing essential nutrients for growing infants. Goat milk's nutrient profile, including its high protein, calcium, and magnesium content, makes it an excellent choice for supporting bone health in infants. Goat dairy products offer a range of benefits for health-conscious consumers. They contain fewer calories, fats, and proteins than their cow milk counterparts, making them a suitable choice for those looking to manage their caloric intake.

How is this market segmented and which is the largest segment?

The market research report provides comprehensive data (region-wise segment analysis), with forecasts and estimates in "USD billion" for the period 2024-2028, as well as historical data from 2018-2022 for the following segments.
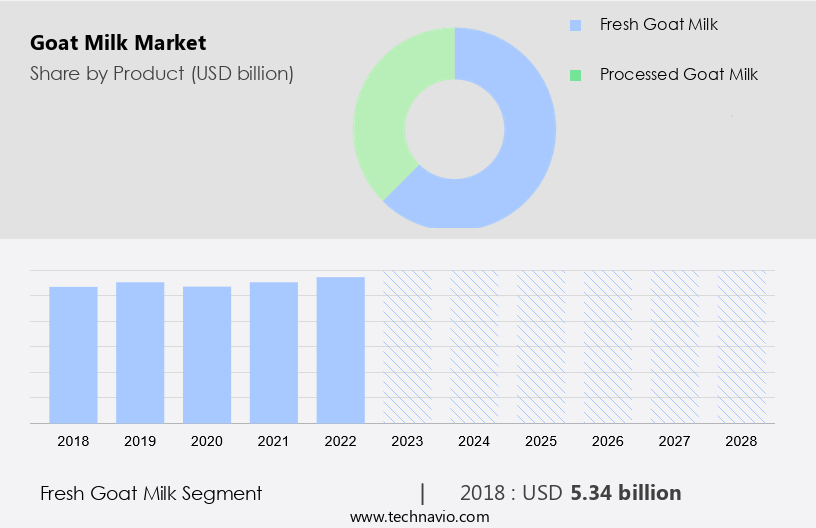
  • Product
    • Fresh goat milk
    • Processed goat milk
  • Distribution Channel
    • Offline
    • Online
  • Geography
    • APAC
      • China
      • India
    • Europe
      • France
      • Spain
    • North America
      • US
    • South America
    • Middle East and Africa

By Product Insights

  • The fresh goat milk segment is estimated to witness significant growth during the forecast period.

Goat milk, specifically fresh goat milk (FGM), is a natural and easily digestible dairy product. Unlike pasteurized and processed cow milk, FGM is unadulterated and rich in essential nutrients. The small size of goat milk's lactose molecules makes it an ideal alternative for individuals with lactose intolerance. FGM contains protein A2 casein, which is easier to digest than protein A1 casein found in cow milk. Approximately 7% of children in the United States experience cow milk allergies, often due to reactions to alpha S1 casein or whey proteins. Goat milk's similar pH level to human milk and lower lactose content make it a suitable substitute for those affected. Furthermore, goat milk boasts a rich nutritional profile. It contains high levels of proteins, calories, and healthy fats. Additionally, it is a natural source of essential minerals such as magnesium and phosphorus.

Further, the liquid milk segment of the market is expected to grow due to its increasing popularity as a healthier alternative to cow milk. The production of goat milk relies on goat feed and raw material prices. As such, the cost of goat feed and raw materials can impact the market's growth. However, the demand for goat milk products, including cheese, remains strong. In conclusion, fresh goat milk offers numerous health benefits and is a suitable alternative for individuals with lactose intolerance or cow milk allergies. Its nutrient-rich profile, including proteins, calories, healthy fats, magnesium, and phosphorus, makes it an attractive option for consumers seeking a healthier dairy choice. Despite the impact of raw material prices on production costs, the demand for goat milk and its products, particularly cheese, is expected to drive market growth in the United States and beyond.

Goat Milk Market Size

Get a glance at the market report of share of various segments Request Free Sample

The fresh goat milk segment was valued at USD 5.34 billion in 2018 and showed a gradual increase during the forecast period.

Regional Analysis

  • APAC is estimated to contribute 46% to the growth of the global market during the forecast period.

Technavio's analysts have elaborately explained the regional trends and drivers that shape the market during the forecast period.

Goat Milk Market Share by Geography

For more insights on the market share of various regions Request Free Sample

Goat milk production is predominantly concentrated in Asian countries like India, Pakistan, and Bangladesh. The market for goat milk and related products is experiencing significant growth, with companies focusing on enhancing production techniques and optimizing supply chains. Various enterprises have entered the market, offering a range of goat dairy products. Meredith Dairy Pty Ltd. (Australia), for instance, provides marinated goat cheese, fresh goat cheese, goat curd, natural pot set goat milk yogurt, and cultured goat milk. The increasing prevalence of lactose intolerance and digestion problems, coupled with allergies to cow's milk, has led to a rise in demand for goat milk alternatives.

Further, the health benefits of goat milk, such as its high potassium, vitamin A, and calcium content, contribute to its popularity. These nutrients play a crucial role in bone health and immunity. As consumers adopt unhealthy lifestyles, the need for nutrient-rich dairy alternatives is becoming increasingly important. Consequently, the market is expected to expand further during the forecast period. In conclusion, the market is poised for growth due to the rising demand for lactose-free and allergy-friendly dairy alternatives. Companies are focusing on improving production methods and supply chains to cater to this growing market. Goat milk's health benefits, including its high potassium, vitamin A, and calcium content, make it an attractive option for consumers seeking nutrient-rich dairy alternatives.

Market Dynamics

Our researchers analyzed the data with 2023 as the base year, along with the key drivers, trends, and challenges. A holistic analysis of drivers will help companies refine their marketing strategies to gain a competitive advantage.

What are the key market drivers leading to the rise in adoption of Goat Milk Market?

Rising demand for lactose-free and lower lactose products is the key driver of the market.

  • Goat milk is gaining popularity in the US dairy industry due to its benefits for individuals with digestion problems, such as lactose intolerance and allergies. Goat dairy products, including liquid goat milk, cheese, butter, ice cream, yogurt, and Chevre, offer critical nutrients like potassium, Vitamin A, calcium, and protein, which contribute to bone health and immunity. The dairy industry's production activities have been responding to this demand by increasing production capacities and expanding their offerings to include lactose-free and low-lactose goat milk and goat milk-based infant formulae and baby foods. Lactose intolerance, a condition that affects the ability to digest lactose, is prevalent among certain populations.
  • Symptoms include bloating, cramps, diarrhea, and nausea. With an increasing number of individuals experiencing these symptoms, the demand for dairy alternatives or products with reduced lactose content is on the rise. Goat milk, which naturally contains lower lactose than cow milk, is a viable option. Goat milk's benefits extend beyond lactose intolerance. It is also suitable for individuals with gluten-free diets and those seeking alternative sources of essential nutrients. Goat milk-based soaps, creams, lotions, and flavored milk are also gaining traction in the market. Grocery stores, supermarkets, hypermarkets, specialty stores, convenience stores, and online retailers stock a wide range of goat milk and goat dairy products.

What are the market trends shaping the Goat Milk Market?

Increasing demand for flavored goat milk is the upcoming trend in the market.

  • Goat milk has gained popularity in the US market due to its benefits for individuals with lactose intolerance, digestion problems, and allergies. Goat dairy products are rich in critical nutrients like potassium, Vitamin A, calcium, and proteins, contributing to bone health and immunity. The dairy industry's production activities have increased to meet the growing demand for goat milk and its derivatives, such as powdered milk, infant formulae, and baby foods. Goat milk's nutritional profile makes it an attractive alternative for those following unhealthy lifestyles seeking healthier options. Goat milk is naturally gluten-free and contains A2 casein and beta-casein, which are easier to digest than the A1 protein found in cow's milk.
  • Consumers can find goat milk and its related foodstuffs in various retail outlets, including grocery stores, hypermarkets, specialty stores, convenience stores, and online retailers. Brands like Hochdorf, Bimbosan, and Delamere Dairy offer a range of goat milk products, including liquid milk, cheese, butter, ice cream, yogurt, and chevre. The liquid milk segment dominates the market, with cheese being a close second. Goat milk's versatility extends beyond dairy products, with applications in soaps, creams, lotions, and infant formulae. Goat milk's production capacities have increased to cater to the growing infant population's demand for goat milk-based products. Raw material prices and goat feed costs have also risen due to the increased demand for goat milk.

What challenges does Goat Milk Market face during the growth?

Stringent government regulations in goat milk production is a key challenge affecting the market growth.

  • The market in the US is driven by the growing demand for dairy products that cater to specific dietary needs, such as lactose intolerance and allergies. Goat dairy products, including liquid goat milk, cheese, butter, ice cream, yogurt, and infant formulae, offer critical nutrients like calcium, potassium, vitamin A, and immunity-boosting proteins. These nutrients are essential for bone health, making goat milk an attractive alternative for consumers seeking healthier options. However, the production of goat milk and goat dairy products involves several challenges. Strict government regulations can hinder market growth by imposing entry barriers, raising production costs, and restricting market access.
  • The market for goat milk is expanding, with major players like Hochdorf, Bimbosan, Delamere Dairy, and Courtyard Farms producing a range of goat milk products, including flavored milk, powdered milk, and infant formula. While regulatory requirements and production challenges can impact market growth, the demand for goat milk and goat dairy products continues to increase, offering opportunities for producers and processors to meet consumer needs and expand their offerings.

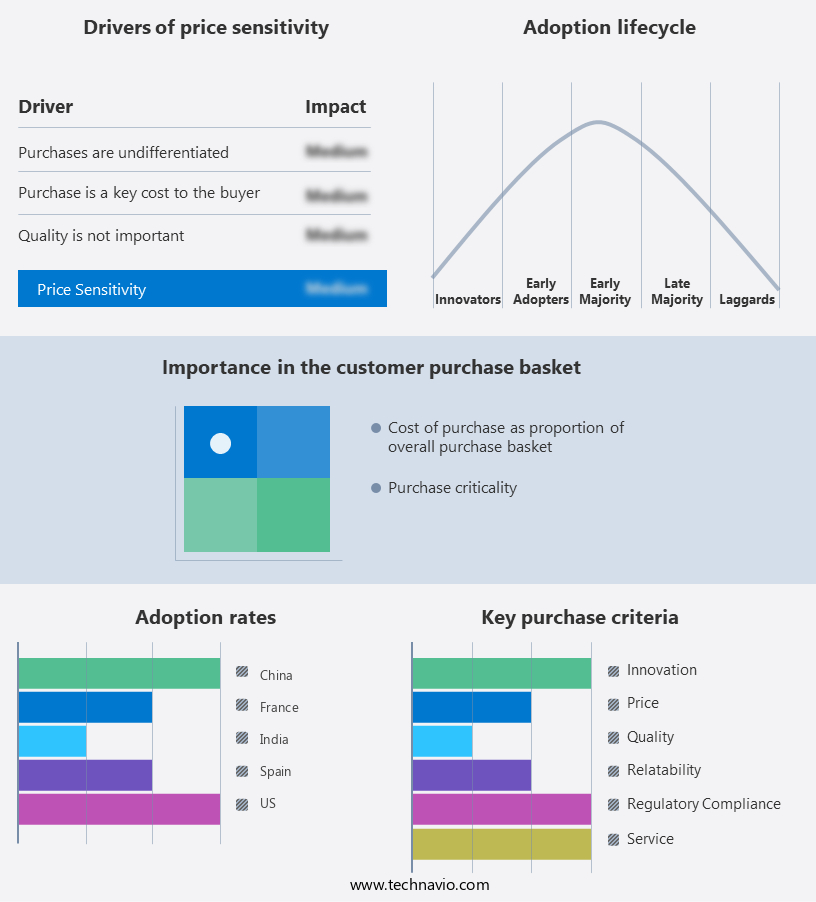
Exclusive Customer Landscape

The market forecasting report includes the adoption lifecycle of the market, covering from the innovator's stage to the laggard's stage. It focuses on adoption rates in different regions based on penetration. Furthermore, the market report also includes key purchase criteria and drivers of price sensitivity to help companies evaluate and develop their market growth analysis strategies.

Goat Milk Market Share by Geography

 Customer Landscape

Key Companies & Market Insights

Companies are implementing various strategies, such as strategic alliances, market forecast, partnerships, mergers and acquisitions, geographical expansion, and product/service launches, to enhance their presence in the market.

The market research and growth report includes detailed analyses of the competitive landscape of the market and information about key companies, including:

  • Bubs Australia Limited
  • Dairy Goat Co-operative N.Z. Limited
  • Delamere Dairy Ltd.
  • Emmi Group
  • Gujarat Cooperative Milk Marketing Federation Ltd.
  • Hay Dairies Pte Ltd
  • Ice House Farm
  • Karnataka Milk Federation
  • Meredith Dairy Pty Ltd.
  • Meyenberg Goat Milk Products
  • Mother Dairy Fruit and Vegetable Pvt. Ltd.
  • Oak Knoll Dairy
  • Redwood Hill Farm and Creamery Inc.
  • Saputo Inc.
  • St. Helens Farm Ltd.
  • St. John Creamery
  • Summerhill Goat Dairy
  • Unica Global BV
  • Xian Baiyue Goat Milk Group Co. Ltd

Qualitative and quantitative analysis of companies has been conducted to help clients understand the wider business environment as well as the strengths and weaknesses of key market players. Data is qualitatively analyzed to categorize companies as pure play, category-focused, industry-focused, and diversified; it is quantitatively analyzed to categorize companies as dominant, leading, strong, tentative, and weak.

Research Analyst Overview

The market is witnessing significant growth due to the increasing health consciousness among consumers and the rising prevalence of lactose intolerance, digestion problems, and allergies. Goat dairy products, including liquid milk, cheese, butter, ice cream, yogurt, and infant formulae, are gaining popularity due to their unique nutritional properties. Goat milk, in particular, is rich in critical nutrients such as potassium, vitamin A, calcium, and bone health-promoting minerals like copper and iron. These nutrients make goat milk an ideal choice for individuals with lactose intolerance or those seeking to maintain a healthy lifestyle. The dairy industry's production activities are influenced by several factors, including the demand for dairy and raw material prices. Goat feed prices have been on the rise due to increased demand, leading to higher production costs for goat milk and dairy products. Infant population growth and the increasing trend of goat milk usage in infant formulae and baby foods are significant market drivers.

Moreover, goat milk is also used in various non-dairy applications, such as soaps, creams, lotions, and flavored milk. These products cater to consumers with specific dietary requirements, such as gluten-free or lactose-intolerant individuals. The market's growth is influenced by several market dynamics, including consumer preferences, production capacities, and competition from other dairy products. The market's growth is expected to be driven by factors such as changing consumer preferences, increasing health consciousness, and the rising prevalence of lactose intolerance and digestion problems. In conclusion, the goat dairy products market is experiencing significant growth due to the increasing demand for lactose-free and nutrient-rich dairy alternatives. Goat milk, in particular, is gaining popularity due to its unique nutritional properties and the growing awareness of its health benefits. The market's future outlook is promising, with increasing demand from various end-users and the growing trend of goat milk usage in various applications.

Market Scope

Report Coverage

Details

Page number

156

Base year

2023

Historic period

2018-2022

Forecast period

2024-2028

Growth momentum & CAGR

Accelerate at a CAGR of 6.05%

Market growth 2024-2028

USD 3.14 billion

Market structure

Fragmented

YoY growth 2023-2024(%)

5.02

Key countries

US, China, India, France, and Spain

Competitive landscape

Leading Companies, Market Positioning of Companies, Competitive Strategies, and Industry Risks

Request Free Sample

What are the Key Data Covered in this Market Research and Growth Report?

  • CAGR of the market during the forecast period
  • Detailed information on factors that will drive the market growth and forecasting between 2024 and 2028
  • Precise estimation of the size of the market  and its contribution of the market in focus to the parent market
  • Accurate predictions about upcoming market growth and trends and changes in consumer behaviour
  • Growth of the market across APAC, Europe, North America, South America, and Middle East and Africa
  • Thorough analysis of the market's competitive landscape and detailed information about companies
  • Comprehensive analysis of factors that will challenge the growth of market companies

We can help! Our analysts can customize this market research report to meet your requirements. Get in touch

1 Executive Summary

  • 1.1 Market overview
    • Exhibit 01: Executive Summary – Chart on Market Overview
    • Exhibit 02: Executive Summary – Data Table on Market Overview
    • Exhibit 03: Executive Summary – Chart on Global Market Characteristics
    • Exhibit 04: Executive Summary – Chart on Market by Geography
    • Exhibit 05: Executive Summary – Chart on Market Segmentation by Product
    • Exhibit 06: Executive Summary – Chart on Market Segmentation by Distribution Channel
    • Exhibit 07: Executive Summary – Chart on Incremental Growth
    • Exhibit 08: Executive Summary – Data Table on Incremental Growth
    • Exhibit 09: Executive Summary – Chart on Vendor Market Positioning

2 Market Landscape

  • 2.1 Market ecosystem
    • Exhibit 10: Parent market
    • Exhibit 11: Market Characteristics

3 Market Sizing

  • 3.1 Market definition
    • Exhibit 12: Offerings of vendors included in the market definition
  • 3.2 Market segment analysis
    • Exhibit 13: Market segments
  • 3.3 Market size 2023
    • 3.4 Market outlook: Forecast for 2023-2028
      • Exhibit 14: Chart on Global - Market size and forecast 2023-2028 ($ billion)
      • Exhibit 15: Data Table on Global - Market size and forecast 2023-2028 ($ billion)
      • Exhibit 16: Chart on Global Market: Year-over-year growth 2023-2028 (%)
      • Exhibit 17: Data Table on Global Market: Year-over-year growth 2023-2028 (%)

    4 Historic Market Size

    • 4.1 Global goat milk market 2018 - 2022
      • Exhibit 18: Historic Market Size – Data Table on global goat milk market 2018 - 2022 ($ billion)
    • 4.2 Product Segment Analysis 2018 - 2022
      • Exhibit 19: Historic Market Size – Product Segment 2018 - 2022 ($ billion)
    • 4.3 Distribution Channel Segment Analysis 2018 - 2022
      • Exhibit 20: Historic Market Size – Distribution Channel Segment 2018 - 2022 ($ billion)
    • 4.4 Geography Segment Analysis 2018 - 2022
      • Exhibit 21: Historic Market Size – Geography Segment 2018 - 2022 ($ billion)
    • 4.5 Country Segment Analysis 2018 - 2022
      • Exhibit 22: Historic Market Size – Country Segment 2018 - 2022 ($ billion)

    5 Five Forces Analysis

    • 5.1 Five forces summary
      • Exhibit 23: Five forces analysis - Comparison between 2023 and 2028
    • 5.2 Bargaining power of buyers
      • Exhibit 24: Chart on Bargaining power of buyers – Impact of key factors 2023 and 2028
    • 5.3 Bargaining power of suppliers
      • Exhibit 25: Bargaining power of suppliers – Impact of key factors in 2023 and 2028
    • 5.4 Threat of new entrants
      • Exhibit 26: Threat of new entrants – Impact of key factors in 2023 and 2028
    • 5.5 Threat of substitutes
      • Exhibit 27: Threat of substitutes – Impact of key factors in 2023 and 2028
    • 5.6 Threat of rivalry
      • Exhibit 28: Threat of rivalry – Impact of key factors in 2023 and 2028
    • 5.7 Market condition
      • Exhibit 29: Chart on Market condition - Five forces 2023 and 2028

    6 Market Segmentation by Product

    • 6.1 Market segments
      • Exhibit 30: Chart on Product - Market share 2023-2028 (%)
      • Exhibit 31: Data Table on Product - Market share 2023-2028 (%)
    • 6.2 Comparison by Product
      • Exhibit 32: Chart on Comparison by Product
      • Exhibit 33: Data Table on Comparison by Product
    • 6.3 Fresh goat milk - Market size and forecast 2023-2028
      • Exhibit 34: Chart on Fresh goat milk - Market size and forecast 2023-2028 ($ billion)
      • Exhibit 35: Data Table on Fresh goat milk - Market size and forecast 2023-2028 ($ billion)
      • Exhibit 36: Chart on Fresh goat milk - Year-over-year growth 2023-2028 (%)
      • Exhibit 37: Data Table on Fresh goat milk - Year-over-year growth 2023-2028 (%)
    • 6.4 Processed goat milk - Market size and forecast 2023-2028
      • Exhibit 38: Chart on Processed goat milk - Market size and forecast 2023-2028 ($ billion)
      • Exhibit 39: Data Table on Processed goat milk - Market size and forecast 2023-2028 ($ billion)
      • Exhibit 40: Chart on Processed goat milk - Year-over-year growth 2023-2028 (%)
      • Exhibit 41: Data Table on Processed goat milk - Year-over-year growth 2023-2028 (%)
    • 6.5 Market opportunity by Product
      • Exhibit 42: Market opportunity by Product ($ billion)
      • Exhibit 43: Data Table on Market opportunity by Product ($ billion)

    7 Market Segmentation by Distribution Channel

    • 7.1 Market segments
      • Exhibit 44: Chart on Distribution Channel - Market share 2023-2028 (%)
      • Exhibit 45: Data Table on Distribution Channel - Market share 2023-2028 (%)
    • 7.2 Comparison by Distribution Channel
      • Exhibit 46: Chart on Comparison by Distribution Channel
      • Exhibit 47: Data Table on Comparison by Distribution Channel
    • 7.3 Offline - Market size and forecast 2023-2028
      • Exhibit 48: Chart on Offline - Market size and forecast 2023-2028 ($ billion)
      • Exhibit 49: Data Table on Offline - Market size and forecast 2023-2028 ($ billion)
      • Exhibit 50: Chart on Offline - Year-over-year growth 2023-2028 (%)
      • Exhibit 51: Data Table on Offline - Year-over-year growth 2023-2028 (%)
    • 7.4 Online - Market size and forecast 2023-2028
      • Exhibit 52: Chart on Online - Market size and forecast 2023-2028 ($ billion)
      • Exhibit 53: Data Table on Online - Market size and forecast 2023-2028 ($ billion)
      • Exhibit 54: Chart on Online - Year-over-year growth 2023-2028 (%)
      • Exhibit 55: Data Table on Online - Year-over-year growth 2023-2028 (%)
    • 7.5 Market opportunity by Distribution Channel
      • Exhibit 56: Market opportunity by Distribution Channel ($ billion)
      • Exhibit 57: Data Table on Market opportunity by Distribution Channel ($ billion)

    8 Customer Landscape

    • 8.1 Customer landscape overview
      • Exhibit 58: Analysis of price sensitivity, lifecycle, customer purchase basket, adoption rates, and purchase criteria

    9 Geographic Landscape

    • 9.1 Geographic segmentation
      • Exhibit 59: Chart on Market share by geography 2023-2028 (%)
      • Exhibit 60: Data Table on Market share by geography 2023-2028 (%)
    • 9.2 Geographic comparison
      • Exhibit 61: Chart on Geographic comparison
      • Exhibit 62: Data Table on Geographic comparison
    • 9.3 APAC - Market size and forecast 2023-2028
      • Exhibit 63: Chart on APAC - Market size and forecast 2023-2028 ($ billion)
      • Exhibit 64: Data Table on APAC - Market size and forecast 2023-2028 ($ billion)
      • Exhibit 65: Chart on APAC - Year-over-year growth 2023-2028 (%)
      • Exhibit 66: Data Table on APAC - Year-over-year growth 2023-2028 (%)
    • 9.4 Europe - Market size and forecast 2023-2028
      • Exhibit 67: Chart on Europe - Market size and forecast 2023-2028 ($ billion)
      • Exhibit 68: Data Table on Europe - Market size and forecast 2023-2028 ($ billion)
      • Exhibit 69: Chart on Europe - Year-over-year growth 2023-2028 (%)
      • Exhibit 70: Data Table on Europe - Year-over-year growth 2023-2028 (%)
    • 9.5 North America - Market size and forecast 2023-2028
      • Exhibit 71: Chart on North America - Market size and forecast 2023-2028 ($ billion)
      • Exhibit 72: Data Table on North America - Market size and forecast 2023-2028 ($ billion)
      • Exhibit 73: Chart on North America - Year-over-year growth 2023-2028 (%)
      • Exhibit 74: Data Table on North America - Year-over-year growth 2023-2028 (%)
    • 9.6 South America - Market size and forecast 2023-2028
      • Exhibit 75: Chart on South America - Market size and forecast 2023-2028 ($ billion)
      • Exhibit 76: Data Table on South America - Market size and forecast 2023-2028 ($ billion)
      • Exhibit 77: Chart on South America - Year-over-year growth 2023-2028 (%)
      • Exhibit 78: Data Table on South America - Year-over-year growth 2023-2028 (%)
    • 9.7 Middle East and Africa - Market size and forecast 2023-2028
      • Exhibit 79: Chart on Middle East and Africa - Market size and forecast 2023-2028 ($ billion)
      • Exhibit 80: Data Table on Middle East and Africa - Market size and forecast 2023-2028 ($ billion)
      • Exhibit 81: Chart on Middle East and Africa - Year-over-year growth 2023-2028 (%)
      • Exhibit 82: Data Table on Middle East and Africa - Year-over-year growth 2023-2028 (%)
    • 9.8 China - Market size and forecast 2023-2028
      • Exhibit 83: Chart on China - Market size and forecast 2023-2028 ($ billion)
      • Exhibit 84: Data Table on China - Market size and forecast 2023-2028 ($ billion)
      • Exhibit 85: Chart on China - Year-over-year growth 2023-2028 (%)
      • Exhibit 86: Data Table on China - Year-over-year growth 2023-2028 (%)
    • 9.9 India - Market size and forecast 2023-2028
      • Exhibit 87: Chart on India - Market size and forecast 2023-2028 ($ billion)
      • Exhibit 88: Data Table on India - Market size and forecast 2023-2028 ($ billion)
      • Exhibit 89: Chart on India - Year-over-year growth 2023-2028 (%)
      • Exhibit 90: Data Table on India - Year-over-year growth 2023-2028 (%)
    • 9.10 US - Market size and forecast 2023-2028
      • Exhibit 91: Chart on US - Market size and forecast 2023-2028 ($ billion)
      • Exhibit 92: Data Table on US - Market size and forecast 2023-2028 ($ billion)
      • Exhibit 93: Chart on US - Year-over-year growth 2023-2028 (%)
      • Exhibit 94: Data Table on US - Year-over-year growth 2023-2028 (%)
    • 9.11 France - Market size and forecast 2023-2028
      • Exhibit 95: Chart on France - Market size and forecast 2023-2028 ($ billion)
      • Exhibit 96: Data Table on France - Market size and forecast 2023-2028 ($ billion)
      • Exhibit 97: Chart on France - Year-over-year growth 2023-2028 (%)
      • Exhibit 98: Data Table on France - Year-over-year growth 2023-2028 (%)
    • 9.12 Spain - Market size and forecast 2023-2028
      • Exhibit 99: Chart on Spain - Market size and forecast 2023-2028 ($ billion)
      • Exhibit 100: Data Table on Spain - Market size and forecast 2023-2028 ($ billion)
      • Exhibit 101: Chart on Spain - Year-over-year growth 2023-2028 (%)
      • Exhibit 102: Data Table on Spain - Year-over-year growth 2023-2028 (%)
    • 9.13 Market opportunity by geography
      • Exhibit 103: Market opportunity by geography ($ billion)
      • Exhibit 104: Data Tables on Market opportunity by geography ($ billion)

    10 Drivers, Challenges, and Trends

    • 10.1 Market drivers
      • 10.2 Market challenges
        • 10.3 Impact of drivers and challenges
          • Exhibit 105: Impact of drivers and challenges in 2023 and 2028
        • 10.4 Market trends

          11 Vendor Landscape

          • 11.1 Overview
            • 11.2 Vendor landscape
              • Exhibit 106: Overview on Criticality of inputs and Factors of differentiation
            • 11.3 Landscape disruption
              • Exhibit 107: Overview on factors of disruption
            • 11.4 Industry risks
              • Exhibit 108: Impact of key risks on business

            12 Vendor Analysis

            • 12.1 Vendors covered
              • Exhibit 109: Vendors covered
            • 12.2 Market positioning of vendors
              • Exhibit 110: Matrix on vendor position and classification
            • 12.3 Bubs Australia Limited
              • Exhibit 111: Bubs Australia Limited - Overview
              • Exhibit 112: Bubs Australia Limited - Business segments
              • Exhibit 113: Bubs Australia Limited - Key offerings
              • Exhibit 114: Bubs Australia Limited - Segment focus
            • 12.4 Dairy Goat Co-operative N.Z. Limited
              • Exhibit 115: Dairy Goat Co-operative N.Z. Limited - Overview
              • Exhibit 116: Dairy Goat Co-operative N.Z. Limited - Product / Service
              • Exhibit 117: Dairy Goat Co-operative N.Z. Limited - Key offerings
            • 12.5 Delamere Dairy Ltd.
              • Exhibit 118: Delamere Dairy Ltd. - Overview
              • Exhibit 119: Delamere Dairy Ltd. - Product / Service
              • Exhibit 120: Delamere Dairy Ltd. - Key offerings
            • 12.6 Emmi Group
              • Exhibit 121: Emmi Group - Overview
              • Exhibit 122: Emmi Group - Business segments
              • Exhibit 123: Emmi Group - Key offerings
              • Exhibit 124: Emmi Group - Segment focus
            • 12.7 Hay Dairies Pte Ltd
              • Exhibit 125: Hay Dairies Pte Ltd - Overview
              • Exhibit 126: Hay Dairies Pte Ltd - Product / Service
              • Exhibit 127: Hay Dairies Pte Ltd - Key offerings
            • 12.8 Ice House Farm
              • Exhibit 128: Ice House Farm - Overview
              • Exhibit 129: Ice House Farm - Product / Service
              • Exhibit 130: Ice House Farm - Key offerings
            • 12.9 Meredith Dairy Pty Ltd.
              • Exhibit 131: Meredith Dairy Pty Ltd. - Overview
              • Exhibit 132: Meredith Dairy Pty Ltd. - Product / Service
              • Exhibit 133: Meredith Dairy Pty Ltd. - Key offerings
            • 12.10 Meyenberg Goat Milk Products
              • Exhibit 134: Meyenberg Goat Milk Products - Overview
              • Exhibit 135: Meyenberg Goat Milk Products - Product / Service
              • Exhibit 136: Meyenberg Goat Milk Products - Key offerings
            • 12.11 Oak Knoll Dairy
              • Exhibit 137: Oak Knoll Dairy - Overview
              • Exhibit 138: Oak Knoll Dairy - Product / Service
              • Exhibit 139: Oak Knoll Dairy - Key offerings
            • 12.12 Redwood Hill Farm and Creamery Inc.
              • Exhibit 140: Redwood Hill Farm and Creamery Inc. - Overview
              • Exhibit 141: Redwood Hill Farm and Creamery Inc. - Product / Service
              • Exhibit 142: Redwood Hill Farm and Creamery Inc. - Key offerings
            • 12.13 St. Helens Farm Ltd.
              • Exhibit 143: St. Helens Farm Ltd. - Overview
              • Exhibit 144: St. Helens Farm Ltd. - Product / Service
              • Exhibit 145: St. Helens Farm Ltd. - Key offerings
            • 12.14 St. John Creamery
              • Exhibit 146: St. John Creamery - Overview
              • Exhibit 147: St. John Creamery - Product / Service
              • Exhibit 148: St. John Creamery - Key offerings
            • 12.15 Summerhill Goat Dairy
              • Exhibit 149: Summerhill Goat Dairy - Overview
              • Exhibit 150: Summerhill Goat Dairy - Product / Service
              • Exhibit 151: Summerhill Goat Dairy - Key offerings
            • 12.16 Unica Global BV
              • Exhibit 152: Unica Global BV - Overview
              • Exhibit 153: Unica Global BV - Product / Service
              • Exhibit 154: Unica Global BV - Key offerings
            • 12.17 Xian Baiyue Goat Milk Group Co. Ltd
              • Exhibit 155: Xian Baiyue Goat Milk Group Co. Ltd - Overview
              • Exhibit 156: Xian Baiyue Goat Milk Group Co. Ltd - Product / Service
              • Exhibit 157: Xian Baiyue Goat Milk Group Co. Ltd - Key offerings

            13 Appendix

            • 13.1 Scope of the report
              • 13.2 Inclusions and exclusions checklist
                • Exhibit 158: Inclusions checklist
                • Exhibit 159: Exclusions checklist
              • 13.3 Currency conversion rates for US$
                • Exhibit 160: Currency conversion rates for US$
              • 13.4 Research methodology
                • Exhibit 161: Research methodology
                • Exhibit 162: Validation techniques employed for market sizing
                • Exhibit 163: Information sources
              • 13.5 List of abbreviations
                • Exhibit 164: List of abbreviations

              Research Methodology

              Technavio presents a detailed picture of the market by way of study, synthesis, and summation of data from multiple sources. The analysts have presented the various facets of the market with a particular focus on identifying the key industry influencers. The data thus presented is comprehensive, reliable, and the result of extensive research, both primary and secondary.

              INFORMATION SOURCES

              Primary sources

              • Manufacturers and suppliers
              • Channel partners
              • Industry experts
              • Strategic decision makers

              Secondary sources

              • Industry journals and periodicals
              • Government data
              • Financial reports of key industry players
              • Historical data
              • Press releases

              DATA ANALYSIS

              Data Synthesis

              • Collation of data
              • Estimation of key figures
              • Analysis of derived insights

              Data Validation

              • Triangulation with data models
              • Reference against proprietary databases
              • Corroboration with industry experts

              REPORT WRITING

              Qualitative

              • Market drivers
              • Market challenges
              • Market trends
              • Five forces analysis

              Quantitative

              • Market size and forecast
              • Market segmentation
              • Geographical insights
              • Competitive landscape

              Interested in this report?

              Get your sample now to see our research methodology and insights!

              Download Now

              Frequently Asked Questions

              Goat Milk market growth will increase by $ 3.14 bn during 2024-2028.

              The Goat Milk market is expected to grow at a CAGR of 6.05% during 2024-2028.

              Goat Milk market is segmented by Product( Fresh goat milk, Processed goat milk) Distribution Channel( Offline, Online, North America, MEA, South America)

              Bubs Australia Limited, Dairy Goat Co-operative N.Z. Limited, Delamere Dairy Ltd., Emmi Group, Gujarat Cooperative Milk Marketing Federation Ltd., Hay Dairies Pte Ltd, Ice House Farm, Karnataka Milk Federation, Meredith Dairy Pty Ltd., Meyenberg Goat Milk Products, Mother Dairy Fruit and Vegetable Pvt. Ltd., Oak Knoll Dairy, Redwood Hill Farm and Creamery Inc., Saputo Inc., St. Helens Farm Ltd., St. John Creamery, Summerhill Goat Dairy, Unica Global BV, Xian Baiyue Goat Milk Group Co. Ltd are a few of the key vendors in the Goat Milk market.

              APAC will register the highest growth rate of 46% among the other regions. Therefore, the Goat Milk market in APAC is expected to garner significant business opportunities for the vendors during the forecast period.

              US, China, India, France, Spain

              • Rising demand for lactose-free and lower lactose productsPeople with lactose intolerance are unable to digest lactose (a type of sugar found in milk and dairy products). Some symptoms of lactose intolerance are: BloatingCrampsDiarrheaNausea The number of individuals with lactose intolerance is increasing in European countries such as Italy is the driving factor this market.
              • Germany is the driving factor this market.
              • Spain is the driving factor this market.
              • Turkey is the driving factor this market.
              • Poland is the driving factor this market.
              • France is the driving factor this market.
              • the UK is the driving factor this market.
              • and others. Thus is the driving factor this market.
              • the demand for lactose-free products and products that have a low lactose content is increasing. Since goat milk contains lower lactose than cow milk is the driving factor this market.
              • it is a viable alternative to cow milk. Thus is the driving factor this market.
              • with an increase in the number of lactose-intolerant people is the driving factor this market.
              • the demand for lactose-free products or products with low lactose content will increase at a fast pace. Lactose intolerance is common in eastern and southeast Asia. Following infancy is the driving factor this market.
              • approximately 65 percent of the human population has a reduced ability to digest lactose. Lactase no persistence affects most people of East Asian descent is the driving factor this market.
              • accounting for 70 to 100 percent of the population. The market penetration of lactose-free products is relatively low due to the lack of awareness of the benefits associated with such products. However is the driving factor this market.
              • there has been increasing awareness among consumers about growth hormones and antibiotics found in goat-based milk processed by the dairy industry. As a result is the driving factor this market.
              • the demand for lactose-free dairy products such as goat milk is increasing. These factors will drive the growth of the global goat milk market during the forecast period. is the driving factor this market.

              The Goat Milk market vendors should focus on grabbing business opportunities from the Fresh goat milk segment as it accounted for the largest market share in the base year.