Glamping Market Analysis, Size, and Forecast 2026-2030: North America (US, Canada, and Mexico), Europe (UK, Germany, and France), APAC (Australia, China, and Japan), South America (Brazil and Argentina), Middle East and Africa (Saudi Arabia, UAE, and South Africa), and Rest of World (ROW)

Glamping Market Analysis, Size, and Forecast 2026-2030:
North America (US, Canada, and Mexico), Europe (UK, Germany, and France), APAC (Australia, China, and Japan), South America (Brazil and Argentina), Middle East and Africa (Saudi Arabia, UAE, and South Africa), and Rest of World (ROW)

Published: Mar 2026 294 Pages SKU: IRTNTR71140

Market Overview at a Glance

$3.21 B
Market Opportunity
13%
CAGR 2025 - 2030
51.1%
North America Growth
$1.25 B
Cabins and pods segment 2024

Glamping Market Size 2026-2030

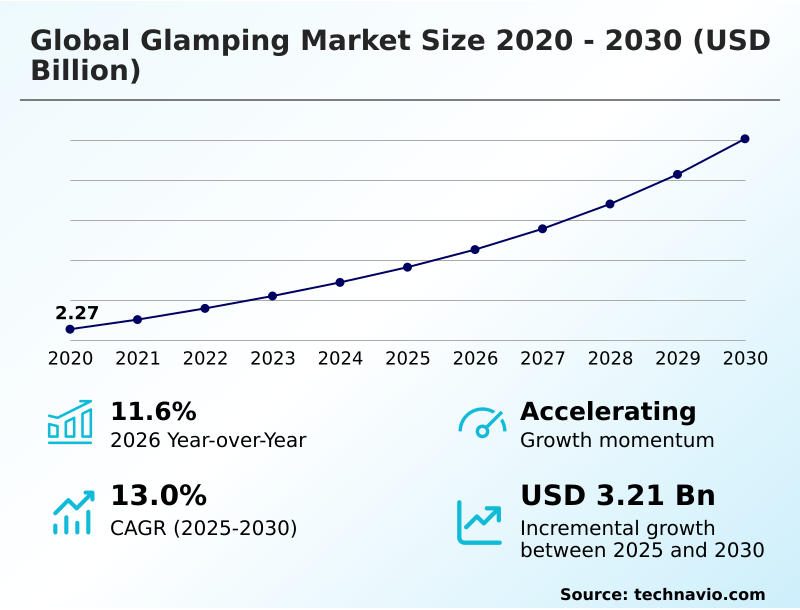
The glamping market size is valued to increase by USD 3.21 billion, at a CAGR of 13% from 2025 to 2030. Growing consumer preference for sustainable and eco-friendly tourism will drive the glamping market.

Major Market Trends & Insights

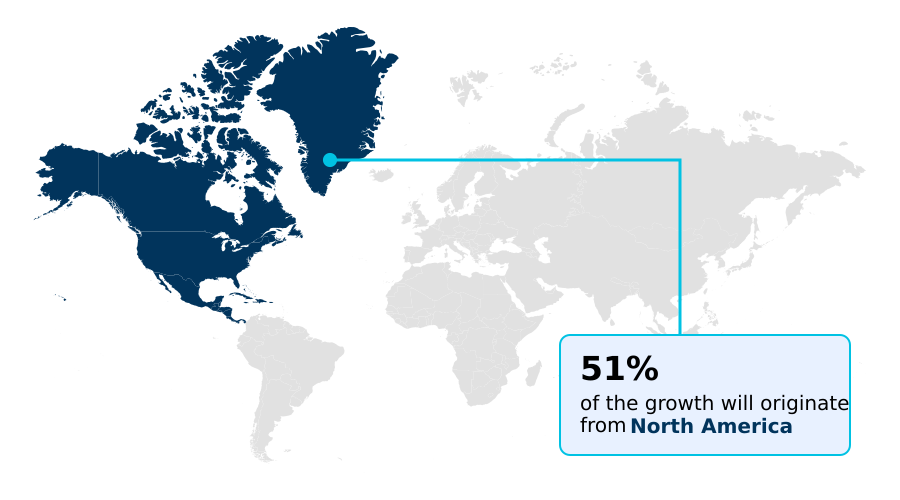
  • North America dominated the market and accounted for a 51.1% growth during the forecast period.
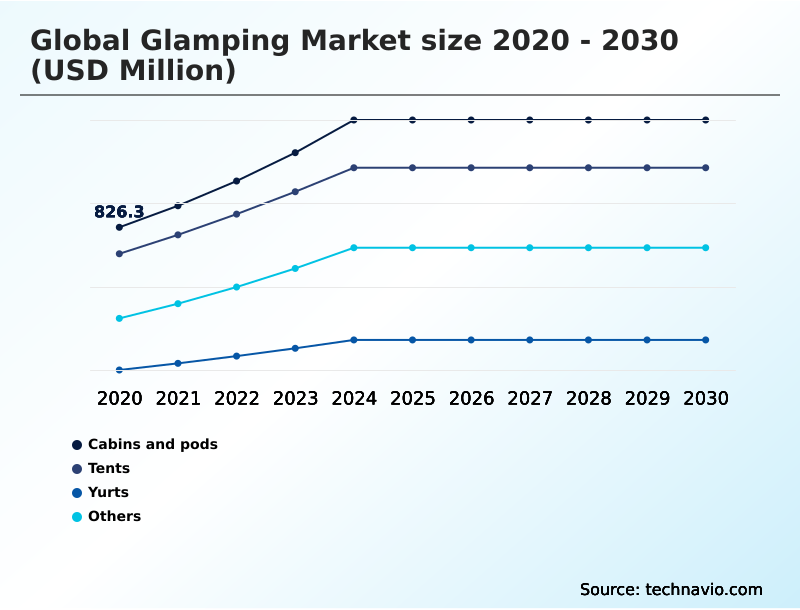
  • By Type - Cabins and pods segment was valued at USD 1.25 billion in 2024
  • By Channel - Online segment accounted for the largest market revenue share in 2024

Market Size & Forecast

  • Market Opportunities: USD 4.76 billion
  • Market Future Opportunities: USD 3.21 billion
  • CAGR from 2025 to 2030 : 13%

Market Summary

  • The glamping market is defined by the fusion of outdoor immersion with high-end amenities, addressing a core consumer desire for experiential luxury without the hardships of traditional camping. This sector offers unique accommodations, from safari tents and yurts to elaborate treehouses, fundamentally reshaping the outdoor hospitality landscape.
  • Key drivers include a strong consumer shift toward sustainable travel and nature-based tourism, along with the rise of the experience economy, where unique, shareable moments are prioritized over conventional hotel stays. However, operators face challenges with seasonality and complex land-use regulations.
  • As a business scenario, a provider of boutique outdoor hospitality might implement a dynamic pricing algorithm that adjusts rates for its off-grid hospitality network based on weather forecasts and local events, successfully increasing shoulder-season occupancy.
  • The industry's evolution is marked by a trend toward diversification, including adventure tourism and specialized eco-luxury retreats, making it a dynamic and growing segment of the broader leisure industry.

What will be the Size of the Glamping Market during the forecast period?

Get Key Insights on Market Forecast (PDF) Request Free Sample

How is the Glamping Market Segmented?

The glamping industry research report provides comprehensive data (region-wise segment analysis), with forecasts and estimates in "USD million" for the period 2026-2030, as well as historical data from 2020-2024 for the following segments.

  • Type
    • Cabins and pods
    • Tents
    • Yurts
    • Others
  • Channel
    • Online
    • Offline
  • Age group
    • 33 to 50 years
    • 18 to 32 years
    • 51 to 65 years
    • Above 65 years
  • Geography
    • North America
      • US
      • Canada
      • Mexico
    • Europe
      • UK
      • Germany
      • France
    • APAC
      • Australia
      • China
      • Japan
    • South America
      • Brazil
      • Argentina
    • Middle East and Africa
      • Saudi Arabia
      • UAE
      • South Africa
    • Rest of World (ROW)

By Type Insights

The cabins and pods segment is estimated to witness significant growth during the forecast period.

The cabins and pods segment represents a critical bridge between traditional hotels and outdoor experiences, offering robust, secure structures that ensure four-season adaptability.

This category includes diverse forms like eco-pods and geodesic domes, which appeal to consumers demanding comfort without sacrificing nature immersion.

The use of modular fabrication techniques is a key operational advantage, reducing on-site construction disruption by up to 40% and accelerating project timelines. As operators expand, the focus is on durable, low-impact accommodation that offers high returns.

Innovations such as thermal-glass igloos for winter viewing and retrofitted airstream hotels highlight the segment's versatility. These glamping pods are central to the strategy of glamping resorts aiming to provide unique accommodations with year-round revenue streams and sustainable lodging credentials.

Request Free Sample

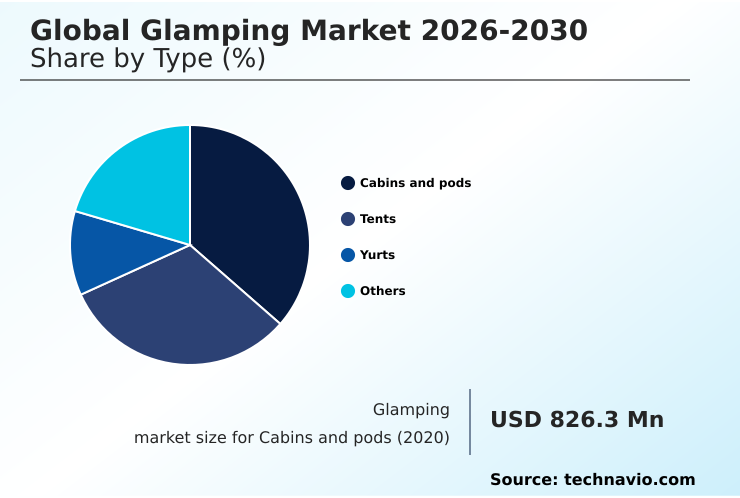
The Cabins and pods segment was valued at USD 1.25 billion in 2024 and showed a gradual increase during the forecast period.

Request Free Sample

Regional Analysis

North America is estimated to contribute 51.1% to the growth of the global market during the forecast period.Technavio’s analysts have elaborately explained the regional trends and drivers that shape the market during the forecast period.

See How Glamping Market Demand is Rising in North America Request Free Sample

The market's geographic landscape is diverse, with North America representing a mature market that accounts for 51.1% of incremental growth, while the APAC region is expanding at the fastest rate of 13.9%.

In Europe, agritourism is a key focus, integrating glamping with rural economies. The Middle East is pioneering large-scale desert glamping projects, and APAC showcases innovation in bamboo architecture.

In Africa and Australia, bush luxury and safari lodges define the high-end segment.

A significant trend is the development of digital nomad infrastructure, which enables remote work accommodations and has been shown to increase mid-week occupancy by over 25% in certain locations.

This adaptability allows operators to cater to distinct regional demands, from culinary glamping and eco-tourism in developed regions to pop-up glamping villages for corporate retreats and wellness retreats in emerging markets.

Market Dynamics

Our researchers analyzed the data with 2025 as the base year, along with the key drivers, trends, and challenges. A holistic analysis of drivers will help companies refine their marketing strategies to gain a competitive advantage.

  • The modern traveler increasingly seeks personalized and immersive experiences, fueling demand for luxury glamping with private hot tubs and all-inclusive glamping resorts for families. The strategic placement of glamping sites near national parks remains a cornerstone of the industry, offering unparalleled access to nature.
  • For entrepreneurs, a solid glamping business plan for landowners is essential for navigating zoning laws and securing financing. The selection of the best glamping structures for high winds and other climate challenges is critical for operational continuity and guest safety.
  • As the market matures, niche offerings are gaining traction, including astrotourism glamping in dark sky parks and culinary glamping farm-to-table experience concepts. The rise of the remote workforce has made digital nomad glamping with high-speed internet a highly profitable segment.
  • Simultaneously, the corporate world is embracing corporate retreat glamping packages, while the wellness sector drives demand for wellness retreat glamping with yoga. Entrepreneurs exploring this space must weigh the cost of building a luxury safari tent against other structures and consider specialized models like how to start a pop-up glamping business.
  • A key factor for long-term viability is resource management; operators that invest in off-grid glamping power and water solutions report operational cost savings nearly double those who rely on extending traditional utilities to remote sites.
  • This focus on sustainability is evident in the growth of unique treehouse glamping getaways, regenerative tourism glamping projects, and Airstream glamping resorts in the US, differentiating them in a market where glamping vs traditional camping pros and cons are carefully weighed by consumers.

What are the key market drivers leading to the rise in the adoption of Glamping Industry?

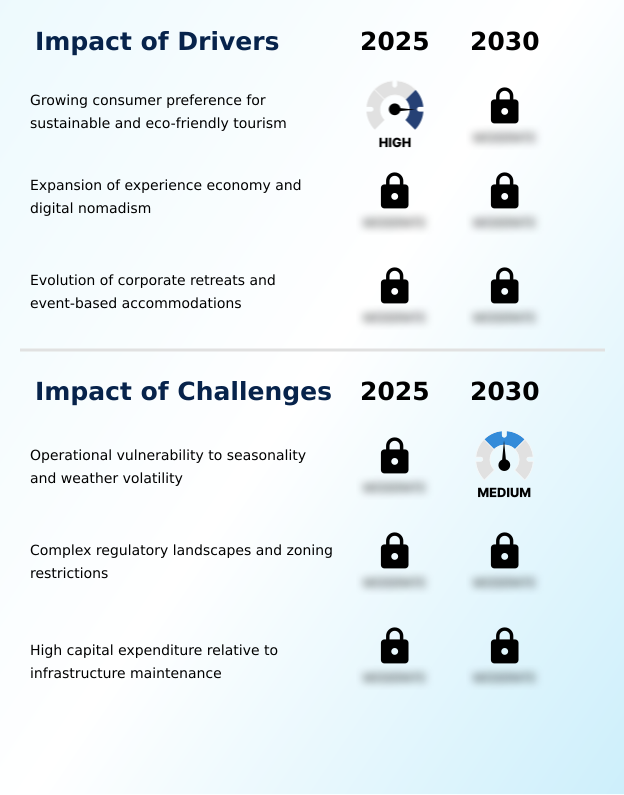
  • A growing consumer preference for sustainable and eco-friendly tourism is a key driver for market expansion.

  • Market expansion is primarily driven by strong consumer demand for sustainable travel and unique, nature-based tourism experiences. This trend favors low-impact accommodation models over traditional hotels, with properties featuring certified composting waste systems noting higher booking conversion rates.
  • The convergence of the experience economy and remote work has created a powerful new driver, positioning boutique outdoor hospitality providers to cater to digital nomads.
  • Furthermore, the corporate sector's growing preference for immersive corporate retreats in natural settings has opened a high-value segment, with corporate packages yielding up to 40% higher revenue per guest.
  • The events industry also leverages this trend, using pop-up glamping villages for festivals, which can increase an organizer's total profit by 15% by upgrading the attendee experience.
  • This diversification transforms outdoor hospitality from a simple leisure activity into a versatile solution for work, events, and eco-luxury retreats.

What are the market trends shaping the Glamping Industry?

  • A key market trend is the convergence of eco-luxury and regenerative tourism. This evolution moves beyond sustainability to practices that actively improve local ecosystems.

  • Key market trends are moving beyond basic sustainability toward regenerative tourism, where operators actively enhance local ecosystems. This evolution is driven by consumer demand for experiential luxury with a positive impact. Investment is flowing into technologies enabling this shift, such as advanced satellite internet solutions that support 'work from nature' models and can boost off-season revenue by over 30%.
  • Accommodation offerings are diversifying into thematic experiences like culinary glamping and astrotourism in dark sky parks. These niche offerings command premium pricing, often 25% higher than standard stays. Structural innovation is also critical, with thermal-glass igloos and insulated yurts enabling year-round operation in colder climates, transforming seasonal businesses into full-time operations.
  • This convergence of eco-consciousness, technology, and unique experiences, seen in everything from treehouse hotels to Airstream hotels, is redefining regenerative travel and wellness retreats.

What challenges does the Glamping Industry face during its growth?

  • Operational vulnerability to seasonality and weather volatility presents a key challenge affecting industry growth.

  • A primary challenge is the market's vulnerability to seasonality, which can reduce potential operating days by over 50% in certain climates, severely impacting the return on high capex investments in structures like treehouses. Navigating complex zoning laws for sustainable lodging presents another significant hurdle, often delaying project timelines by 12-18 months.
  • The high initial investment for luxury glamping resorts, especially for providing utilities in off-grid stays, remains a barrier. Maintenance costs for specialized structures such as geodesic domes and eco-pods are considerable, further pressuring operational budgets.
  • Achieving true four-season adaptability in glamping pods without incurring unsustainable energy costs is a persistent operational challenge, hindering the ability to cater to year-round adventure tourism and consistent yurt camping experiences.

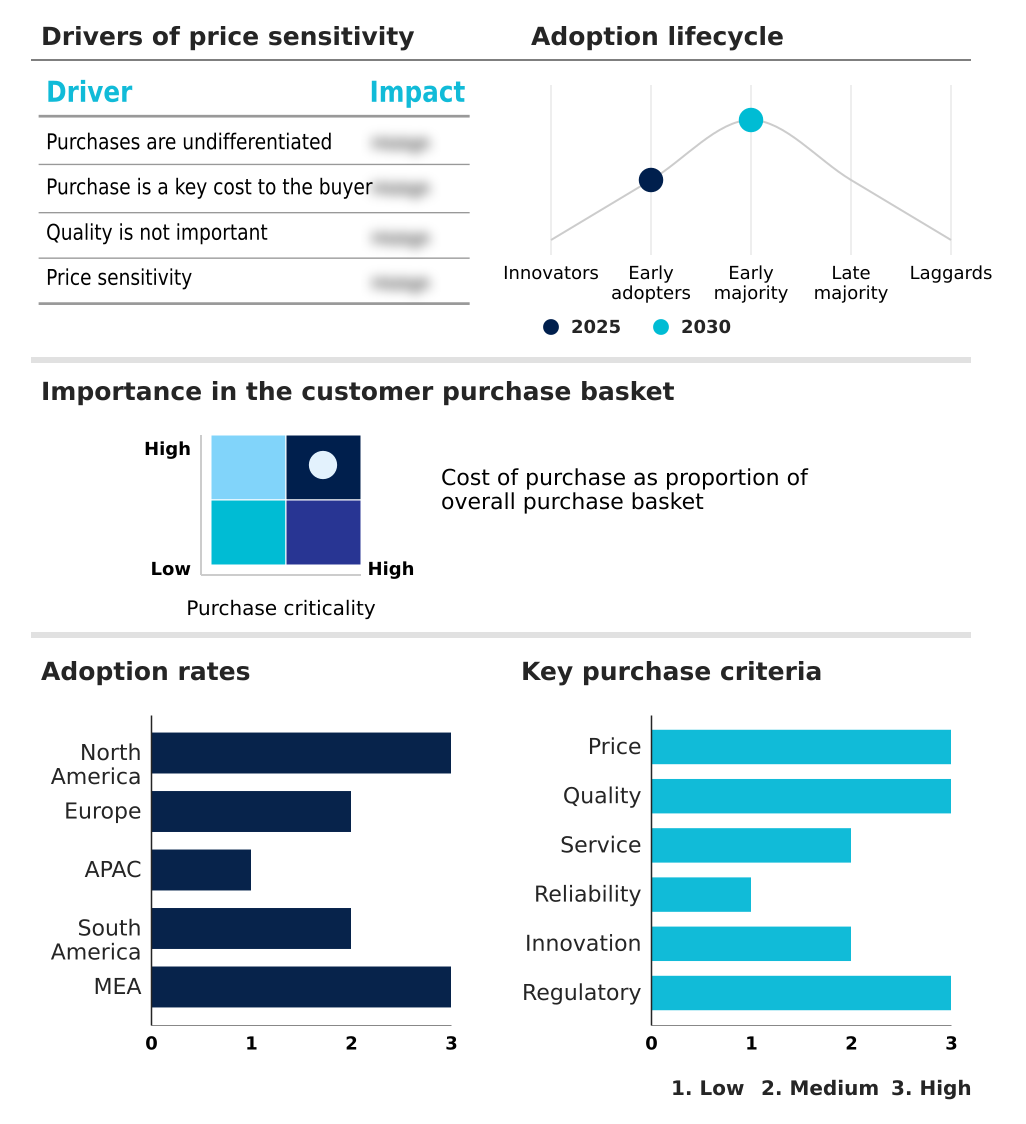
Exclusive Technavio Analysis on Customer Landscape

The glamping market forecasting report includes the adoption lifecycle of the market, covering from the innovator’s stage to the laggard’s stage. It focuses on adoption rates in different regions based on penetration. Furthermore, the glamping market report also includes key purchase criteria and drivers of price sensitivity to help companies evaluate and develop their market growth analysis strategies.

Customer Landscape of Glamping Industry

Competitive Landscape

Companies are implementing various strategies, such as strategic alliances, glamping market forecast, partnerships, mergers and acquisitions, geographical expansion, and product/service launches, to enhance their presence in the industry.

AutoCamp - Providers offer curated boutique outdoor hospitality, combining custom Airstreams, cabins, and luxury tents with scenic natural settings to meet demand for experiential travel.

The industry research and growth report includes detailed analyses of the competitive landscape of the market and information about key companies, including:

  • AutoCamp
  • Baillie Lodges
  • Bushtec Safari
  • Collective Retreats
  • Concierge Camping
  • Eco Structures
  • Glampies
  • Glamping Hub International Inc.
  • Hilton Worldwide Holdings Inc.
  • Hipcamp, Inc
  • Hoshino Resorts
  • Huttopia
  • MakeMyTrip Ltd.
  • Our Habitas
  • PAWS UP RANCH, LLC
  • Sawdays Canopy and Stars Ltd.
  • The Glamping Orchard
  • The Hidden Valley Resort
  • The Kaizen Group
  • Under Canvas

Qualitative and quantitative analysis of companies has been conducted to help clients understand the wider business environment as well as the strengths and weaknesses of key industry players. Data is qualitatively analyzed to categorize companies as pure play, category-focused, industry-focused, and diversified; it is quantitatively analyzed to categorize companies as dominant, leading, strong, tentative, and weak.

Recent Development and News in Glamping market

  • In April 2025, AvantGlamp launched a new luxury glamping resort near the NEC Birmingham, expanding high-end accommodation options for event attendees in the UK.
  • In May 2025, LuxeGlamp Eco-Resorts inaugurated its first international property, LuxeGlamp UAQ, in Umm Al Quwain, marking its entry into the United Arab Emirates market.
  • In March 2025, Saudi Arabia's tourism authority announced a strategic initiative to develop luxury glamping as a key component of its national tourism strategy under Vision 2030.
  • In December 2024, developers received final approval for a new luxury glamping resort planned on a 70-acre site in Clam Lake Township, Michigan, signaling continued investment in the US sector.

Dive into Technavio’s robust research methodology, blending expert interviews, extensive data synthesis, and validated models for unparalleled Glamping Market insights. See full methodology.

Market Scope
Page number 294
Base year 2025
Historic period 2020-2024
Forecast period 2026-2030
Growth momentum & CAGR Accelerate at a CAGR of 13%
Market growth 2026-2030 USD 3205.5 million
Market structure Fragmented
YoY growth 2025-2026(%) 11.6%
Key countries US, Canada, Mexico, UK, Germany, France, Italy, Spain, The Netherlands, Australia, China, Japan, South Korea, India, Indonesia, Brazil, Argentina, Chile, Saudi Arabia, UAE, South Africa, Egypt and Turkey
Competitive landscape Leading Companies, Market Positioning of Companies, Competitive Strategies, and Industry Risks

Request Free Sample

Research Analyst Overview

  • The glamping market reflects a definitive shift toward experiential luxury, where accommodation is an integral part of the travel narrative. This sector is characterized by a diverse array of structures, from classic safari tents, yurts, and eco-pods to highly engineered geodesic domes, treehouses, and even thermal-glass igloos, enabling four-season adaptability.
  • The underlying business models are equally varied, encompassing off-grid hospitality, agritourism, and farm diversification. A critical boardroom-level consideration is the pivot to regenerative tourism, which compels a re-evaluation of capex to prioritize low-impact accommodation and sustainable technologies like composting waste systems. This strategic alignment with ESG principles is no longer optional.
  • For instance, sites that have invested in robust satellite internet solutions to build out digital nomad infrastructure report mid-week revenue increases exceeding 20%.
  • The market's dynamism is further evidenced by the growth of specialized niches such as culinary glamping, astrotourism, and pop-up glamping villages, alongside regional specializations like bamboo architecture in Asia, bush luxury in Australia, and large-scale desert glamping projects, all contributing to a vibrant boutique outdoor hospitality landscape.

What are the Key Data Covered in this Glamping Market Research and Growth Report?

  • What is the expected growth of the Glamping Market between 2026 and 2030?

    • USD 3.21 billion, at a CAGR of 13%

  • What segmentation does the market report cover?

    • The report is segmented by Type (Cabins and pods, Tents, Yurts, and Others), Channel (Online, and Offline), Age Group (33 to 50 years, 18 to 32 years, 51 to 65 years, and above 65 years) and Geography (North America, Europe, APAC, South America, Middle East and Africa)

  • Which regions are analyzed in the report?

    • North America, Europe, APAC, South America and Middle East and Africa

  • What are the key growth drivers and market challenges?

    • Growing consumer preference for sustainable and eco-friendly tourism, Operational vulnerability to seasonality and weather volatility

  • Who are the major players in the Glamping Market?

    • AutoCamp, Baillie Lodges, Bushtec Safari, Collective Retreats, Concierge Camping, Eco Structures, Glampies, Glamping Hub International Inc., Hilton Worldwide Holdings Inc., Hipcamp, Inc, Hoshino Resorts, Huttopia, MakeMyTrip Ltd., Our Habitas, PAWS UP RANCH, LLC, Sawdays Canopy and Stars Ltd., The Glamping Orchard, The Hidden Valley Resort, The Kaizen Group and Under Canvas

Market Research Insights

  • The outdoor hospitality market is evolving rapidly, driven by consumer demand for experiential travel and unique accommodations. This has spurred growth in glamping resorts and specialized eco-luxury retreats that offer more than just a stay. Established safari lodges now compete with innovative treehouse hotels and modern glamping pods, diversifying the landscape of luxury camping.
  • The integration of reliable remote work accommodations has boosted weekday occupancy, with some operators reporting a 30% increase in non-peak bookings. Demand for wellness retreats has also led to new service offerings. This strategic shift is reshaping investment, with a focus on sustainable lodging solutions that can reduce environmental impact by up to 50% compared to traditional hotel construction.
  • Niche markets like adventure tourism and festival glamping further expand the consumer base, attracting new demographics to nature-based tourism.

We can help! Our analysts can customize this glamping market research report to meet your requirements.

Get in touch

1. Executive Summary

1.1 Market overview

Executive Summary - Chart on Market Overview
Executive Summary - Data Table on Market Overview
Executive Summary - Chart on Global Market Characteristics
Executive Summary - Chart on Market by Geography
Executive Summary - Chart on Market Segmentation by Type
Executive Summary - Chart on Market Segmentation by Channel
Executive Summary - Chart on Market Segmentation by Age Group
Executive Summary - Chart on Incremental Growth
Executive Summary - Data Table on Incremental Growth
Executive Summary - Chart on Company Market Positioning

2. Technavio Analysis

2.1 Analysis of price sensitivity, lifecycle, customer purchase basket, adoption rates, and purchase criteria

2.2 Criticality of inputs and Factors of differentiation

Chart on Overview on criticality of inputs and factors of differentiation

2.3 Factors of disruption

Chart on Overview on factors of disruption

2.4 Impact of drivers and challenges

Chart on Impact of drivers and challenges in 2025 and 2030

3. Market Landscape

3.1 Market ecosystem

Chart on Parent Market
Data Table on - Parent Market

3.2 Market characteristics

Chart on Market characteristics analysis

3.3 Value chain analysis

Chart on Value chain analysis

4. Market Sizing

4.1 Market definition

Data Table on Offerings of companies included in the market definition

4.2 Market segment analysis

Market segments

4.3 Market size 2025

4.4 Market outlook: Forecast for 2025-2030

Chart on Global - Market size and forecast 2025-2030 ($ million)
Data Table on Global - Market size and forecast 2025-2030 ($ million)
Chart on Global Market: Year-over-year growth 2025-2030 (%)
Data Table on Global Market: Year-over-year growth 2025-2030 (%)

5. Historic Market Size

5.1 Global Glamping Market 2020 - 2024

Historic Market Size - Data Table on Global Glamping Market 2020 - 2024 ($ million)

5.2 Type segment analysis 2020 - 2024

Historic Market Size - Type Segment 2020 - 2024 ($ million)

5.3 Channel segment analysis 2020 - 2024

Historic Market Size - Channel Segment 2020 - 2024 ($ million)

5.4 Age Group segment analysis 2020 - 2024

Historic Market Size - Age Group Segment 2020 - 2024 ($ million)

5.5 Geography segment analysis 2020 - 2024

Historic Market Size - Geography Segment 2020 - 2024 ($ million)

5.6 Country segment analysis 2020 - 2024

Historic Market Size - Country Segment 2020 - 2024 ($ million)

6. Qualitative Analysis

6.1 Impact of AI on the Global Glamping Market

7. Five Forces Analysis

7.1 Five forces summary

Five forces analysis - Comparison between 2025 and 2030

7.2 Bargaining power of buyers

Bargaining power of buyers - Impact of key factors 2025 and 2030

7.3 Bargaining power of suppliers

Bargaining power of suppliers - Impact of key factors in 2025 and 2030

7.4 Threat of new entrants

Threat of new entrants - Impact of key factors in 2025 and 2030

7.5 Threat of substitutes

Threat of substitutes - Impact of key factors in 2025 and 2030

7.6 Threat of rivalry

Threat of rivalry - Impact of key factors in 2025 and 2030

7.7 Market condition

Chart on Market condition - Five forces 2025 and 2030

8. Market Segmentation by Type

8.1 Market segments

Chart on Type - Market share 2025-2030 (%)
Data Table on Type - Market share 2025-2030 (%)

8.2 Comparison by Type

Chart on Comparison by Type
Data Table on Comparison by Type

8.3 Cabins and pods - Market size and forecast 2025-2030

Chart on Cabins and pods - Market size and forecast 2025-2030 ($ million)
Data Table on Cabins and pods - Market size and forecast 2025-2030 ($ million)
Chart on Cabins and pods - Year-over-year growth 2025-2030 (%)
Data Table on Cabins and pods - Year-over-year growth 2025-2030 (%)

8.4 Tents - Market size and forecast 2025-2030

Chart on Tents - Market size and forecast 2025-2030 ($ million)
Data Table on Tents - Market size and forecast 2025-2030 ($ million)
Chart on Tents - Year-over-year growth 2025-2030 (%)
Data Table on Tents - Year-over-year growth 2025-2030 (%)

8.5 Yurts - Market size and forecast 2025-2030

Chart on Yurts - Market size and forecast 2025-2030 ($ million)
Data Table on Yurts - Market size and forecast 2025-2030 ($ million)
Chart on Yurts - Year-over-year growth 2025-2030 (%)
Data Table on Yurts - Year-over-year growth 2025-2030 (%)

8.6 Others - Market size and forecast 2025-2030

Chart on Others - Market size and forecast 2025-2030 ($ million)
Data Table on Others - Market size and forecast 2025-2030 ($ million)
Chart on Others - Year-over-year growth 2025-2030 (%)
Data Table on Others - Year-over-year growth 2025-2030 (%)

8.7 Market opportunity by Type

Market opportunity by Type ($ million)
Data Table on Market opportunity by Type ($ million)

9. Market Segmentation by Channel

9.1 Market segments

Chart on Channel - Market share 2025-2030 (%)
Data Table on Channel - Market share 2025-2030 (%)

9.2 Comparison by Channel

Chart on Comparison by Channel
Data Table on Comparison by Channel

9.3 Online - Market size and forecast 2025-2030

Chart on Online - Market size and forecast 2025-2030 ($ million)
Data Table on Online - Market size and forecast 2025-2030 ($ million)
Chart on Online - Year-over-year growth 2025-2030 (%)
Data Table on Online - Year-over-year growth 2025-2030 (%)

9.4 Offline - Market size and forecast 2025-2030

Chart on Offline - Market size and forecast 2025-2030 ($ million)
Data Table on Offline - Market size and forecast 2025-2030 ($ million)
Chart on Offline - Year-over-year growth 2025-2030 (%)
Data Table on Offline - Year-over-year growth 2025-2030 (%)

9.5 Market opportunity by Channel

Market opportunity by Channel ($ million)
Data Table on Market opportunity by Channel ($ million)

10. Market Segmentation by Age Group

10.1 Market segments

Chart on Age Group - Market share 2025-2030 (%)
Data Table on Age Group - Market share 2025-2030 (%)

10.2 Comparison by Age Group

Chart on Comparison by Age Group
Data Table on Comparison by Age Group

10.3 33 to 50 years - Market size and forecast 2025-2030

Chart on 33 to 50 years - Market size and forecast 2025-2030 ($ million)
Data Table on 33 to 50 years - Market size and forecast 2025-2030 ($ million)
Chart on 33 to 50 years - Year-over-year growth 2025-2030 (%)
Data Table on 33 to 50 years - Year-over-year growth 2025-2030 (%)

10.4 18 to 32 years - Market size and forecast 2025-2030

Chart on 18 to 32 years - Market size and forecast 2025-2030 ($ million)
Data Table on 18 to 32 years - Market size and forecast 2025-2030 ($ million)
Chart on 18 to 32 years - Year-over-year growth 2025-2030 (%)
Data Table on 18 to 32 years - Year-over-year growth 2025-2030 (%)

10.5 51 to 65 years - Market size and forecast 2025-2030

Chart on 51 to 65 years - Market size and forecast 2025-2030 ($ million)
Data Table on 51 to 65 years - Market size and forecast 2025-2030 ($ million)
Chart on 51 to 65 years - Year-over-year growth 2025-2030 (%)
Data Table on 51 to 65 years - Year-over-year growth 2025-2030 (%)

10.6 Above 65 years - Market size and forecast 2025-2030

Chart on Above 65 years - Market size and forecast 2025-2030 ($ million)
Data Table on Above 65 years - Market size and forecast 2025-2030 ($ million)
Chart on Above 65 years - Year-over-year growth 2025-2030 (%)
Data Table on Above 65 years - Year-over-year growth 2025-2030 (%)

10.7 Market opportunity by Age Group

Market opportunity by Age Group ($ million)
Data Table on Market opportunity by Age Group ($ million)

11. Customer Landscape

11.1 Customer landscape overview

Analysis of price sensitivity, lifecycle, customer purchase basket, adoption rates, and purchase criteria

12. Geographic Landscape

12.1 Geographic segmentation

Chart on Market share by geography 2025-2030 (%)
Data Table on Market share by geography 2025-2030 (%)

12.2 Geographic comparison

Chart on Geographic comparison
Data Table on Geographic comparison

12.3 North America - Market size and forecast 2025-2030

Chart on North America - Market size and forecast 2025-2030 ($ million)
Data Table on North America - Market size and forecast 2025-2030 ($ million)
Chart on North America - Year-over-year growth 2025-2030 (%)
Data Table on North America - Year-over-year growth 2025-2030 (%)
Chart on Regional Comparison - North America
Data Table on Regional Comparison - North America

12.3.1 US - Market size and forecast 2025-2030

Chart on US - Market size and forecast 2025-2030 ($ million)
Data Table on US - Market size and forecast 2025-2030 ($ million)
Chart on US - Year-over-year growth 2025-2030 (%)
Data Table on US - Year-over-year growth 2025-2030 (%)

12.3.2 Canada - Market size and forecast 2025-2030

Chart on Canada - Market size and forecast 2025-2030 ($ million)
Data Table on Canada - Market size and forecast 2025-2030 ($ million)
Chart on Canada - Year-over-year growth 2025-2030 (%)
Data Table on Canada - Year-over-year growth 2025-2030 (%)

12.3.3 Mexico - Market size and forecast 2025-2030

Chart on Mexico - Market size and forecast 2025-2030 ($ million)
Data Table on Mexico - Market size and forecast 2025-2030 ($ million)
Chart on Mexico - Year-over-year growth 2025-2030 (%)
Data Table on Mexico - Year-over-year growth 2025-2030 (%)

12.4 Europe - Market size and forecast 2025-2030

Chart on Europe - Market size and forecast 2025-2030 ($ million)
Data Table on Europe - Market size and forecast 2025-2030 ($ million)
Chart on Europe - Year-over-year growth 2025-2030 (%)
Data Table on Europe - Year-over-year growth 2025-2030 (%)
Chart on Regional Comparison - Europe
Data Table on Regional Comparison - Europe

12.4.1 UK - Market size and forecast 2025-2030

Chart on UK - Market size and forecast 2025-2030 ($ million)
Data Table on UK - Market size and forecast 2025-2030 ($ million)
Chart on UK - Year-over-year growth 2025-2030 (%)
Data Table on UK - Year-over-year growth 2025-2030 (%)

12.4.2 Germany - Market size and forecast 2025-2030

Chart on Germany - Market size and forecast 2025-2030 ($ million)
Data Table on Germany - Market size and forecast 2025-2030 ($ million)
Chart on Germany - Year-over-year growth 2025-2030 (%)
Data Table on Germany - Year-over-year growth 2025-2030 (%)

12.4.3 France - Market size and forecast 2025-2030

Chart on France - Market size and forecast 2025-2030 ($ million)
Data Table on France - Market size and forecast 2025-2030 ($ million)
Chart on France - Year-over-year growth 2025-2030 (%)
Data Table on France - Year-over-year growth 2025-2030 (%)

12.4.4 Italy - Market size and forecast 2025-2030

Chart on Italy - Market size and forecast 2025-2030 ($ million)
Data Table on Italy - Market size and forecast 2025-2030 ($ million)
Chart on Italy - Year-over-year growth 2025-2030 (%)
Data Table on Italy - Year-over-year growth 2025-2030 (%)

12.4.5 Spain - Market size and forecast 2025-2030

Chart on Spain - Market size and forecast 2025-2030 ($ million)
Data Table on Spain - Market size and forecast 2025-2030 ($ million)
Chart on Spain - Year-over-year growth 2025-2030 (%)
Data Table on Spain - Year-over-year growth 2025-2030 (%)

12.4.6 The Netherlands - Market size and forecast 2025-2030

Chart on The Netherlands - Market size and forecast 2025-2030 ($ million)
Data Table on The Netherlands - Market size and forecast 2025-2030 ($ million)
Chart on The Netherlands - Year-over-year growth 2025-2030 (%)
Data Table on The Netherlands - Year-over-year growth 2025-2030 (%)

12.5 APAC - Market size and forecast 2025-2030

Chart on APAC - Market size and forecast 2025-2030 ($ million)
Data Table on APAC - Market size and forecast 2025-2030 ($ million)
Chart on APAC - Year-over-year growth 2025-2030 (%)
Data Table on APAC - Year-over-year growth 2025-2030 (%)
Chart on Regional Comparison - APAC
Data Table on Regional Comparison - APAC

12.5.1 Australia - Market size and forecast 2025-2030

Chart on Australia - Market size and forecast 2025-2030 ($ million)
Data Table on Australia - Market size and forecast 2025-2030 ($ million)
Chart on Australia - Year-over-year growth 2025-2030 (%)
Data Table on Australia - Year-over-year growth 2025-2030 (%)

12.5.2 China - Market size and forecast 2025-2030

Chart on China - Market size and forecast 2025-2030 ($ million)
Data Table on China - Market size and forecast 2025-2030 ($ million)
Chart on China - Year-over-year growth 2025-2030 (%)
Data Table on China - Year-over-year growth 2025-2030 (%)

12.5.3 Japan - Market size and forecast 2025-2030

Chart on Japan - Market size and forecast 2025-2030 ($ million)
Data Table on Japan - Market size and forecast 2025-2030 ($ million)
Chart on Japan - Year-over-year growth 2025-2030 (%)
Data Table on Japan - Year-over-year growth 2025-2030 (%)

12.5.4 South Korea - Market size and forecast 2025-2030

Chart on South Korea - Market size and forecast 2025-2030 ($ million)
Data Table on South Korea - Market size and forecast 2025-2030 ($ million)
Chart on South Korea - Year-over-year growth 2025-2030 (%)
Data Table on South Korea - Year-over-year growth 2025-2030 (%)

12.5.5 India - Market size and forecast 2025-2030

Chart on India - Market size and forecast 2025-2030 ($ million)
Data Table on India - Market size and forecast 2025-2030 ($ million)
Chart on India - Year-over-year growth 2025-2030 (%)
Data Table on India - Year-over-year growth 2025-2030 (%)

12.5.6 Indonesia - Market size and forecast 2025-2030

Chart on Indonesia - Market size and forecast 2025-2030 ($ million)
Data Table on Indonesia - Market size and forecast 2025-2030 ($ million)
Chart on Indonesia - Year-over-year growth 2025-2030 (%)
Data Table on Indonesia - Year-over-year growth 2025-2030 (%)

12.6 South America - Market size and forecast 2025-2030

Chart on South America - Market size and forecast 2025-2030 ($ million)
Data Table on South America - Market size and forecast 2025-2030 ($ million)
Chart on South America - Year-over-year growth 2025-2030 (%)
Data Table on South America - Year-over-year growth 2025-2030 (%)
Chart on Regional Comparison - South America
Data Table on Regional Comparison - South America

12.6.1 Brazil - Market size and forecast 2025-2030

Chart on Brazil - Market size and forecast 2025-2030 ($ million)
Data Table on Brazil - Market size and forecast 2025-2030 ($ million)
Chart on Brazil - Year-over-year growth 2025-2030 (%)
Data Table on Brazil - Year-over-year growth 2025-2030 (%)

12.6.2 Argentina - Market size and forecast 2025-2030

Chart on Argentina - Market size and forecast 2025-2030 ($ million)
Data Table on Argentina - Market size and forecast 2025-2030 ($ million)
Chart on Argentina - Year-over-year growth 2025-2030 (%)
Data Table on Argentina - Year-over-year growth 2025-2030 (%)

12.6.3 Chile - Market size and forecast 2025-2030

Chart on Chile - Market size and forecast 2025-2030 ($ million)
Data Table on Chile - Market size and forecast 2025-2030 ($ million)
Chart on Chile - Year-over-year growth 2025-2030 (%)
Data Table on Chile - Year-over-year growth 2025-2030 (%)

12.7 Middle East and Africa - Market size and forecast 2025-2030

Chart on Middle East and Africa - Market size and forecast 2025-2030 ($ million)
Data Table on Middle East and Africa - Market size and forecast 2025-2030 ($ million)
Chart on Middle East and Africa - Year-over-year growth 2025-2030 (%)
Data Table on Middle East and Africa - Year-over-year growth 2025-2030 (%)
Chart on Regional Comparison - Middle East and Africa
Data Table on Regional Comparison - Middle East and Africa

12.7.1 Saudi Arabia - Market size and forecast 2025-2030

Chart on Saudi Arabia - Market size and forecast 2025-2030 ($ million)
Data Table on Saudi Arabia - Market size and forecast 2025-2030 ($ million)
Chart on Saudi Arabia - Year-over-year growth 2025-2030 (%)
Data Table on Saudi Arabia - Year-over-year growth 2025-2030 (%)

12.7.2 UAE - Market size and forecast 2025-2030

Chart on UAE - Market size and forecast 2025-2030 ($ million)
Data Table on UAE - Market size and forecast 2025-2030 ($ million)
Chart on UAE - Year-over-year growth 2025-2030 (%)
Data Table on UAE - Year-over-year growth 2025-2030 (%)

12.7.3 South Africa - Market size and forecast 2025-2030

Chart on South Africa - Market size and forecast 2025-2030 ($ million)
Data Table on South Africa - Market size and forecast 2025-2030 ($ million)
Chart on South Africa - Year-over-year growth 2025-2030 (%)
Data Table on South Africa - Year-over-year growth 2025-2030 (%)

12.7.4 Egypt - Market size and forecast 2025-2030

Chart on Egypt - Market size and forecast 2025-2030 ($ million)
Data Table on Egypt - Market size and forecast 2025-2030 ($ million)
Chart on Egypt - Year-over-year growth 2025-2030 (%)
Data Table on Egypt - Year-over-year growth 2025-2030 (%)

12.7.5 Turkey - Market size and forecast 2025-2030

Chart on Turkey - Market size and forecast 2025-2030 ($ million)
Data Table on Turkey - Market size and forecast 2025-2030 ($ million)
Chart on Turkey - Year-over-year growth 2025-2030 (%)
Data Table on Turkey - Year-over-year growth 2025-2030 (%)

12.8 Market opportunity by geography

Market opportunity by geography ($ million)
Data Tables on Market opportunity by geography ($ million)

13. Drivers, Challenges, and Opportunity

13.1 Market drivers

Growing consumer preference for sustainable and eco-friendly tourism
Expansion of experience economy and digital nomadism
Evolution of corporate retreats and event-based accommodations

13.2 Market challenges

Operational vulnerability to seasonality and weather volatility
Complex regulatory landscapes and zoning restrictions
High capital expenditure relative to infrastructure maintenance

13.3 Impact of drivers and challenges

Impact of drivers and challenges in 2025 and 2030

13.4 Market opportunities

Convergence of eco-luxury and regenerative tourism
Mainstreaming of digital nomad infrastructure and leisure travel
Diversification of accommodation structures and thematic experiences

14. Competitive Landscape

14.1 Overview

14.2

Overview on criticality of inputs and factors of differentiation

14.3 Landscape disruption

Overview on factors of disruption

14.4 Industry risks

Impact of key risks on business

15. Competitive Analysis

15.1 Companies profiled

Companies covered

15.2 Company ranking index

15.3 Market positioning of companies

Matrix on companies position and classification

15.4 AutoCamp

AutoCamp - Overview
AutoCamp - Product / Service
AutoCamp - Key offerings
SWOT

15.5 Bushtec Safari

Bushtec Safari - Overview
Bushtec Safari - Product / Service
Bushtec Safari - Key offerings
SWOT

15.6 Collective Retreats

Collective Retreats - Overview
Collective Retreats - Product / Service
Collective Retreats - Key offerings
SWOT

15.7 Eco Structures

Eco Structures - Overview
Eco Structures - Product / Service
Eco Structures - Key offerings
SWOT

15.8 Glamping Hub International Inc.

Glamping Hub International Inc. - Overview
Glamping Hub International Inc. - Product / Service
Glamping Hub International Inc. - Key offerings
SWOT

15.9 Hilton Worldwide Holdings Inc.

Hilton Worldwide Holdings Inc. - Overview
Hilton Worldwide Holdings Inc. - Business segments
Hilton Worldwide Holdings Inc. - Key offerings
Hilton Worldwide Holdings Inc. - Segment focus
SWOT

15.10 Hipcamp, Inc

Hipcamp, Inc - Overview
Hipcamp, Inc - Product / Service
Hipcamp, Inc - Key offerings
SWOT

15.11 Huttopia

Huttopia - Overview
Huttopia - Product / Service
Huttopia - Key offerings
SWOT

15.12 Our Habitas

Our Habitas - Overview
Our Habitas - Product / Service
Our Habitas - Key offerings
SWOT

15.13 PAWS UP RANCH, LLC

PAWS UP RANCH, LLC - Overview
PAWS UP RANCH, LLC - Product / Service
PAWS UP RANCH, LLC - Key offerings
SWOT

15.14 Sawdays Canopy and Stars Ltd.

Sawdays Canopy and Stars Ltd. - Overview
Sawdays Canopy and Stars Ltd. - Product / Service
Sawdays Canopy and Stars Ltd. - Key offerings
SWOT

15.15 The Glamping Orchard

The Glamping Orchard - Overview
The Glamping Orchard - Product / Service
The Glamping Orchard - Key offerings
SWOT

15.16 The Hidden Valley Resort

The Hidden Valley Resort - Overview
The Hidden Valley Resort - Product / Service
The Hidden Valley Resort - Key offerings
SWOT

15.17 The Kaizen Group

The Kaizen Group - Overview
The Kaizen Group - Product / Service
The Kaizen Group - Key offerings
SWOT

15.18 Under Canvas

Under Canvas - Overview
Under Canvas - Product / Service
Under Canvas - Key offerings
SWOT

16. Appendix

16.1 Scope of the report

Market definition
Objectives
Notes and caveats

16.2 Inclusions and exclusions checklist

Inclusions checklist
Exclusions checklist

16.3 Currency conversion rates for US$

16.4 Research methodology

16.5 Data procurement

Information sources

16.6 Data validation

16.7 Validation techniques employed for market sizing

16.8 Data synthesis

16.9 360 degree market analysis

16.10 List of abbreviations

Research Methodology

Technavio presents a detailed picture of the market by way of study, synthesis, and summation of data from multiple sources. The analysts have presented the various facets of the market with a particular focus on identifying the key industry influencers. The data thus presented is comprehensive, reliable, and the result of extensive research, both primary and secondary.

INFORMATION SOURCES

Primary sources

  • Manufacturers and suppliers
  • Channel partners
  • Industry experts
  • Strategic decision makers

Secondary sources

  • Industry journals and periodicals
  • Government data
  • Financial reports of key industry players
  • Historical data
  • Press releases

DATA ANALYSIS

Data Synthesis

  • Collation of data
  • Estimation of key figures
  • Analysis of derived insights

Data Validation

  • Triangulation with data models
  • Reference against proprietary databases
  • Corroboration with industry experts

REPORT WRITING

Qualitative

  • Market drivers
  • Market challenges
  • Market trends
  • Five forces analysis

Quantitative

  • Market size and forecast
  • Market segmentation
  • Geographical insights
  • Competitive landscape

Interested in this report?

Get your sample now to see our research methodology and insights!

Download Now

Frequently Asked Questions

Glamping market growth will increase by USD 3205.5 million during 2026-2030.

The Glamping market is expected to grow at a CAGR of 13% during 2026-2030.

Glamping market is segmented by Type (Cabins and pods, Tents, Yurts, Others) Channel (Online, Offline) Age group (33 to 50 years, 18 to 32 years, 51 to 65 years, Above 65 years)

AutoCamp, Baillie Lodges, Bushtec Safari, Collective Retreats, Concierge Camping, Eco Structures, Glampies, Glamping Hub International Inc., Hilton Worldwide Holdings Inc., Hipcamp, Inc, Hoshino Resorts, Huttopia, MakeMyTrip Ltd., Our Habitas, PAWS UP RANCH, LLC, Sawdays Canopy and Stars Ltd., The Glamping Orchard, The Hidden Valley Resort, The Kaizen Group, Under Canvas are a few of the key vendors in the Glamping market.

North America will register the highest growth rate of 51.1% among the other regions. Therefore, the Glamping market in North America is expected to garner significant business opportunities for the vendors during the forecast period.

US, Canada, Mexico, UK, Germany, France, Italy, Spain, The Netherlands, Australia, China, Japan, South Korea, India, Indonesia, Brazil, Argentina, Chile, Saudi Arabia, UAE, South Africa, Egypt, Turkey

  • Growing consumer preference for sustainable and eco-friendly tourism is the driving factor this market.

The Glamping market vendors should focus on grabbing business opportunities from the Type segment as it accounted for the largest market share in the base year.
RIA - Research AI Assistant
Ask RIA