Geothermal Power Market Analysis, Size, and Forecast 2026-2030: APAC (Indonesia, China, and Japan), North America (US, Canada, and Mexico), Europe (Italy, Germany, and UK), South America (Brazil and Argentina), Middle East and Africa (Turkey, South Africa, and Saudi Arabia), and Rest of World (ROW)

Geothermal Power Market Analysis, Size, and Forecast 2026-2030:
APAC (Indonesia, China, and Japan), North America (US, Canada, and Mexico), Europe (Italy, Germany, and UK), South America (Brazil and Argentina), Middle East and Africa (Turkey, South Africa, and Saudi Arabia), and Rest of World (ROW)

Published: Dec 2025 293 Pages SKU: IRTNTR40214

Market Overview at a Glance

$19.41 B
Market Opportunity
27.8%
CAGR 2025 - 2030
36.7%
APAC Growth
$3.58 B
Flash segment 2024

Geothermal Power Market Size 2026-2030

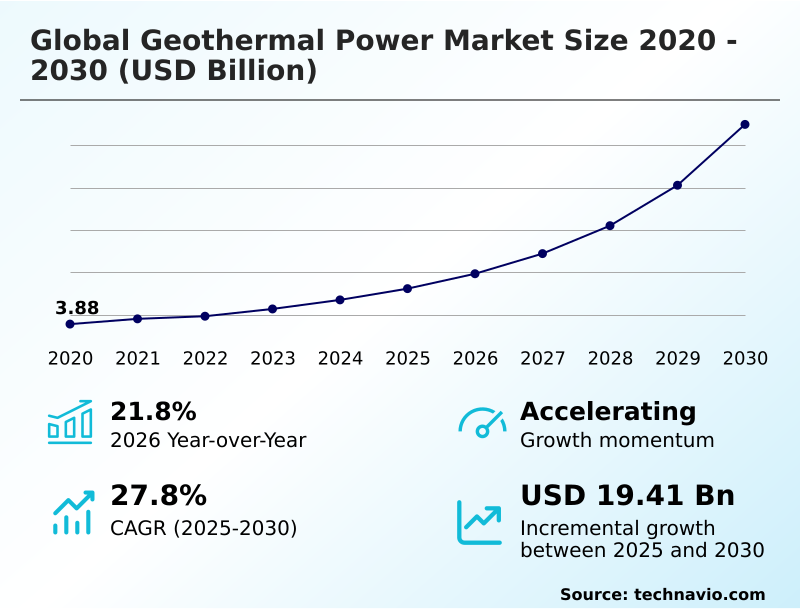
The geothermal power market size is valued to increase by USD 19.41 billion, at a CAGR of 27.8% from 2025 to 2030. Demand for clean baseload power will drive the geothermal power market.

Major Market Trends & Insights

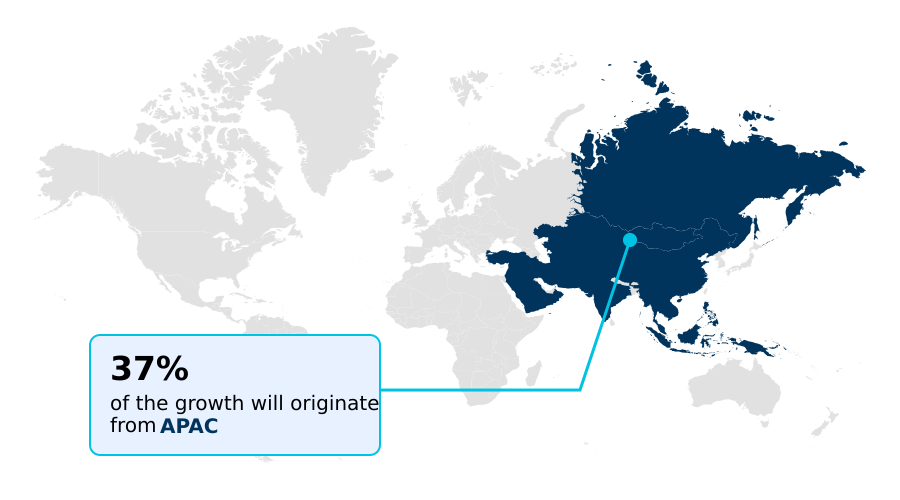
  • APAC dominated the market and accounted for a 36.7% growth during the forecast period.
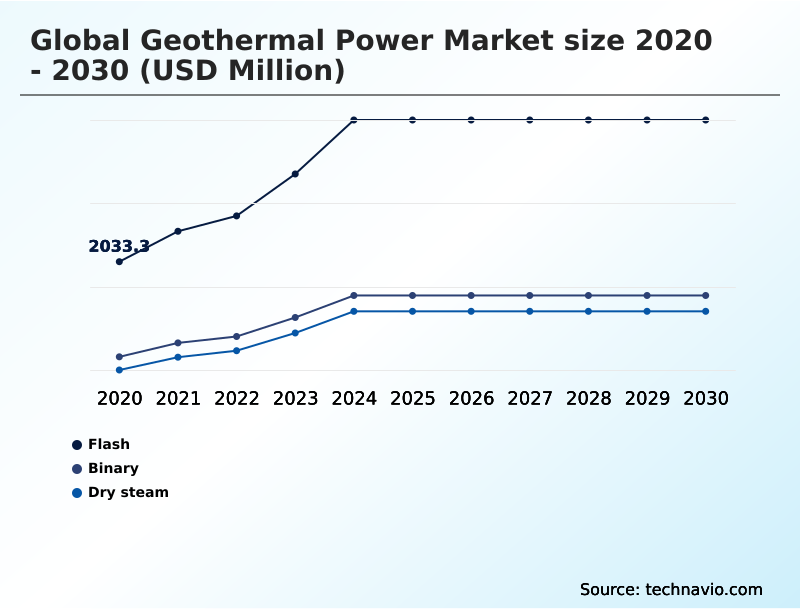
  • By Type - Flash segment was valued at USD 3.58 billion in 2024
  • By End-user - Industrial segment accounted for the largest market revenue share in 2024

Market Size & Forecast

  • Market Opportunities: USD 23.60 billion
  • Market Future Opportunities: USD 19.41 billion
  • CAGR from 2025 to 2030 : 27.8%

Market Summary

  • The geothermal power market is an essential pillar in the transition to a sustainable energy future, providing a reliable source of carbon-free electricity that complements intermittent renewables. Unlike wind and solar, its ability to deliver continuous baseload power makes it invaluable for grid stability.
  • The industry is undergoing a significant transformation, driven by technological advancements that are expanding its geographic and economic viability. Innovations in enhanced geothermal systems (egs) are unlocking vast resources in regions previously deemed unsuitable, while the increasing adoption of efficient binary cycle power plants allows for power generation from lower-temperature reservoirs. This evolution presents complex strategic choices for utility operators.
  • For example, an energy procurement manager must weigh the high upfront investment and geological risks of a new geothermal project against the long-term benefits of a dispatchable, high-capacity-factor asset.
  • This decision calculus is critical for meeting stringent resource adequacy mandates and ensuring a resilient power grid, a challenge that highlights the market's unique position in balancing cost, risk, and long-term energy security.

What will be the Size of the Geothermal Power Market during the forecast period?

Get Key Insights on Market Forecast (PDF) Request Free Sample

How is the Geothermal Power Market Segmented?

The geothermal power industry research report provides comprehensive data (region-wise segment analysis), with forecasts and estimates in "USD million" for the period 2026-2030, as well as historical data from 2020-2024 for the following segments.

  • Type
    • Flash
    • Binary
    • Dry steam
  • End-user
    • Industrial
    • Commercial
    • Residential
  • Resource type
    • Low temperature
    • Medium temperature
    • High temperature
  • Geography
    • APAC
      • Indonesia
      • China
      • Japan
    • North America
      • US
      • Canada
      • Mexico
    • Europe
      • Italy
      • Germany
      • UK
    • South America
      • Brazil
      • Argentina
    • Middle East and Africa
      • Turkey
      • South Africa
      • Saudi Arabia
    • Rest of World (ROW)

By Type Insights

The flash segment is estimated to witness significant growth during the forecast period.

Flash steam technology remains a cornerstone of the global geothermal power market, pivotal for baseload power generation in regions with high-enthalpy systems.

This method involves channeling high-pressure geothermal fluids from production wells to the surface, where a pressure drop in steam separators causes the liquid to 'flash' into vapor. This steam drives turbines, providing essential firm power capacity.

The remaining hot water is managed through injection wells to maintain reservoir pressure. A key evolution is the development of hybrid geothermal plants, which integrate secondary binary cycles to capture residual heat, boosting efficiency.

This focus on maximizing output from existing sustainable infrastructure, with plants achieving over 90% availability, is central to the clean energy transition and enhances both resource adequacy and energy independence.

Request Free Sample

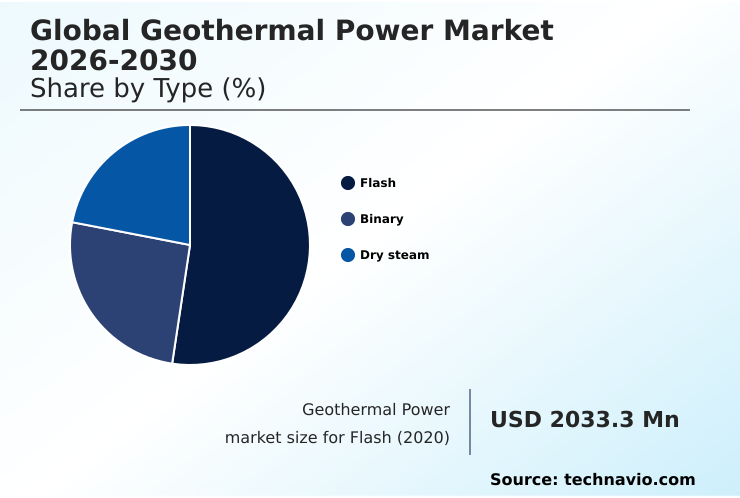
The Flash segment was valued at USD 3.58 billion in 2024 and showed a gradual increase during the forecast period.

Request Free Sample

Regional Analysis

APAC is estimated to contribute 36.7% to the growth of the global market during the forecast period.Technavio’s analysts have elaborately explained the regional trends and drivers that shape the market during the forecast period.

See How Geothermal Power Market Demand is Rising in APAC Request Free Sample

The geographic landscape is diversifying beyond traditional regions with dry steam reservoirs. North America is advancing renewable baseload power through resource assessment and reservoir engineering for enhanced systems, which use techniques like hydraulic fracturing in egs to unlock heat.

Europe is focused on low-enthalpy resources for industrial decarbonization and district heating to meet net-zero emissions targets, with projects showing a 30% greater efficiency in heat delivery.

Meanwhile, APAC leverages its high-enthalpy fields, contributing over 36% of market growth, to ensure regional energy security.

This global expansion, powered by advanced drilling technology and optimized geothermal turbines, positions geothermal as a critical source of firm power, increasingly integrated with applications like thermal energy storage and direct air capture (dac).

Market Dynamics

Our researchers analyzed the data with 2025 as the base year, along with the key drivers, trends, and challenges. A holistic analysis of drivers will help companies refine their marketing strategies to gain a competitive advantage.

  • Strategic planning in the geothermal sector involves a complex evaluation of enhanced geothermal systems vs traditional hydrothermal approaches. The decision hinges on factors like binary cycle efficiency in low-temperature resources and the potential for optimizing flash steam plant performance in established fields.
  • Central to this is effective drilling risk mitigation for geothermal projects, which is a primary input for any financial modeling for geothermal power plants. As new applications emerge, such as geothermal power for data center cooling and integrating geothermal with green hydrogen production, the economic calculus diversifies.
  • However, success depends on navigating geothermal permitting and regulations and overcoming technical hurdles like the challenges of geothermal brine disposal and reinjection. The role of AI in geothermal reservoir management is becoming critical, with advanced software reporting operational efficiencies up to 15% higher than conventional methods.
  • Innovations in closed-loop geothermal systems for urban heating and the pursuit of supercritical geothermal for high-density power output demonstrate the industry's forward trajectory. Future growth also depends on the economic viability of hot dry rock technology, refining geothermal power purchase agreement structures, understanding the impact of subsurface geology on drilling costs, and developing new regulatory frameworks for induced seismicity.
  • Further opportunities lie in hybrid solar-geothermal plant design, the pursuit of geothermal lithium extraction from brine, and the repurposing of oil and gas wells for geothermal energy.

What are the key market drivers leading to the rise in the adoption of Geothermal Power Industry?

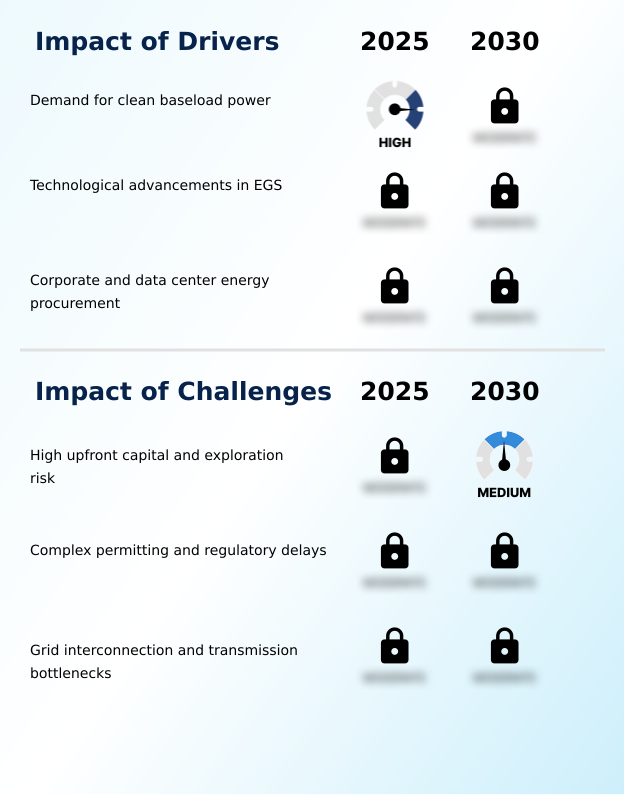
  • The increasing demand for clean and reliable baseload power serves as the key driver for market growth.

  • Aggressive decarbonization strategies and corporate energy procurement are fueling demand for clean firm power, a need that intermittent renewables cannot meet alone. This drives investment in utility-scale projects, particularly enhanced geothermal systems (egs), which provide crucial grid stability solutions.
  • Tech giants are securing long-term geothermal power purchase agreement (ppa) contracts to power data centers, validating the economic case for innovative approaches like closed-loop geothermal and geopressured systems in hot dry rock (hdr) formations.
  • The high capacity factor of geothermal plants, often exceeding 90%, is a critical performance metric that underpins geothermal project financing and reinforces its role as a reliable energy source, contrasting sharply with other renewables.

What are the market trends shaping the Geothermal Power Industry?

  • Technological innovations that enhance geothermal energy extraction are an upcoming market trend. These advancements improve project viability and expand potential beyond traditional regions.

  • The market is witnessing a surge in advanced geothermal technology, with binary cycle power plants utilizing organic rankine cycle (orc) systems becoming standard for tapping into vast geothermal resource potential. These next-generation geothermal solutions are enabling direct-use geothermal applications, including large-scale geothermal district heating networks. Innovations in exploration drilling and well stimulation are unlocking previously inaccessible supercritical geothermal resources.
  • For instance, advanced drilling techniques have improved success rates by over 15% in pilot projects. Furthermore, a focus on circular economy principles is driving interest in geothermal heating and cooling for industrial uses and the co-production of green hydrogen production, broadening the technology's economic and environmental impact.

What challenges does the Geothermal Power Industry face during its growth?

  • High upfront capital requirements and significant exploration risks present a key challenge affecting the industry's growth trajectory.

  • Significant geothermal exploration risk and high capital outlay for drilling technology remain primary barriers to expanding the role of this sustainable energy source in the renewable energy portfolio. Developing subsurface reservoirs requires substantial upfront investment in wellhead equipment and power generation equipment, with exploration drilling accounting for up to 50% of total project costs.
  • Ineffective reservoir management techniques can further impede long-term electricity grid reliability. Moreover, complex geothermal energy policy and permitting delays can stall geothermal development for years. Even with proven resources, challenges persist in optimizing components like heat exchangers and condensing units and integrating new revenue streams such as geothermal lithium extraction to improve project economics.

Exclusive Technavio Analysis on Customer Landscape

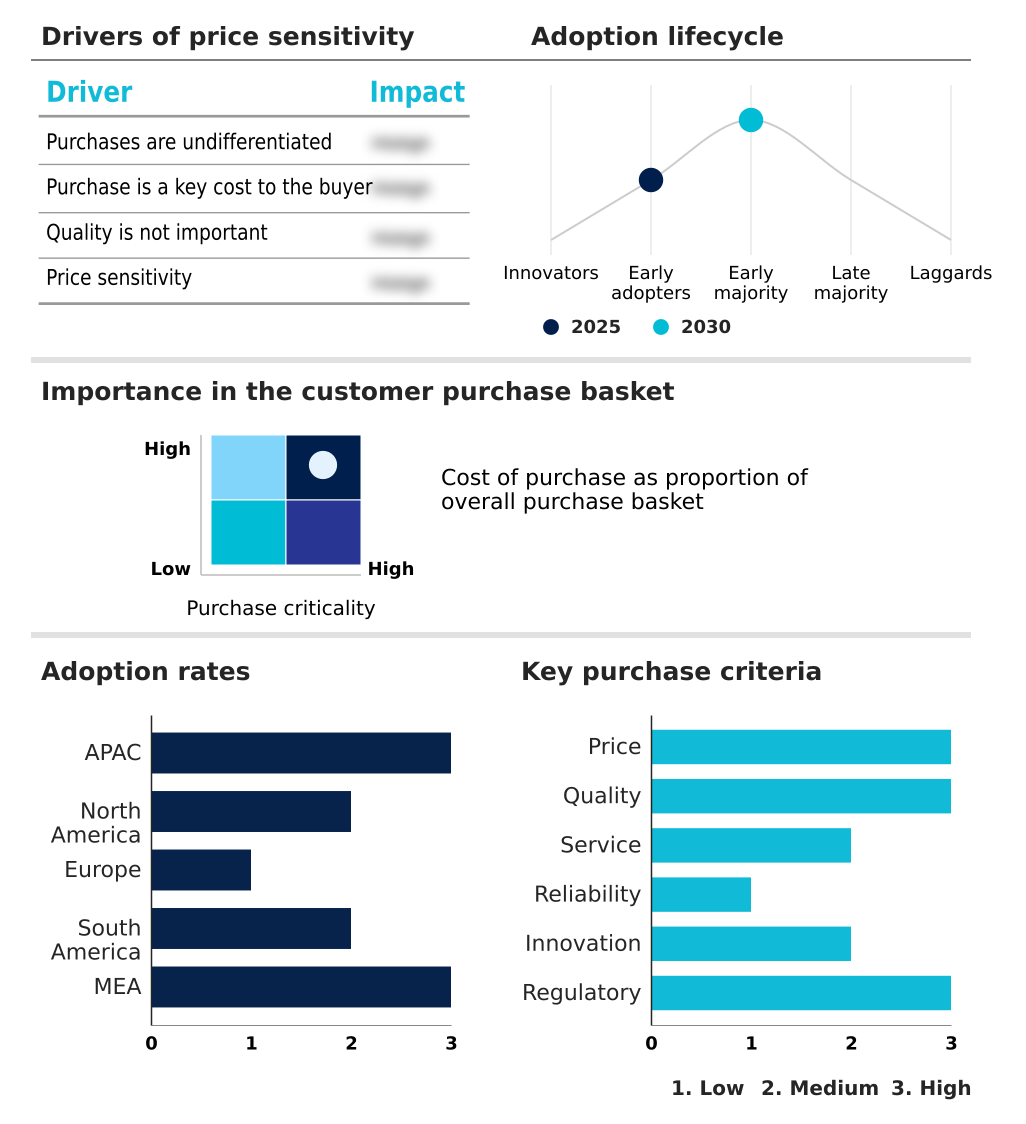
The geothermal power market forecasting report includes the adoption lifecycle of the market, covering from the innovator’s stage to the laggard’s stage. It focuses on adoption rates in different regions based on penetration. Furthermore, the geothermal power market report also includes key purchase criteria and drivers of price sensitivity to help companies evaluate and develop their market growth analysis strategies.

Customer Landscape of Geothermal Power Industry

Competitive Landscape

Companies are implementing various strategies, such as strategic alliances, geothermal power market forecast, partnerships, mergers and acquisitions, geographical expansion, and product/service launches, to enhance their presence in the industry.

Aboitiz Power Corp. - Specializes in harnessing geothermal resources, operating significant power complexes to deliver renewable energy solutions.

The industry research and growth report includes detailed analyses of the competitive landscape of the market and information about key companies, including:

  • Aboitiz Power Corp.
  • Calpine Corp.
  • Cyrq Energy Inc.
  • DEEP Corp.
  • Enel Spa
  • EnergySource LLC
  • Fervo Energy
  • First Gen Corp.
  • Fuji Electric Co. Ltd.
  • General Electric Co.
  • HS Orka
  • Kenya Electricity Co. Ltd.
  • KYUSHU ELECTRIC POWER CO. INC.
  • Mitsubishi Heavy Ltd.
  • Ormat Technologies Inc.
  • PT Pertamina Geothermal Energy
  • Reykjavik Geothermal
  • Star Energy Geothermal Ltd.
  • Toshiba Corp.

Qualitative and quantitative analysis of companies has been conducted to help clients understand the wider business environment as well as the strengths and weaknesses of key industry players. Data is qualitatively analyzed to categorize companies as pure play, category-focused, industry-focused, and diversified; it is quantitatively analyzed to categorize companies as dominant, leading, strong, tentative, and weak.

Recent Development and News in Geothermal power market

  • In August, 2024, Meta Platforms announced a strategic partnership with Sage Geosystems to develop 150 MW of geothermal power, aimed at supporting its growing data center infrastructure and meeting corporate clean energy goals.
  • In October, 2024, Mitsubishi Heavy Ltd. secured a turnkey contract to retrofit the Darajat Geothermal Power Plant, implementing advanced turbine technology to improve the facility's output efficiency and extend its operational lifespan.
  • In January, 2025, EnergySource LLC received a conditional loan commitment from the United States Department of Energy to develop a commercial-scale facility for extracting lithium from geothermal brine, highlighting the market's expansion into critical mineral production.
  • In February, 2025, Ormat Technologies Inc. commenced commercial operations at the 35 MW Ijen Geothermal Facility in Indonesia, strengthening its global footprint and contributing to the region's renewable energy capacity.

Dive into Technavio’s robust research methodology, blending expert interviews, extensive data synthesis, and validated models for unparalleled Geothermal Power Market insights. See full methodology.

Market Scope
Page number 293
Base year 2025
Historic period 2020-2024
Forecast period 2026-2030
Growth momentum & CAGR Accelerate at a CAGR of 27.8%
Market growth 2026-2030 USD 19414.0 million
Market structure Fragmented
YoY growth 2025-2026(%) 21.8%
Key countries Indonesia, China, Japan, India, South Korea, Australia, US, Canada, Mexico, Italy, Germany, UK, France, Spain, The Netherlands, Chile, Brazil, Argentina, Turkey, South Africa, Saudi Arabia, UAE and Israel
Competitive landscape Leading Companies, Market Positioning of Companies, Competitive Strategies, and Industry Risks

Request Free Sample

Research Analyst Overview

  • The market's strategic value lies in its high capacity factor, often exceeding 90%, a critical metric for boardroom decisions on geothermal project financing. This reliability stems from mature technologies like flash steam technology in high-enthalpy systems and classic dry steam reservoirs.
  • The future, however, is in enhanced geothermal systems (egs) leveraging advanced drilling techniques like hydraulic fracturing in egs to access hot dry rock (hdr). Binary cycle power plants, using organic rankine cycle (orc) technology with components like geothermal turbines, heat exchangers, and condensing units, are key to exploiting low-enthalpy resources and geopressured systems.
  • Successful geothermal development hinges on managing geothermal exploration risk through resource assessment and reservoir engineering, from exploration drilling and well stimulation to operating production wells and injection wells. Managing geothermal fluids and geothermal brine with robust wellhead equipment and steam separators is crucial.
  • The market is also expanding into hybrid geothermal plants, direct-use geothermal for geothermal district heating, and even supercritical geothermal resources. All this relies on a stable geothermal power purchase agreement (ppa) and integrating solutions like thermal energy storage with the power generation equipment.

What are the Key Data Covered in this Geothermal Power Market Research and Growth Report?

  • What is the expected growth of the Geothermal Power Market between 2026 and 2030?

    • USD 19.41 billion, at a CAGR of 27.8%

  • What segmentation does the market report cover?

    • The report is segmented by Type (Flash, Binary, and Dry steam), End-user (Industrial, Commercial, and Residential), Resource Type (Low temperature, Medium temperature, and High temperature) and Geography (APAC, North America, Europe, South America, Middle East and Africa)

  • Which regions are analyzed in the report?

    • APAC, North America, Europe, South America and Middle East and Africa

  • What are the key growth drivers and market challenges?

    • Demand for clean baseload power, High upfront capital and exploration risk

  • Who are the major players in the Geothermal Power Market?

    • Aboitiz Power Corp., Calpine Corp., Cyrq Energy Inc., DEEP Corp., Enel Spa, EnergySource LLC, Fervo Energy, First Gen Corp., Fuji Electric Co. Ltd., General Electric Co., HS Orka, Kenya Electricity Co. Ltd., KYUSHU ELECTRIC POWER CO. INC., Mitsubishi Heavy Ltd., Ormat Technologies Inc., PT Pertamina Geothermal Energy, Reykjavik Geothermal, Star Energy Geothermal Ltd. and Toshiba Corp.

Market Research Insights

  • Driven by aggressive decarbonization strategies and the pursuit of energy independence, the market for this sustainable energy source is expanding. Geothermal energy policy supports its role in the clean energy transition, providing renewable baseload power for electricity grid reliability and crucial grid stability solutions. Utility-scale projects are central to net-zero emissions targets, offering clean firm power that intermittent renewables cannot.
  • Corporate energy procurement is rising, especially for industrial decarbonization and direct air capture (dac). Advanced geothermal technology is unlocking significant geothermal resource potential, enabling next-generation geothermal development. This includes geothermal heating and cooling, geothermal lithium extraction, and green hydrogen production. These projects rely on robust reservoir management techniques and contribute to both energy security and sustainable infrastructure.

We can help! Our analysts can customize this geothermal power market research report to meet your requirements.

Get in touch

1. Executive Summary

1.1 Market overview

Executive Summary - Chart on Market Overview
Executive Summary - Data Table on Market Overview
Executive Summary - Chart on Global Market Characteristics
Executive Summary - Chart on Market by Geography
Executive Summary - Chart on Market Segmentation by Type
Executive Summary - Chart on Market Segmentation by End-user
Executive Summary - Chart on Market Segmentation by Resource Type
Executive Summary - Chart on Incremental Growth
Executive Summary - Data Table on Incremental Growth
Executive Summary - Chart on Company Market Positioning

2. Technavio Analysis

2.1 Analysis of price sensitivity, lifecycle, customer purchase basket, adoption rates, and purchase criteria

2.2 Criticality of inputs and Factors of differentiation

Chart on Overview on criticality of inputs and factors of differentiation

2.3 Factors of disruption

Chart on Overview on factors of disruption

2.4 Impact of drivers and challenges

Chart on Impact of drivers and challenges in 2025 and 2030

3. Market Landscape

3.1 Market ecosystem

Chart on Parent Market
Data Table on - Parent Market

3.2 Market characteristics

Chart on Market characteristics analysis

3.3 Value chain analysis

Chart on Value chain analysis

4. Market Sizing

4.1 Market definition

Data Table on Offerings of companies included in the market definition

4.2 Market segment analysis

Market segments

4.3 Market size 2025

4.4 Market outlook: Forecast for 2025-2030

Chart on Global - Market size and forecast 2025-2030 ($ million)
Data Table on Global - Market size and forecast 2025-2030 ($ million)
Chart on Global Market: Year-over-year growth 2025-2030 (%)
Data Table on Global Market: Year-over-year growth 2025-2030 (%)

5. Historic Market Size

5.1 Global Geothermal Power Market 2020 - 2024

Historic Market Size - Data Table on Global Geothermal Power Market 2020 - 2024 ($ million)

5.2 Type segment analysis 2020 - 2024

Historic Market Size - Type Segment 2020 - 2024 ($ million)

5.3 End-user segment analysis 2020 - 2024

Historic Market Size - End-user Segment 2020 - 2024 ($ million)

5.4 Resource Type segment analysis 2020 - 2024

Historic Market Size - Resource Type Segment 2020 - 2024 ($ million)

5.5 Geography segment analysis 2020 - 2024

Historic Market Size - Geography Segment 2020 - 2024 ($ million)

5.6 Country segment analysis 2020 - 2024

Historic Market Size - Country Segment 2020 - 2024 ($ million)

6. Qualitative Analysis

6.1 The AI impact on Global Geothermal Power Market

7. Five Forces Analysis

7.1 Five forces summary

Five forces analysis - Comparison between 2025 and 2030

7.2 Bargaining power of buyers

Bargaining power of buyers - Impact of key factors 2025 and 2030

7.3 Bargaining power of suppliers

Bargaining power of suppliers - Impact of key factors in 2025 and 2030

7.4 Threat of new entrants

Threat of new entrants - Impact of key factors in 2025 and 2030

7.5 Threat of substitutes

Threat of substitutes - Impact of key factors in 2025 and 2030

7.6 Threat of rivalry

Threat of rivalry - Impact of key factors in 2025 and 2030

7.7 Market condition

Chart on Market condition - Five forces 2025 and 2030

8. Market Segmentation by Type

8.1 Market segments

Chart on Type - Market share 2025-2030 (%)
Data Table on Type - Market share 2025-2030 (%)

8.2 Comparison by Type

Chart on Comparison by Type
Data Table on Comparison by Type

8.3 Flash - Market size and forecast 2025-2030

Chart on Flash - Market size and forecast 2025-2030 ($ million)
Data Table on Flash - Market size and forecast 2025-2030 ($ million)
Chart on Flash - Year-over-year growth 2025-2030 (%)
Data Table on Flash - Year-over-year growth 2025-2030 (%)

8.4 Binary - Market size and forecast 2025-2030

Chart on Binary - Market size and forecast 2025-2030 ($ million)
Data Table on Binary - Market size and forecast 2025-2030 ($ million)
Chart on Binary - Year-over-year growth 2025-2030 (%)
Data Table on Binary - Year-over-year growth 2025-2030 (%)

8.5 Dry steam - Market size and forecast 2025-2030

Chart on Dry steam - Market size and forecast 2025-2030 ($ million)
Data Table on Dry steam - Market size and forecast 2025-2030 ($ million)
Chart on Dry steam - Year-over-year growth 2025-2030 (%)
Data Table on Dry steam - Year-over-year growth 2025-2030 (%)

8.6 Market opportunity by Type

Market opportunity by Type ($ million)
Data Table on Market opportunity by Type ($ million)

9. Market Segmentation by End-user

9.1 Market segments

Chart on End-user - Market share 2025-2030 (%)
Data Table on End-user - Market share 2025-2030 (%)

9.2 Comparison by End-user

Chart on Comparison by End-user
Data Table on Comparison by End-user

9.3 Industrial - Market size and forecast 2025-2030

Chart on Industrial - Market size and forecast 2025-2030 ($ million)
Data Table on Industrial - Market size and forecast 2025-2030 ($ million)
Chart on Industrial - Year-over-year growth 2025-2030 (%)
Data Table on Industrial - Year-over-year growth 2025-2030 (%)

9.4 Commercial - Market size and forecast 2025-2030

Chart on Commercial - Market size and forecast 2025-2030 ($ million)
Data Table on Commercial - Market size and forecast 2025-2030 ($ million)
Chart on Commercial - Year-over-year growth 2025-2030 (%)
Data Table on Commercial - Year-over-year growth 2025-2030 (%)

9.5 Residential - Market size and forecast 2025-2030

Chart on Residential - Market size and forecast 2025-2030 ($ million)
Data Table on Residential - Market size and forecast 2025-2030 ($ million)
Chart on Residential - Year-over-year growth 2025-2030 (%)
Data Table on Residential - Year-over-year growth 2025-2030 (%)

9.6 Market opportunity by End-user

Market opportunity by End-user ($ million)
Data Table on Market opportunity by End-user ($ million)

10. Market Segmentation by Resource Type

10.1 Market segments

Chart on Resource Type - Market share 2025-2030 (%)
Data Table on Resource Type - Market share 2025-2030 (%)

10.2 Comparison by Resource Type

Chart on Comparison by Resource Type
Data Table on Comparison by Resource Type

10.3 Low temperature - Market size and forecast 2025-2030

Chart on Low temperature - Market size and forecast 2025-2030 ($ million)
Data Table on Low temperature - Market size and forecast 2025-2030 ($ million)
Chart on Low temperature - Year-over-year growth 2025-2030 (%)
Data Table on Low temperature - Year-over-year growth 2025-2030 (%)

10.4 Medium temperature - Market size and forecast 2025-2030

Chart on Medium temperature - Market size and forecast 2025-2030 ($ million)
Data Table on Medium temperature - Market size and forecast 2025-2030 ($ million)
Chart on Medium temperature - Year-over-year growth 2025-2030 (%)
Data Table on Medium temperature - Year-over-year growth 2025-2030 (%)

10.5 High temperature - Market size and forecast 2025-2030

Chart on High temperature - Market size and forecast 2025-2030 ($ million)
Data Table on High temperature - Market size and forecast 2025-2030 ($ million)
Chart on High temperature - Year-over-year growth 2025-2030 (%)
Data Table on High temperature - Year-over-year growth 2025-2030 (%)

10.6 Market opportunity by Resource Type

Market opportunity by Resource Type ($ million)
Data Table on Market opportunity by Resource Type ($ million)

11. Customer Landscape

11.1 Customer landscape overview

Analysis of price sensitivity, lifecycle, customer purchase basket, adoption rates, and purchase criteria

12. Geographic Landscape

12.1 Geographic segmentation

Chart on Market share by geography 2025-2030 (%)
Data Table on Market share by geography 2025-2030 (%)

12.2 Geographic comparison

Chart on Geographic comparison
Data Table on Geographic comparison

12.3 APAC - Market size and forecast 2025-2030

Chart on APAC - Market size and forecast 2025-2030 ($ million)
Data Table on APAC - Market size and forecast 2025-2030 ($ million)
Chart on APAC - Year-over-year growth 2025-2030 (%)
Data Table on APAC - Year-over-year growth 2025-2030 (%)
Chart on Regional Comparison - APAC
Data Table on Regional Comparison - APAC

12.3.1 Indonesia - Market size and forecast 2025-2030

Chart on Indonesia - Market size and forecast 2025-2030 ($ million)
Data Table on Indonesia - Market size and forecast 2025-2030 ($ million)
Chart on Indonesia - Year-over-year growth 2025-2030 (%)
Data Table on Indonesia - Year-over-year growth 2025-2030 (%)

12.3.2 China - Market size and forecast 2025-2030

Chart on China - Market size and forecast 2025-2030 ($ million)
Data Table on China - Market size and forecast 2025-2030 ($ million)
Chart on China - Year-over-year growth 2025-2030 (%)
Data Table on China - Year-over-year growth 2025-2030 (%)

12.3.3 Japan - Market size and forecast 2025-2030

Chart on Japan - Market size and forecast 2025-2030 ($ million)
Data Table on Japan - Market size and forecast 2025-2030 ($ million)
Chart on Japan - Year-over-year growth 2025-2030 (%)
Data Table on Japan - Year-over-year growth 2025-2030 (%)

12.3.4 India - Market size and forecast 2025-2030

Chart on India - Market size and forecast 2025-2030 ($ million)
Data Table on India - Market size and forecast 2025-2030 ($ million)
Chart on India - Year-over-year growth 2025-2030 (%)
Data Table on India - Year-over-year growth 2025-2030 (%)

12.3.5 South Korea - Market size and forecast 2025-2030

Chart on South Korea - Market size and forecast 2025-2030 ($ million)
Data Table on South Korea - Market size and forecast 2025-2030 ($ million)
Chart on South Korea - Year-over-year growth 2025-2030 (%)
Data Table on South Korea - Year-over-year growth 2025-2030 (%)

12.3.6 Australia - Market size and forecast 2025-2030

Chart on Australia - Market size and forecast 2025-2030 ($ million)
Data Table on Australia - Market size and forecast 2025-2030 ($ million)
Chart on Australia - Year-over-year growth 2025-2030 (%)
Data Table on Australia - Year-over-year growth 2025-2030 (%)

12.4 North America - Market size and forecast 2025-2030

Chart on North America - Market size and forecast 2025-2030 ($ million)
Data Table on North America - Market size and forecast 2025-2030 ($ million)
Chart on North America - Year-over-year growth 2025-2030 (%)
Data Table on North America - Year-over-year growth 2025-2030 (%)
Chart on Regional Comparison - North America
Data Table on Regional Comparison - North America

12.4.1 US - Market size and forecast 2025-2030

Chart on US - Market size and forecast 2025-2030 ($ million)
Data Table on US - Market size and forecast 2025-2030 ($ million)
Chart on US - Year-over-year growth 2025-2030 (%)
Data Table on US - Year-over-year growth 2025-2030 (%)

12.4.2 Canada - Market size and forecast 2025-2030

Chart on Canada - Market size and forecast 2025-2030 ($ million)
Data Table on Canada - Market size and forecast 2025-2030 ($ million)
Chart on Canada - Year-over-year growth 2025-2030 (%)
Data Table on Canada - Year-over-year growth 2025-2030 (%)

12.4.3 Mexico - Market size and forecast 2025-2030

Chart on Mexico - Market size and forecast 2025-2030 ($ million)
Data Table on Mexico - Market size and forecast 2025-2030 ($ million)
Chart on Mexico - Year-over-year growth 2025-2030 (%)
Data Table on Mexico - Year-over-year growth 2025-2030 (%)

12.5 Europe - Market size and forecast 2025-2030

Chart on Europe - Market size and forecast 2025-2030 ($ million)
Data Table on Europe - Market size and forecast 2025-2030 ($ million)
Chart on Europe - Year-over-year growth 2025-2030 (%)
Data Table on Europe - Year-over-year growth 2025-2030 (%)
Chart on Regional Comparison - Europe
Data Table on Regional Comparison - Europe

12.5.1 Italy - Market size and forecast 2025-2030

Chart on Italy - Market size and forecast 2025-2030 ($ million)
Data Table on Italy - Market size and forecast 2025-2030 ($ million)
Chart on Italy - Year-over-year growth 2025-2030 (%)
Data Table on Italy - Year-over-year growth 2025-2030 (%)

12.5.2 Germany - Market size and forecast 2025-2030

Chart on Germany - Market size and forecast 2025-2030 ($ million)
Data Table on Germany - Market size and forecast 2025-2030 ($ million)
Chart on Germany - Year-over-year growth 2025-2030 (%)
Data Table on Germany - Year-over-year growth 2025-2030 (%)

12.5.3 UK - Market size and forecast 2025-2030

Chart on UK - Market size and forecast 2025-2030 ($ million)
Data Table on UK - Market size and forecast 2025-2030 ($ million)
Chart on UK - Year-over-year growth 2025-2030 (%)
Data Table on UK - Year-over-year growth 2025-2030 (%)

12.5.4 France - Market size and forecast 2025-2030

Chart on France - Market size and forecast 2025-2030 ($ million)
Data Table on France - Market size and forecast 2025-2030 ($ million)
Chart on France - Year-over-year growth 2025-2030 (%)
Data Table on France - Year-over-year growth 2025-2030 (%)

12.5.5 Spain - Market size and forecast 2025-2030

Chart on Spain - Market size and forecast 2025-2030 ($ million)
Data Table on Spain - Market size and forecast 2025-2030 ($ million)
Chart on Spain - Year-over-year growth 2025-2030 (%)
Data Table on Spain - Year-over-year growth 2025-2030 (%)

12.5.6 The Netherlands - Market size and forecast 2025-2030

Chart on The Netherlands - Market size and forecast 2025-2030 ($ million)
Data Table on The Netherlands - Market size and forecast 2025-2030 ($ million)
Chart on The Netherlands - Year-over-year growth 2025-2030 (%)
Data Table on The Netherlands - Year-over-year growth 2025-2030 (%)

12.6 South America - Market size and forecast 2025-2030

Chart on South America - Market size and forecast 2025-2030 ($ million)
Data Table on South America - Market size and forecast 2025-2030 ($ million)
Chart on South America - Year-over-year growth 2025-2030 (%)
Data Table on South America - Year-over-year growth 2025-2030 (%)
Chart on Regional Comparison - South America
Data Table on Regional Comparison - South America

12.6.1 Chile - Market size and forecast 2025-2030

Chart on Chile - Market size and forecast 2025-2030 ($ million)
Data Table on Chile - Market size and forecast 2025-2030 ($ million)
Chart on Chile - Year-over-year growth 2025-2030 (%)
Data Table on Chile - Year-over-year growth 2025-2030 (%)

12.6.2 Brazil - Market size and forecast 2025-2030

Chart on Brazil - Market size and forecast 2025-2030 ($ million)
Data Table on Brazil - Market size and forecast 2025-2030 ($ million)
Chart on Brazil - Year-over-year growth 2025-2030 (%)
Data Table on Brazil - Year-over-year growth 2025-2030 (%)

12.6.3 Argentina - Market size and forecast 2025-2030

Chart on Argentina - Market size and forecast 2025-2030 ($ million)
Data Table on Argentina - Market size and forecast 2025-2030 ($ million)
Chart on Argentina - Year-over-year growth 2025-2030 (%)
Data Table on Argentina - Year-over-year growth 2025-2030 (%)

12.7 Middle East and Africa - Market size and forecast 2025-2030

Chart on Middle East and Africa - Market size and forecast 2025-2030 ($ million)
Data Table on Middle East and Africa - Market size and forecast 2025-2030 ($ million)
Chart on Middle East and Africa - Year-over-year growth 2025-2030 (%)
Data Table on Middle East and Africa - Year-over-year growth 2025-2030 (%)
Chart on Regional Comparison - Middle East and Africa
Data Table on Regional Comparison - Middle East and Africa

12.7.1 Turkey - Market size and forecast 2025-2030

Chart on Turkey - Market size and forecast 2025-2030 ($ million)
Data Table on Turkey - Market size and forecast 2025-2030 ($ million)
Chart on Turkey - Year-over-year growth 2025-2030 (%)
Data Table on Turkey - Year-over-year growth 2025-2030 (%)

12.7.2 South Africa - Market size and forecast 2025-2030

Chart on South Africa - Market size and forecast 2025-2030 ($ million)
Data Table on South Africa - Market size and forecast 2025-2030 ($ million)
Chart on South Africa - Year-over-year growth 2025-2030 (%)
Data Table on South Africa - Year-over-year growth 2025-2030 (%)

12.7.3 Saudi Arabia - Market size and forecast 2025-2030

Chart on Saudi Arabia - Market size and forecast 2025-2030 ($ million)
Data Table on Saudi Arabia - Market size and forecast 2025-2030 ($ million)
Chart on Saudi Arabia - Year-over-year growth 2025-2030 (%)
Data Table on Saudi Arabia - Year-over-year growth 2025-2030 (%)

12.7.4 UAE - Market size and forecast 2025-2030

Chart on UAE - Market size and forecast 2025-2030 ($ million)
Data Table on UAE - Market size and forecast 2025-2030 ($ million)
Chart on UAE - Year-over-year growth 2025-2030 (%)
Data Table on UAE - Year-over-year growth 2025-2030 (%)

12.7.5 Israel - Market size and forecast 2025-2030

Chart on Israel - Market size and forecast 2025-2030 ($ million)
Data Table on Israel - Market size and forecast 2025-2030 ($ million)
Chart on Israel - Year-over-year growth 2025-2030 (%)
Data Table on Israel - Year-over-year growth 2025-2030 (%)

12.8 Market opportunity by geography

Market opportunity by geography ($ million)
Data Tables on Market opportunity by geography ($ million)

13. Drivers, Challenges, and Opportunity

13.1 Market drivers

Demand for clean baseload power
Technological advancements in EGS
Corporate and data center energy procurement

13.2 Market challenges

High upfront capital and exploration risk
Complex permitting and regulatory delays
Grid interconnection and transmission bottlenecks

13.3 Impact of drivers and challenges

Impact of drivers and challenges in 2025 and 2030

13.4 Market opportunities

Technological innovations enhancing geothermal energy extraction
Increasing global demand for clean and reliable energy
Expansion of market applications and investment in infrastructure

14. Competitive Landscape

14.1 Overview

14.2

Overview on criticality of inputs and factors of differentiation

14.3 Landscape disruption

Overview on factors of disruption

14.4 Industry risks

Impact of key risks on business

15. Competitive Analysis

15.1 Companies profiled

Companies covered

15.2 Company ranking index

15.3 Market positioning of companies

Matrix on companies position and classification

15.4 Aboitiz Power Corp.

Aboitiz Power Corp. - Overview
Aboitiz Power Corp. - Business segments
Aboitiz Power Corp. - Key offerings
Aboitiz Power Corp. - Segment focus
SWOT

15.5 Calpine Corp.

Calpine Corp. - Overview
Calpine Corp. - Product / Service
Calpine Corp. - Key offerings
SWOT

15.6 Cyrq Energy Inc.

Cyrq Energy Inc. - Overview
Cyrq Energy Inc. - Product / Service
Cyrq Energy Inc. - Key offerings
SWOT

15.7 Enel Spa

Enel Spa - Overview
Enel Spa - Product / Service
Enel Spa - Key news
Enel Spa - Key offerings
SWOT

15.8 Fervo Energy

Fervo Energy - Overview
Fervo Energy - Product / Service
Fervo Energy - Key offerings
SWOT

15.9 First Gen Corp.

First Gen Corp. - Overview
First Gen Corp. - Product / Service
First Gen Corp. - Key offerings
SWOT

15.10 Fuji Electric Co. Ltd.

Fuji Electric Co. Ltd. - Overview
Fuji Electric Co. Ltd. - Business segments
Fuji Electric Co. Ltd. - Key news
Fuji Electric Co. Ltd. - Key offerings
Fuji Electric Co. Ltd. - Segment focus
SWOT

15.11 HS Orka

HS Orka - Overview
HS Orka - Product / Service
HS Orka - Key offerings
SWOT

15.12 Kenya Electricity Co. Ltd.

Kenya Electricity Co. Ltd. - Overview
Kenya Electricity Co. Ltd. - Product / Service
Kenya Electricity Co. Ltd. - Key offerings
SWOT

15.13 KYUSHU ELECTRIC POWER CO. INC.

KYUSHU ELECTRIC POWER CO. INC. - Overview
KYUSHU ELECTRIC POWER CO. INC. - Business segments
KYUSHU ELECTRIC POWER CO. INC. - Key offerings
KYUSHU ELECTRIC POWER CO. INC. - Segment focus
SWOT

15.14 Mitsubishi Heavy Ltd.

Mitsubishi Heavy Ltd. - Overview
Mitsubishi Heavy Ltd. - Business segments
Mitsubishi Heavy Ltd. - Key news
Mitsubishi Heavy Ltd. - Key offerings
Mitsubishi Heavy Ltd. - Segment focus
SWOT

15.15 Ormat Technologies Inc.

Ormat Technologies Inc. - Overview
Ormat Technologies Inc. - Business segments
Ormat Technologies Inc. - Key offerings
Ormat Technologies Inc. - Segment focus
SWOT

15.16 PT Pertamina Geothermal Energy

PT Pertamina Geothermal Energy - Overview
PT Pertamina Geothermal Energy - Product / Service
PT Pertamina Geothermal Energy - Key offerings
SWOT

15.17 Reykjavik Geothermal

Reykjavik Geothermal - Overview
Reykjavik Geothermal - Product / Service
Reykjavik Geothermal - Key offerings
SWOT

15.18 Star Energy Geothermal Ltd.

Star Energy Geothermal Ltd. - Overview
Star Energy Geothermal Ltd. - Product / Service
Star Energy Geothermal Ltd. - Key offerings
SWOT

16. Appendix

16.1 Scope of the report

Market definition
Objectives
Notes and caveats

16.2 Inclusions and exclusions checklist

Inclusions checklist
Exclusions checklist

16.3 Currency conversion rates for US$

16.4 Research methodology

16.5 Data procurement

Information sources

16.6 Data validation

16.7 Validation techniques employed for market sizing

16.8 Data synthesis

16.9 360 degree market analysis

16.10 List of abbreviations

Research Methodology

Technavio presents a detailed picture of the market by way of study, synthesis, and summation of data from multiple sources. The analysts have presented the various facets of the market with a particular focus on identifying the key industry influencers. The data thus presented is comprehensive, reliable, and the result of extensive research, both primary and secondary.

INFORMATION SOURCES

Primary sources

  • Manufacturers and suppliers
  • Channel partners
  • Industry experts
  • Strategic decision makers

Secondary sources

  • Industry journals and periodicals
  • Government data
  • Financial reports of key industry players
  • Historical data
  • Press releases

DATA ANALYSIS

Data Synthesis

  • Collation of data
  • Estimation of key figures
  • Analysis of derived insights

Data Validation

  • Triangulation with data models
  • Reference against proprietary databases
  • Corroboration with industry experts

REPORT WRITING

Qualitative

  • Market drivers
  • Market challenges
  • Market trends
  • Five forces analysis

Quantitative

  • Market size and forecast
  • Market segmentation
  • Geographical insights
  • Competitive landscape

Interested in this report?

Get your sample now to see our research methodology and insights!

Download Now

Frequently Asked Questions

Geothermal Power market growth will increase by USD 19414.0 million during 2026-2030.

The Geothermal Power market is expected to grow at a CAGR of 27.8% during 2026-2030.

Geothermal Power market is segmented by Type (Flash, Binary, Dry steam) End-user (Industrial, Commercial, Residential) Resource type (Low temperature, Medium temperature, High temperature)

Aboitiz Power Corp., Calpine Corp., Cyrq Energy Inc., DEEP Corp., Enel Spa, EnergySource LLC, Fervo Energy, First Gen Corp., Fuji Electric Co. Ltd., General Electric Co., HS Orka, Kenya Electricity Co. Ltd., KYUSHU ELECTRIC POWER CO. INC., Mitsubishi Heavy Ltd., Ormat Technologies Inc., PT Pertamina Geothermal Energy, Reykjavik Geothermal, Star Energy Geothermal Ltd., Toshiba Corp. are a few of the key vendors in the Geothermal Power market.

APAC will register the highest growth rate of 36.7% among the other regions. Therefore, the Geothermal Power market in APAC is expected to garner significant business opportunities for the vendors during the forecast period.

Indonesia, China, Japan, India, South Korea, Australia, US, Canada, Mexico, Italy, Germany, UK, France, Spain, The Netherlands, Chile, Brazil, Argentina, Turkey, South Africa, Saudi Arabia, UAE, Israel

  • Demand for clean baseload power is the driving factor this market.

The Geothermal Power market vendors should focus on grabbing business opportunities from the Type segment as it accounted for the largest market share in the base year.