Generative AI In Pharmaceutical Industry Market Analysis, Size, and Forecast 2025-2029: North America (US, Canada, and Mexico), Europe (Germany, France, and UK), APAC (China, India, and Japan), Middle East and Africa (Saudi Arabia, UAE, and South Africa), South America (Brazil, Argentina, and Colombia), and Rest of World (ROW)

Generative AI In Pharmaceutical Industry Market Analysis, Size, and Forecast 2025-2029:
North America (US, Canada, and Mexico), Europe (Germany, France, and UK), APAC (China, India, and Japan), Middle East and Africa (Saudi Arabia, UAE, and South Africa), South America (Brazil, Argentina, and Colombia), and Rest of World (ROW)

Published: Dec 2025 306 Pages SKU: IRTNTR81113

Market Overview at a Glance

$5.38 B
Market Opportunity
26.1%
CAGR 2024 - 2029
44.1%
North America Growth
$791.7 Mn
Text generation segment 2023

Generative AI In Pharmaceutical Industry Market Size 2025-2029

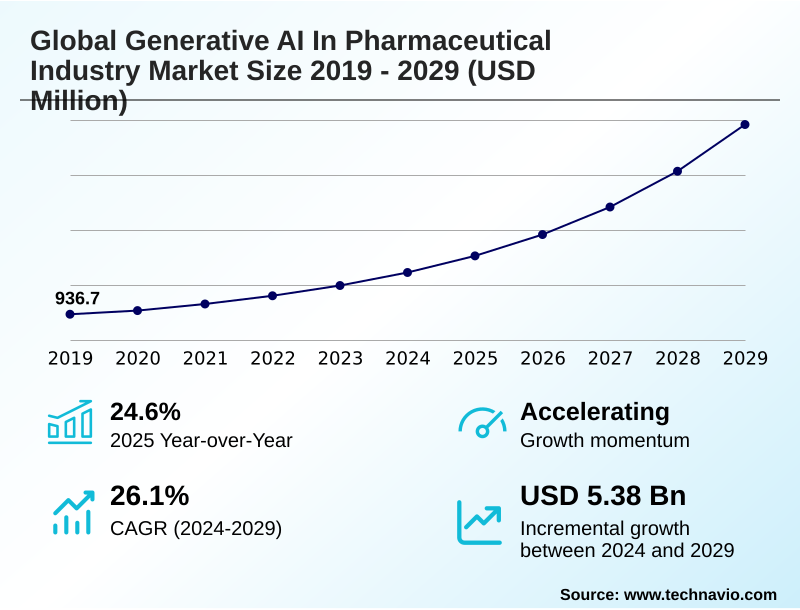
The generative ai in pharmaceutical industry market size is valued to increase by USD 5.38 billion, at a CAGR of 26.1% from 2024 to 2029. Accelerating drug discovery and development will drive the generative ai in pharmaceutical industry market.

Major Market Trends & Insights

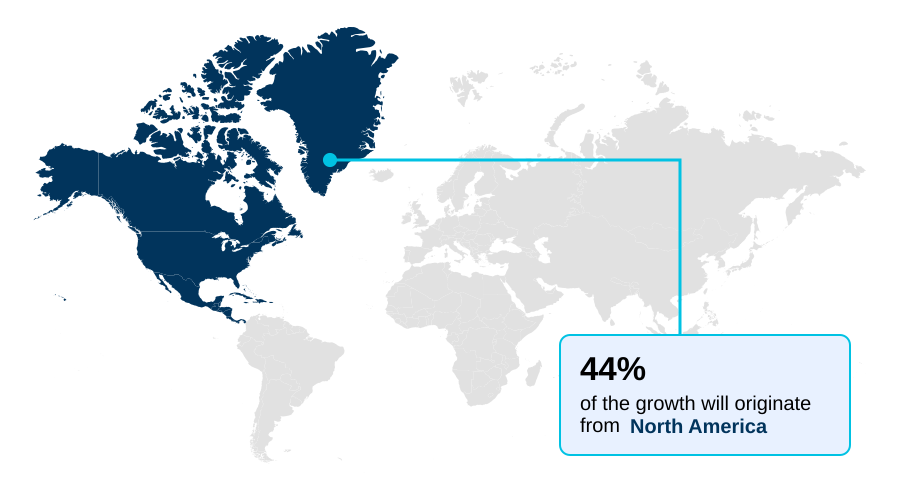
  • North America dominated the market and accounted for a 44.1% growth during the forecast period.
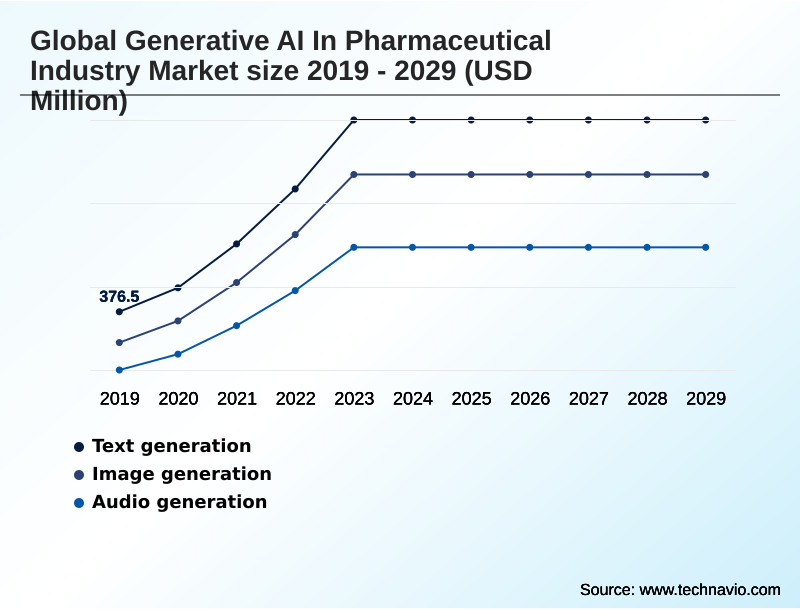
  • By Method - Text generation segment was valued at USD 791.7 million in 2023
  • By Application - Commercial segment accounted for the largest market revenue share in 2023

Market Size & Forecast

  • Market Opportunities: USD 6.90 billion
  • Market Future Opportunities: USD 5.38 billion
  • CAGR from 2024 to 2029 : 26.1%

Market Summary

  • The Generative AI in pharmaceutical industry market is fundamentally altering the R&D paradigm by enabling capabilities that were previously unfeasible. At its core, the technology leverages deep learning algorithms and predictive modeling to accelerate timelines, from initial target identification to late-stage clinical trials.
  • A key application is de novo drug design, where models create novel molecular structures with desired therapeutic properties, moving beyond the limitations of traditional screening. This is complemented by the use of synthetic patient data, which helps train algorithms for rare diseases without compromising privacy.
  • One common business scenario involves a company using natural language processing for clinical trial optimization, analyzing electronic health records to identify and recruit eligible patients with greater speed and precision than manual methods. While this accelerates enrollment, firms must concurrently implement robust frameworks like federated learning to manage data security and navigate the complex web of regulatory compliance.
  • The effective use of these technologies, including vocal biomarkers and pharmacovigilance, is becoming a critical differentiator in the competitive Generative AI in pharmaceutical industry market.

What will be the Size of the Generative AI In Pharmaceutical Industry Market during the forecast period?

Get Key Insights on Market Forecast (PDF) Request Free Sample

How is the Generative AI In Pharmaceutical Industry Market Segmented?

The generative ai in pharmaceutical industry industry research report provides comprehensive data (region-wise segment analysis), with forecasts and estimates in "USD million" for the period 2025-2029, as well as historical data from 2019-2023 for the following segments.

  • Method
    • Text generation
    • Image generation
    • Audio generation
  • Application
    • Commercial
    • Drug discovery
    • Clinical development
    • Research and development
    • Operations
  • Technology
    • Deep learning models
    • Natural language processing
    • Generative adversarial networks
    • Variational autoencoders
    • Others
  • Geography
    • North America
      • US
      • Canada
      • Mexico
    • Europe
      • Germany
      • France
      • UK
    • APAC
      • China
      • India
      • Japan
    • Middle East and Africa
      • Saudi Arabia
      • UAE
      • South Africa
    • South America
      • Brazil
      • Argentina
      • Colombia
    • Rest of World (ROW)

By Method Insights

The text generation segment is estimated to witness significant growth during the forecast period.

The Generative AI in the pharmaceutical industry market is segmented by several methods, with text generation being a important component. This method leverages natural language processing and real-world evidence analysis to automate complex, language-based tasks.

Organizations utilize this for clinical study report automation and to generate regulatory submissions, achieving efficiency gains that can reduce submission timelines by as much as 40%.

The technology is also pivotal for precision medicine enablement, powering prognostic management programs and the automated molecule generation of descriptive outputs from complex datasets.

The application of AI in medical and regulatory writing, supported by NLP for clinical notes analysis and real-world data integration, is reshaping how scientific and clinical information is processed and communicated, enabling faster development cycles.

Request Free Sample

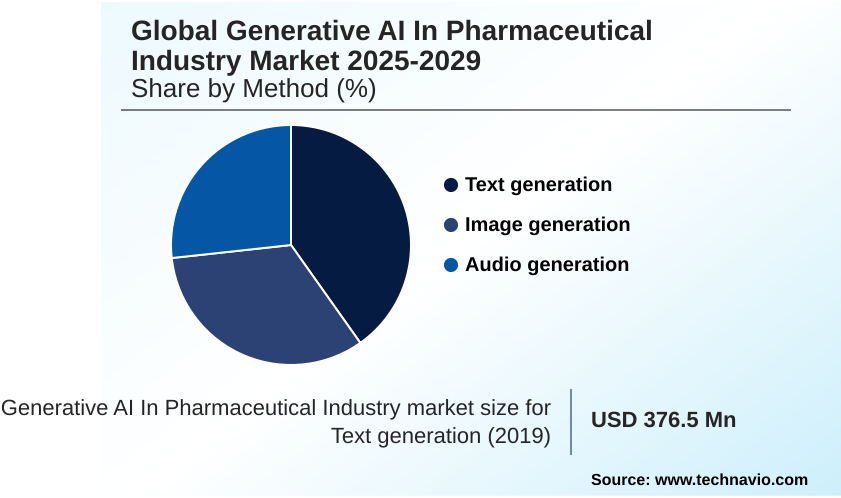
The Text generation segment was valued at USD 791.7 million in 2023 and showed a gradual increase during the forecast period.

Request Free Sample

Regional Analysis

North America is estimated to contribute 44.1% to the growth of the global market during the forecast period.Technavio’s analysts have elaborately explained the regional trends and drivers that shape the market during the forecast period.

See How Generative AI In Pharmaceutical Industry Market Demand is Rising in North America Request Free Sample

The geographic landscape of the generative AI in the pharmaceutical industry market is characterized by distinct regional strengths and growth trajectories.

North America is set to contribute over 44% of the market's incremental growth, driven by substantial venture capital, advanced high-performance computing infrastructure, and a high concentration of pharmaceutical leaders and AI startups.

This region excels in clinical trial optimization and AI-powered drug research. Concurrently, the APAC region is projected to exhibit the fastest adoption rate, fueled by government initiatives and a focus on digital health.

This growth is supported by expanding real-world evidence analysis and a burgeoning ecosystem for AI-powered target validation. Europe maintains a strong position with its focus on regulatory frameworks and collaborative research, particularly in areas like drug repurposing and protein engineering.

Across all regions, the focus is on leveraging AI for faster target identification and development.

Market Dynamics

Our researchers analyzed the data with 2024 as the base year, along with the key drivers, trends, and challenges. A holistic analysis of drivers will help companies refine their marketing strategies to gain a competitive advantage.

  • The integration of advanced computational methods is reshaping the entire pharmaceutical value chain, from initial discovery to post-market surveillance. The use of generative adversarial networks for drug discovery and variational autoencoders in molecular design are becoming central to creating novel therapeutics.
  • These technologies enable de novo drug design for small molecules and are increasingly applied to designing biologics with generative models. In early stages, AI-powered target identification and validation, combined with high-performance computing for molecular simulation, significantly shorten exploratory phases. As candidates progress, the focus shifts to optimizing clinical trials with predictive AI.
  • This includes using NLP for clinical trial recruitment and generating synthetic control arms for trials, which is particularly valuable for rare diseases. Applying deep learning to pathology images helps in biomarker discovery and patient stratification. Throughout this process, enhancing pharmacovigilance with natural language processing and improving supply chain forecasting with AI ensure operational efficiency and safety.
  • Cross-cutting concerns such as federated learning for pharmaceutical data privacy and mitigating algorithmic bias in AI drug models are critical for responsible deployment. This integrated approach has shown the potential to reduce preclinical timelines to under 18 months, a fraction of the traditional multi-year average, fundamentally accelerating drug development with synthetic data.

What are the key market drivers leading to the rise in the adoption of Generative AI In Pharmaceutical Industry Industry?

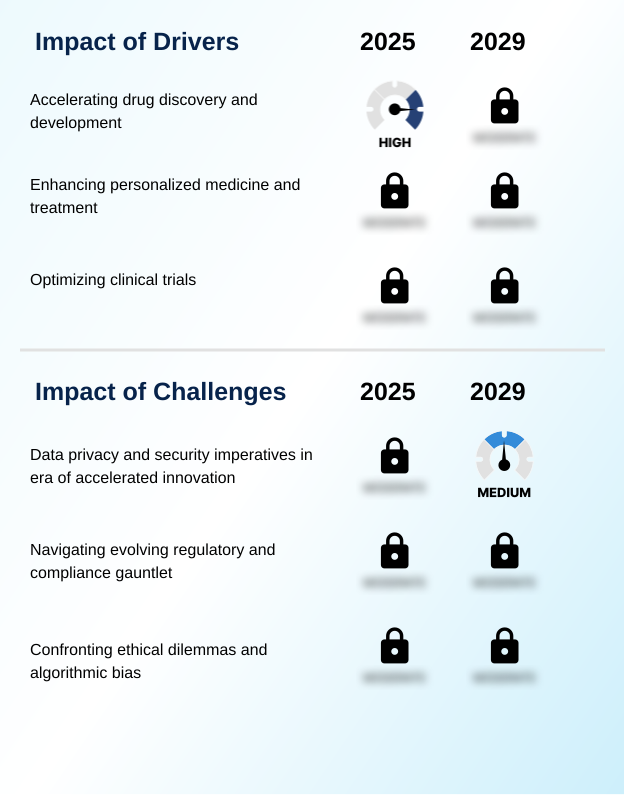
  • The capability to significantly accelerate drug discovery and development timelines is a primary driver for the generative AI in the pharmaceutical industry market.

  • The primary drivers of the generative AI in pharmaceutical industry market are its capabilities to accelerate discovery timelines and enable highly personalized therapies.
  • The application of de novo drug design, including de novo antibody design, is a major factor, with demonstrated successes in bringing a novel drug candidate from discovery to preclinical stages in under eighteen months.
  • This acceleration is creating a paradigm shift in how small molecule therapeutics are developed. Concurrently, the drive for precision medicine enablement is fueling adoption, as evidenced by the significantly higher number of novel personalized therapies approved in recent years.
  • Generative AI allows for the creation of synthetic control arms, making patient-centered trial design more feasible, especially for rare diseases. The technology's capacity to generate new molecular structures and support machine learning for drug repurposing is fundamentally reshaping R&D productivity.

What are the market trends shaping the Generative AI In Pharmaceutical Industry Industry?

  • A key trend is the revolutionizing of medical and regulatory writing through generative AI. This application significantly streamlines document creation, accelerating regulatory approvals and scientific communications.

  • Key trends in the generative AI in pharmaceutical industry market are centered on operational automation and enhanced efficiency across the value chain. The adoption of AI-optimized supply chain management is proving transformative, with implementations demonstrating the ability to mitigate over 80% of low-inventory risks through improved predictive analytics.
  • Another significant trend is the use of automated data analysis platforms for clinical study report automation, which can reduce the manual effort for medical writers by up to 30%. These advancements are powered by sophisticated deep learning algorithms and are enabling new approaches to AI-powered drug research.
  • Generative chemistry platforms, which serve as high-throughput screening alternatives, are accelerating AI-accelerated drug development, particularly in creating treatments for rare diseases. This fusion of robotic lab automation and automated chemical synthesis is streamlining processes from discovery to delivery.

What challenges does the Generative AI In Pharmaceutical Industry Industry face during its growth?

  • Ensuring data privacy and security for sensitive health information and intellectual property presents a key challenge amid accelerated innovation in the industry.

  • Navigating data privacy, regulatory uncertainty, and ethical considerations are the primary challenges facing the generative AI in pharmaceutical industry market. The need to protect sensitive information while leveraging multi-omics data integration necessitates the use of advanced techniques like federated learning and the creation of digital twin simulations.
  • A major hurdle is the risk of algorithmic bias, which can compromise the equity of patient stratification models if not actively addressed. Regulatory bodies are grappling with how to validate outputs from complex transformer architecture and predictive modeling, as highlighted by the more than 2 million adverse event reports they process annually.
  • The development of clear frameworks, such as Europe's multi-annual AI workplan for 2023-2028, is crucial for establishing trust and ensuring AI compliance in pharmaceuticals, particularly for predictive toxicology models and other high-risk applications.

Exclusive Technavio Analysis on Customer Landscape

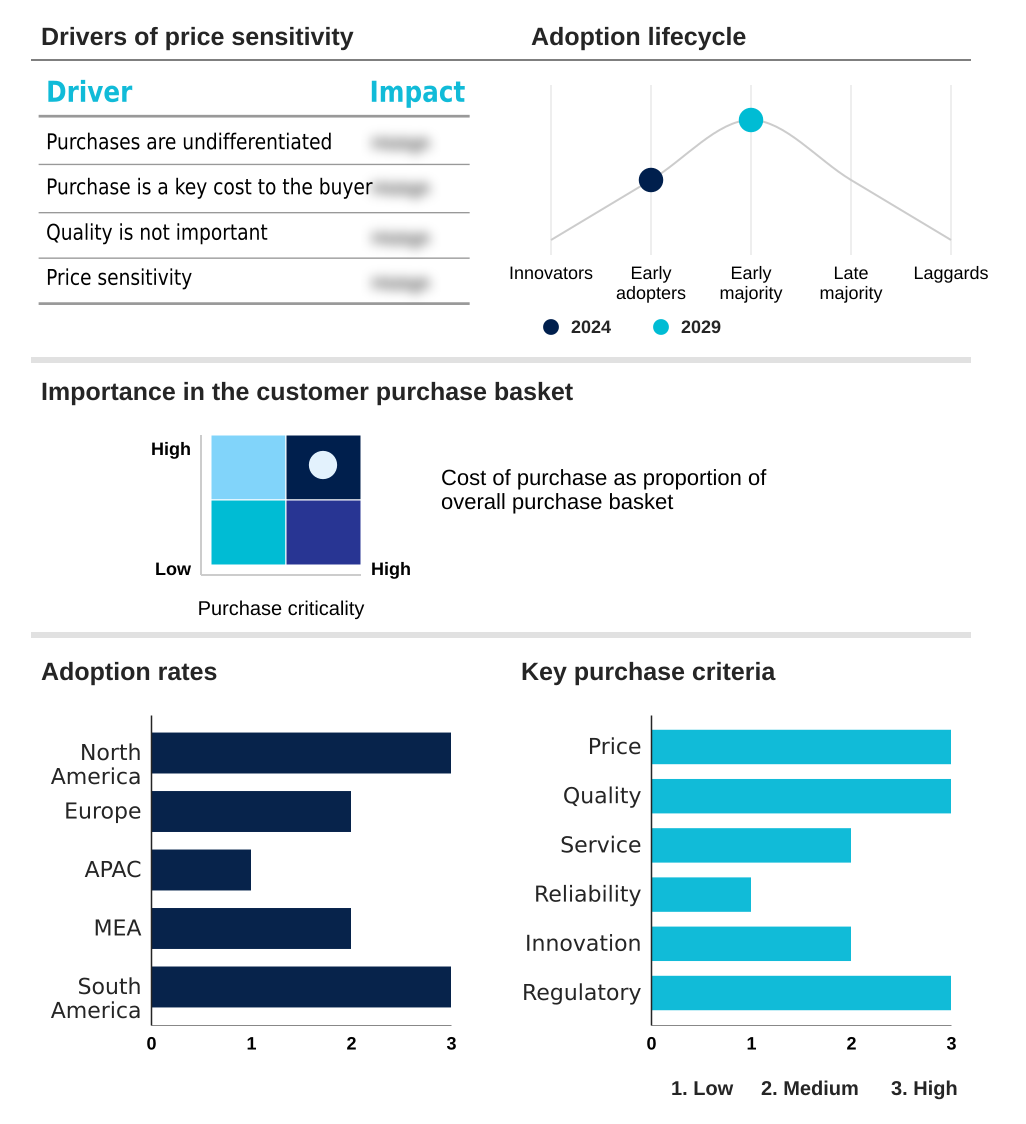
The generative ai in pharmaceutical industry market forecasting report includes the adoption lifecycle of the market, covering from the innovator’s stage to the laggard’s stage. It focuses on adoption rates in different regions based on penetration. Furthermore, the generative ai in pharmaceutical industry market report also includes key purchase criteria and drivers of price sensitivity to help companies evaluate and develop their market growth analysis strategies.

Customer Landscape of Generative AI In Pharmaceutical Industry Industry

Competitive Landscape

Companies are implementing various strategies, such as strategic alliances, generative ai in pharmaceutical industry market forecast, partnerships, mergers and acquisitions, geographical expansion, and product/service launches, to enhance their presence in the industry.

AstraZeneca Plc - Key offerings from vendors include platforms for de novo drug design, synthetic patient data generation, and clinical trial optimization, accelerating the entire pharmaceutical R&D pipeline.

The industry research and growth report includes detailed analyses of the competitive landscape of the market and information about key companies, including:

  • AstraZeneca Plc
  • Atomwise Inc.
  • Bayer AG
  • BenevolentAI
  • BioXcel Therapeutics Inc.
  • Deep Genomics Inc.
  • Exscientia plc
  • Insilico Medicine
  • PathAI Inc.
  • Recursion Pharmaceuticals Inc.
  • Relay Therapeutics Inc.
  • Sanofi SA
  • Schrodinger Inc.
  • Shenzhen Jingtai Technology Co.Ltd
  • Valo Health

Qualitative and quantitative analysis of companies has been conducted to help clients understand the wider business environment as well as the strengths and weaknesses of key industry players. Data is qualitatively analyzed to categorize companies as pure play, category-focused, industry-focused, and diversified; it is quantitatively analyzed to categorize companies as dominant, leading, strong, tentative, and weak.

Recent Development and News in Generative ai in pharmaceutical industry market

  • In August 2024, Recursion Pharmaceuticals Inc. announced a definitive agreement to acquire Exscientia plc to enhance its early-stage drug discovery pipeline and precision chemistry capabilities.
  • In October 2024, BioNTech SE's subsidiary, InstaDeep, announced the release of new foundational generative AI models for proteins and DNA through its DeepChain platform to accelerate biopharmaceutical research.
  • In January 2025, the U.S. Food and Drug Administration (FDA) issued draft guidance on using artificial intelligence in drug development, providing a framework for sponsors to establish the credibility of AI models in clinical trials.
  • In February 2025, Iktos secured a USD 2.93 million grant from the European Innovation Council Accelerator to further develop its AI drug discovery capabilities and launch a robotics platform for automated chemical synthesis.

Dive into Technavio’s robust research methodology, blending expert interviews, extensive data synthesis, and validated models for unparalleled Generative AI In Pharmaceutical Industry Market insights. See full methodology.

Market Scope
Page number 306
Base year 2024
Historic period 2019-2023
Forecast period 2025-2029
Growth momentum & CAGR Accelerate at a CAGR of 26.1%
Market growth 2025-2029 USD 5380.8 million
Market structure Fragmented
YoY growth 2024-2025(%) 24.6%
Key countries US, Canada, Mexico, Germany, France, UK, Italy, The Netherlands, Spain, China, India, Japan, South Korea, Australia, Indonesia, Saudi Arabia, UAE, South Africa, Israel, Turkey, Brazil, Argentina and Colombia
Competitive landscape Leading Companies, Market Positioning of Companies, Competitive Strategies, and Industry Risks

Request Free Sample

Research Analyst Overview

  • The generative AI in pharmaceutical industry market is characterized by the convergence of advanced computational science and deep biological understanding. The entire drug development lifecycle is being reimagined through technologies such as de novo drug design, generative adversarial networks, and variational autoencoders. From initial target identification and hit identification to complex lead optimization, these tools are compressing R&D timelines.
  • The use of high-performance computing and robotic lab automation is enabling phenotypic screening and automated chemical synthesis at an unprecedented scale. In later stages, AI-driven clinical trial optimization and pharmacovigilance, supported by natural language processing and federated learning, are enhancing efficiency and safety.
  • A pivotal trend influencing boardroom strategy is the automation of medical and regulatory writing; with AI-driven clinical study report automation projected to reduce writer effort by up to 30%, executives are re-evaluating R&D budgets and resource allocation.
  • This shift, combined with innovations in vocal biomarkers, drug repurposing, and protein engineering, marks a fundamental move towards a more predictive and efficient pharmaceutical industry.

What are the Key Data Covered in this Generative AI In Pharmaceutical Industry Market Research and Growth Report?

  • What is the expected growth of the Generative AI In Pharmaceutical Industry Market between 2025 and 2029?

    • USD 5.38 billion, at a CAGR of 26.1%

  • What segmentation does the market report cover?

    • The report is segmented by Method (Text generation, Image generation, and Audio generation), Application (Commercial, Drug discovery, Clinical development, Research and development, and Operations), Technology (Deep learning models, Natural language processing, Generative adversarial networks, Variational autoencoders, Others) and Geography (North America, Europe, APAC, Middle East and Africa, South America)

  • Which regions are analyzed in the report?

    • North America, Europe, APAC, Middle East and Africa and South America

  • What are the key growth drivers and market challenges?

    • Accelerating drug discovery and development, Data privacy and security imperatives in era of accelerated innovation

  • Who are the major players in the Generative AI In Pharmaceutical Industry Market?

    • AstraZeneca Plc, Atomwise Inc., Bayer AG, BenevolentAI, BioXcel Therapeutics Inc., Deep Genomics Inc., Exscientia plc, Insilico Medicine, PathAI Inc., Recursion Pharmaceuticals Inc., Relay Therapeutics Inc., Sanofi SA, Schrodinger Inc., Shenzhen Jingtai Technology Co.Ltd and Valo Health

Market Research Insights

  • The generative AI in pharmaceutical industry market is defined by rapid innovation and a shift towards data-centric operations. AI for personalized medicine is enabling patient-centered trial design, while machine learning for drug repurposing uncovers new value in existing compounds.
  • Organizations are achieving significant efficiencies, with some reducing medical writing efforts by up to 30% and others mitigating over 80% of low-inventory risks through AI-optimized supply chain management. The technology facilitates deep learning in pharmacovigilance and powers generative chemistry platforms, moving beyond high-throughput screening alternatives.
  • As adoption grows, so does the focus on AI compliance in pharmaceuticals and mitigating algorithmic bias in healthcare to ensure equitable outcomes. From AI-driven biomarker discovery and automated clinical trial design to enhancing immuno-oncology research, the market's dynamism is reshaping the entire value chain.

We can help! Our analysts can customize this generative ai in pharmaceutical industry market research report to meet your requirements.

Get in touch

1. Executive Summary

1.1 Market overview

Executive Summary - Chart on Market Overview
Executive Summary - Data Table on Market Overview
Executive Summary - Chart on Global Market Characteristics
Executive Summary - Chart on Market by Geography
Executive Summary - Chart on Market Segmentation by Method
Executive Summary - Chart on Market Segmentation by Application
Executive Summary - Chart on Market Segmentation by Technology
Executive Summary - Chart on Incremental Growth
Executive Summary - Data Table on Incremental Growth
Executive Summary - Chart on Company Market Positioning

2. Technavio Analysis

2.1 Analysis of price sensitivity, lifecycle, customer purchase basket, adoption rates, and purchase criteria

2.2 Criticality of inputs and Factors of differentiation

Chart on Overview on criticality of inputs and factors of differentiation

2.3 Factors of disruption

Chart on Overview on factors of disruption

2.4 Impact of drivers and challenges

Chart on Impact of drivers and challenges in 2024 and 2029

3. Market Landscape

3.1 Market ecosystem

Chart on Parent Market
Data Table on - Parent Market

3.2 Market characteristics

Chart on Market characteristics analysis

3.3 Value chain analysis

Chart on Value chain analysis

4. Market Sizing

4.1 Market definition

Data Table on Offerings of companies included in the market definition

4.2 Market segment analysis

Market segments

4.3 Market size 2024

4.4 Market outlook: Forecast for 2024-2029

Chart on Global - Market size and forecast 2024-2029 ($ million)
Data Table on Global - Market size and forecast 2024-2029 ($ million)
Chart on Global Market: Year-over-year growth 2024-2029 (%)
Data Table on Global Market: Year-over-year growth 2024-2029 (%)

5. Historic Market Size

5.1 Global Generative AI In Pharmaceutical Industry Market 2019 - 2023

Historic Market Size - Data Table on Global Generative AI In Pharmaceutical Industry Market 2019 - 2023 ($ million)

5.2 Method segment analysis 2019 - 2023

Historic Market Size - Method Segment 2019 - 2023 ($ million)

5.3 Application segment analysis 2019 - 2023

Historic Market Size - Application Segment 2019 - 2023 ($ million)

5.4 Technology segment analysis 2019 - 2023

Historic Market Size - Technology Segment 2019 - 2023 ($ million)

5.5 Geography segment analysis 2019 - 2023

Historic Market Size - Geography Segment 2019 - 2023 ($ million)

5.6 Country segment analysis 2019 - 2023

Historic Market Size - Country Segment 2019 - 2023 ($ million)

6. Five Forces Analysis

6.1 Five forces summary

Five forces analysis - Comparison between 2024 and 2029

6.2 Bargaining power of buyers

Bargaining power of buyers - Impact of key factors 2024 and 2029

6.3 Bargaining power of suppliers

Bargaining power of suppliers - Impact of key factors in 2024 and 2029

6.4 Threat of new entrants

Threat of new entrants - Impact of key factors in 2024 and 2029

6.5 Threat of substitutes

Threat of substitutes - Impact of key factors in 2024 and 2029

6.6 Threat of rivalry

Threat of rivalry - Impact of key factors in 2024 and 2029

6.7 Market condition

Chart on Market condition - Five forces 2024 and 2029

7. Market Segmentation by Method

7.1 Market segments

Chart on Method - Market share 2024-2029 (%)
Data Table on Method - Market share 2024-2029 (%)

7.2 Comparison by Method

Chart on Comparison by Method
Data Table on Comparison by Method

7.3 Text generation - Market size and forecast 2024-2029

Chart on Text generation - Market size and forecast 2024-2029 ($ million)
Data Table on Text generation - Market size and forecast 2024-2029 ($ million)
Chart on Text generation - Year-over-year growth 2024-2029 (%)
Data Table on Text generation - Year-over-year growth 2024-2029 (%)

7.4 Image generation - Market size and forecast 2024-2029

Chart on Image generation - Market size and forecast 2024-2029 ($ million)
Data Table on Image generation - Market size and forecast 2024-2029 ($ million)
Chart on Image generation - Year-over-year growth 2024-2029 (%)
Data Table on Image generation - Year-over-year growth 2024-2029 (%)

7.5 Audio generation - Market size and forecast 2024-2029

Chart on Audio generation - Market size and forecast 2024-2029 ($ million)
Data Table on Audio generation - Market size and forecast 2024-2029 ($ million)
Chart on Audio generation - Year-over-year growth 2024-2029 (%)
Data Table on Audio generation - Year-over-year growth 2024-2029 (%)

7.6 Market opportunity by Method

Market opportunity by Method ($ million)
Data Table on Market opportunity by Method ($ million)

8. Market Segmentation by Application

8.1 Market segments

Chart on Application - Market share 2024-2029 (%)
Data Table on Application - Market share 2024-2029 (%)

8.2 Comparison by Application

Chart on Comparison by Application
Data Table on Comparison by Application

8.3 Commercial - Market size and forecast 2024-2029

Chart on Commercial - Market size and forecast 2024-2029 ($ million)
Data Table on Commercial - Market size and forecast 2024-2029 ($ million)
Chart on Commercial - Year-over-year growth 2024-2029 (%)
Data Table on Commercial - Year-over-year growth 2024-2029 (%)

8.4 Drug discovery - Market size and forecast 2024-2029

Chart on Drug discovery - Market size and forecast 2024-2029 ($ million)
Data Table on Drug discovery - Market size and forecast 2024-2029 ($ million)
Chart on Drug discovery - Year-over-year growth 2024-2029 (%)
Data Table on Drug discovery - Year-over-year growth 2024-2029 (%)

8.5 Clinical development - Market size and forecast 2024-2029

Chart on Clinical development - Market size and forecast 2024-2029 ($ million)
Data Table on Clinical development - Market size and forecast 2024-2029 ($ million)
Chart on Clinical development - Year-over-year growth 2024-2029 (%)
Data Table on Clinical development - Year-over-year growth 2024-2029 (%)

8.6 Research and development - Market size and forecast 2024-2029

Chart on Research and development - Market size and forecast 2024-2029 ($ million)
Data Table on Research and development - Market size and forecast 2024-2029 ($ million)
Chart on Research and development - Year-over-year growth 2024-2029 (%)
Data Table on Research and development - Year-over-year growth 2024-2029 (%)

8.7 Operations - Market size and forecast 2024-2029

Chart on Operations - Market size and forecast 2024-2029 ($ million)
Data Table on Operations - Market size and forecast 2024-2029 ($ million)
Chart on Operations - Year-over-year growth 2024-2029 (%)
Data Table on Operations - Year-over-year growth 2024-2029 (%)

8.8 Market opportunity by Application

Market opportunity by Application ($ million)
Data Table on Market opportunity by Application ($ million)

9. Market Segmentation by Technology

9.1 Market segments

Chart on Technology - Market share 2024-2029 (%)
Data Table on Technology - Market share 2024-2029 (%)

9.2 Comparison by Technology

Chart on Comparison by Technology
Data Table on Comparison by Technology

9.3 Deep learning models - Market size and forecast 2024-2029

Chart on Deep learning models - Market size and forecast 2024-2029 ($ million)
Data Table on Deep learning models - Market size and forecast 2024-2029 ($ million)
Chart on Deep learning models - Year-over-year growth 2024-2029 (%)
Data Table on Deep learning models - Year-over-year growth 2024-2029 (%)

9.4 Natural language processing - Market size and forecast 2024-2029

Chart on Natural language processing - Market size and forecast 2024-2029 ($ million)
Data Table on Natural language processing - Market size and forecast 2024-2029 ($ million)
Chart on Natural language processing - Year-over-year growth 2024-2029 (%)
Data Table on Natural language processing - Year-over-year growth 2024-2029 (%)

9.5 Generative adversarial networks - Market size and forecast 2024-2029

Chart on Generative adversarial networks - Market size and forecast 2024-2029 ($ million)
Data Table on Generative adversarial networks - Market size and forecast 2024-2029 ($ million)
Chart on Generative adversarial networks - Year-over-year growth 2024-2029 (%)
Data Table on Generative adversarial networks - Year-over-year growth 2024-2029 (%)

9.6 Variational autoencoders - Market size and forecast 2024-2029

Chart on Variational autoencoders - Market size and forecast 2024-2029 ($ million)
Data Table on Variational autoencoders - Market size and forecast 2024-2029 ($ million)
Chart on Variational autoencoders - Year-over-year growth 2024-2029 (%)
Data Table on Variational autoencoders - Year-over-year growth 2024-2029 (%)

9.7 Others - Market size and forecast 2024-2029

Chart on Others - Market size and forecast 2024-2029 ($ million)
Data Table on Others - Market size and forecast 2024-2029 ($ million)
Chart on Others - Year-over-year growth 2024-2029 (%)
Data Table on Others - Year-over-year growth 2024-2029 (%)

9.8 Market opportunity by Technology

Market opportunity by Technology ($ million)
Data Table on Market opportunity by Technology ($ million)

10. Customer Landscape

10.1 Customer landscape overview

Analysis of price sensitivity, lifecycle, customer purchase basket, adoption rates, and purchase criteria

11. Geographic Landscape

11.1 Geographic segmentation

Chart on Market share by geography 2024-2029 (%)
Data Table on Market share by geography 2024-2029 (%)

11.2 Geographic comparison

Chart on Geographic comparison
Data Table on Geographic comparison

11.3 North America - Market size and forecast 2024-2029

Chart on North America - Market size and forecast 2024-2029 ($ million)
Data Table on North America - Market size and forecast 2024-2029 ($ million)
Chart on North America - Year-over-year growth 2024-2029 (%)
Data Table on North America - Year-over-year growth 2024-2029 (%)
Chart on Regional Comparison - North America
Data Table on Regional Comparison - North America

11.3.1 US - Market size and forecast 2024-2029

Chart on US - Market size and forecast 2024-2029 ($ million)
Data Table on US - Market size and forecast 2024-2029 ($ million)
Chart on US - Year-over-year growth 2024-2029 (%)
Data Table on US - Year-over-year growth 2024-2029 (%)

11.3.2 Canada - Market size and forecast 2024-2029

Chart on Canada - Market size and forecast 2024-2029 ($ million)
Data Table on Canada - Market size and forecast 2024-2029 ($ million)
Chart on Canada - Year-over-year growth 2024-2029 (%)
Data Table on Canada - Year-over-year growth 2024-2029 (%)

11.3.3 Mexico - Market size and forecast 2024-2029

Chart on Mexico - Market size and forecast 2024-2029 ($ million)
Data Table on Mexico - Market size and forecast 2024-2029 ($ million)
Chart on Mexico - Year-over-year growth 2024-2029 (%)
Data Table on Mexico - Year-over-year growth 2024-2029 (%)

11.4 Europe - Market size and forecast 2024-2029

Chart on Europe - Market size and forecast 2024-2029 ($ million)
Data Table on Europe - Market size and forecast 2024-2029 ($ million)
Chart on Europe - Year-over-year growth 2024-2029 (%)
Data Table on Europe - Year-over-year growth 2024-2029 (%)
Chart on Regional Comparison - Europe
Data Table on Regional Comparison - Europe

11.4.1 Germany - Market size and forecast 2024-2029

Chart on Germany - Market size and forecast 2024-2029 ($ million)
Data Table on Germany - Market size and forecast 2024-2029 ($ million)
Chart on Germany - Year-over-year growth 2024-2029 (%)
Data Table on Germany - Year-over-year growth 2024-2029 (%)

11.4.2 France - Market size and forecast 2024-2029

Chart on France - Market size and forecast 2024-2029 ($ million)
Data Table on France - Market size and forecast 2024-2029 ($ million)
Chart on France - Year-over-year growth 2024-2029 (%)
Data Table on France - Year-over-year growth 2024-2029 (%)

11.4.3 UK - Market size and forecast 2024-2029

Chart on UK - Market size and forecast 2024-2029 ($ million)
Data Table on UK - Market size and forecast 2024-2029 ($ million)
Chart on UK - Year-over-year growth 2024-2029 (%)
Data Table on UK - Year-over-year growth 2024-2029 (%)

11.4.4 Italy - Market size and forecast 2024-2029

Chart on Italy - Market size and forecast 2024-2029 ($ million)
Data Table on Italy - Market size and forecast 2024-2029 ($ million)
Chart on Italy - Year-over-year growth 2024-2029 (%)
Data Table on Italy - Year-over-year growth 2024-2029 (%)

11.4.5 The Netherlands - Market size and forecast 2024-2029

Chart on The Netherlands - Market size and forecast 2024-2029 ($ million)
Data Table on The Netherlands - Market size and forecast 2024-2029 ($ million)
Chart on The Netherlands - Year-over-year growth 2024-2029 (%)
Data Table on The Netherlands - Year-over-year growth 2024-2029 (%)

11.4.6 Spain - Market size and forecast 2024-2029

Chart on Spain - Market size and forecast 2024-2029 ($ million)
Data Table on Spain - Market size and forecast 2024-2029 ($ million)
Chart on Spain - Year-over-year growth 2024-2029 (%)
Data Table on Spain - Year-over-year growth 2024-2029 (%)

11.5 APAC - Market size and forecast 2024-2029

Chart on APAC - Market size and forecast 2024-2029 ($ million)
Data Table on APAC - Market size and forecast 2024-2029 ($ million)
Chart on APAC - Year-over-year growth 2024-2029 (%)
Data Table on APAC - Year-over-year growth 2024-2029 (%)
Chart on Regional Comparison - APAC
Data Table on Regional Comparison - APAC

11.5.1 China - Market size and forecast 2024-2029

Chart on China - Market size and forecast 2024-2029 ($ million)
Data Table on China - Market size and forecast 2024-2029 ($ million)
Chart on China - Year-over-year growth 2024-2029 (%)
Data Table on China - Year-over-year growth 2024-2029 (%)

11.5.2 India - Market size and forecast 2024-2029

Chart on India - Market size and forecast 2024-2029 ($ million)
Data Table on India - Market size and forecast 2024-2029 ($ million)
Chart on India - Year-over-year growth 2024-2029 (%)
Data Table on India - Year-over-year growth 2024-2029 (%)

11.5.3 Japan - Market size and forecast 2024-2029

Chart on Japan - Market size and forecast 2024-2029 ($ million)
Data Table on Japan - Market size and forecast 2024-2029 ($ million)
Chart on Japan - Year-over-year growth 2024-2029 (%)
Data Table on Japan - Year-over-year growth 2024-2029 (%)

11.5.4 South Korea - Market size and forecast 2024-2029

Chart on South Korea - Market size and forecast 2024-2029 ($ million)
Data Table on South Korea - Market size and forecast 2024-2029 ($ million)
Chart on South Korea - Year-over-year growth 2024-2029 (%)
Data Table on South Korea - Year-over-year growth 2024-2029 (%)

11.5.5 Australia - Market size and forecast 2024-2029

Chart on Australia - Market size and forecast 2024-2029 ($ million)
Data Table on Australia - Market size and forecast 2024-2029 ($ million)
Chart on Australia - Year-over-year growth 2024-2029 (%)
Data Table on Australia - Year-over-year growth 2024-2029 (%)

11.5.6 Indonesia - Market size and forecast 2024-2029

Chart on Indonesia - Market size and forecast 2024-2029 ($ million)
Data Table on Indonesia - Market size and forecast 2024-2029 ($ million)
Chart on Indonesia - Year-over-year growth 2024-2029 (%)
Data Table on Indonesia - Year-over-year growth 2024-2029 (%)

11.6 Middle East and Africa - Market size and forecast 2024-2029

Chart on Middle East and Africa - Market size and forecast 2024-2029 ($ million)
Data Table on Middle East and Africa - Market size and forecast 2024-2029 ($ million)
Chart on Middle East and Africa - Year-over-year growth 2024-2029 (%)
Data Table on Middle East and Africa - Year-over-year growth 2024-2029 (%)
Chart on Regional Comparison - Middle East and Africa
Data Table on Regional Comparison - Middle East and Africa

11.6.1 Saudi Arabia - Market size and forecast 2024-2029

Chart on Saudi Arabia - Market size and forecast 2024-2029 ($ million)
Data Table on Saudi Arabia - Market size and forecast 2024-2029 ($ million)
Chart on Saudi Arabia - Year-over-year growth 2024-2029 (%)
Data Table on Saudi Arabia - Year-over-year growth 2024-2029 (%)

11.6.2 UAE - Market size and forecast 2024-2029

Chart on UAE - Market size and forecast 2024-2029 ($ million)
Data Table on UAE - Market size and forecast 2024-2029 ($ million)
Chart on UAE - Year-over-year growth 2024-2029 (%)
Data Table on UAE - Year-over-year growth 2024-2029 (%)

11.6.3 South Africa - Market size and forecast 2024-2029

Chart on South Africa - Market size and forecast 2024-2029 ($ million)
Data Table on South Africa - Market size and forecast 2024-2029 ($ million)
Chart on South Africa - Year-over-year growth 2024-2029 (%)
Data Table on South Africa - Year-over-year growth 2024-2029 (%)

11.6.4 Israel - Market size and forecast 2024-2029

Chart on Israel - Market size and forecast 2024-2029 ($ million)
Data Table on Israel - Market size and forecast 2024-2029 ($ million)
Chart on Israel - Year-over-year growth 2024-2029 (%)
Data Table on Israel - Year-over-year growth 2024-2029 (%)

11.6.5 Turkey - Market size and forecast 2024-2029

Chart on Turkey - Market size and forecast 2024-2029 ($ million)
Data Table on Turkey - Market size and forecast 2024-2029 ($ million)
Chart on Turkey - Year-over-year growth 2024-2029 (%)
Data Table on Turkey - Year-over-year growth 2024-2029 (%)

11.7 South America - Market size and forecast 2024-2029

Chart on South America - Market size and forecast 2024-2029 ($ million)
Data Table on South America - Market size and forecast 2024-2029 ($ million)
Chart on South America - Year-over-year growth 2024-2029 (%)
Data Table on South America - Year-over-year growth 2024-2029 (%)
Chart on Regional Comparison - South America
Data Table on Regional Comparison - South America

11.7.1 Brazil - Market size and forecast 2024-2029

Chart on Brazil - Market size and forecast 2024-2029 ($ million)
Data Table on Brazil - Market size and forecast 2024-2029 ($ million)
Chart on Brazil - Year-over-year growth 2024-2029 (%)
Data Table on Brazil - Year-over-year growth 2024-2029 (%)

11.7.2 Argentina - Market size and forecast 2024-2029

Chart on Argentina - Market size and forecast 2024-2029 ($ million)
Data Table on Argentina - Market size and forecast 2024-2029 ($ million)
Chart on Argentina - Year-over-year growth 2024-2029 (%)
Data Table on Argentina - Year-over-year growth 2024-2029 (%)

11.7.3 Colombia - Market size and forecast 2024-2029

Chart on Colombia - Market size and forecast 2024-2029 ($ million)
Data Table on Colombia - Market size and forecast 2024-2029 ($ million)
Chart on Colombia - Year-over-year growth 2024-2029 (%)
Data Table on Colombia - Year-over-year growth 2024-2029 (%)

11.8 Market opportunity by geography

Market opportunity by geography ($ million)
Data Tables on Market opportunity by geography ($ million)

12. Drivers, Challenges, and Opportunity

12.1 Market drivers

Accelerating drug discovery and development
Enhancing personalized medicine and treatment
Optimizing clinical trials

12.2 Market challenges

Data privacy and security imperatives in era of accelerated innovation
Navigating evolving regulatory and compliance gauntlet
Confronting ethical dilemmas and algorithmic bias

12.3 Impact of drivers and challenges

Impact of drivers and challenges in 2024 and 2029

12.4 Market opportunities

Revolutionizing medical and regulatory writing
Transforming pharmaceutical marketing and commercialization
Enhancing pharmaceutical manufacturing and supply chain management

13. Competitive Landscape

13.1 Overview

13.2

Overview on criticality of inputs and factors of differentiation

13.3 Landscape disruption

Overview on factors of disruption

13.4 Industry risks

Impact of key risks on business

14. Competitive Analysis

14.1 Companies profiled

Companies covered

14.2 Company ranking index

14.3 Market positioning of companies

Matrix on companies position and classification

14.4 AstraZeneca Plc

AstraZeneca Plc - Overview
AstraZeneca Plc - Product / Service
AstraZeneca Plc - Key news
AstraZeneca Plc - Key offerings
SWOT

14.5 Atomwise Inc.

Atomwise Inc. - Overview
Atomwise Inc. - Product / Service
Atomwise Inc. - Key offerings
SWOT

14.6 Bayer AG

Bayer AG - Overview
Bayer AG - Business segments
Bayer AG - Key news
Bayer AG - Key offerings
Bayer AG - Segment focus
SWOT

14.7 BenevolentAI

BenevolentAI - Overview
BenevolentAI - Product / Service
BenevolentAI - Key offerings
SWOT

14.8 BioXcel Therapeutics Inc.

BioXcel Therapeutics Inc. - Overview
BioXcel Therapeutics Inc. - Product / Service
BioXcel Therapeutics Inc. - Key offerings
SWOT

14.9 Deep Genomics Inc.

Deep Genomics Inc. - Overview
Deep Genomics Inc. - Product / Service
Deep Genomics Inc. - Key offerings
SWOT

14.10 Exscientia plc

Exscientia plc - Overview
Exscientia plc - Product / Service
Exscientia plc - Key offerings
SWOT

14.11 Insilico Medicine

Insilico Medicine - Overview
Insilico Medicine - Product / Service
Insilico Medicine - Key offerings
SWOT

14.12 PathAI Inc.

PathAI Inc. - Overview
PathAI Inc. - Product / Service
PathAI Inc. - Key offerings
SWOT

14.13 Recursion Pharmaceuticals Inc.

Recursion Pharmaceuticals Inc. - Overview
Recursion Pharmaceuticals Inc. - Product / Service
Recursion Pharmaceuticals Inc. - Key offerings
SWOT

14.14 Relay Therapeutics Inc.

Relay Therapeutics Inc. - Overview
Relay Therapeutics Inc. - Product / Service
Relay Therapeutics Inc. - Key offerings
SWOT

14.15 Sanofi SA

Sanofi SA - Overview
Sanofi SA - Business segments
Sanofi SA - Key news
Sanofi SA - Key offerings
Sanofi SA - Segment focus
SWOT

14.16 Schrodinger Inc.

Schrodinger Inc. - Overview
Schrodinger Inc. - Business segments
Schrodinger Inc. - Key offerings
Schrodinger Inc. - Segment focus
SWOT

14.17 Shenzhen Jingtai Technology Co.Ltd

Shenzhen Jingtai Technology Co.Ltd - Overview
Shenzhen Jingtai Technology Co.Ltd - Product / Service
Shenzhen Jingtai Technology Co.Ltd - Key offerings
SWOT

14.18 Valo Health

Valo Health - Overview
Valo Health - Product / Service
Valo Health - Key offerings
SWOT

15. Appendix

15.1 Scope of the report

Market definition
Objectives
Notes and caveats

15.2 Inclusions and exclusions checklist

Inclusions checklist
Exclusions checklist

15.3 Currency conversion rates for US$

15.4 Research methodology

15.5 Data procurement

Information sources

15.6 Data validation

15.7 Validation techniques employed for market sizing

15.8 Data synthesis

15.9 360 degree market analysis

15.10 List of abbreviations

Research Methodology

Technavio presents a detailed picture of the market by way of study, synthesis, and summation of data from multiple sources. The analysts have presented the various facets of the market with a particular focus on identifying the key industry influencers. The data thus presented is comprehensive, reliable, and the result of extensive research, both primary and secondary.

INFORMATION SOURCES

Primary sources

  • Manufacturers and suppliers
  • Channel partners
  • Industry experts
  • Strategic decision makers

Secondary sources

  • Industry journals and periodicals
  • Government data
  • Financial reports of key industry players
  • Historical data
  • Press releases

DATA ANALYSIS

Data Synthesis

  • Collation of data
  • Estimation of key figures
  • Analysis of derived insights

Data Validation

  • Triangulation with data models
  • Reference against proprietary databases
  • Corroboration with industry experts

REPORT WRITING

Qualitative

  • Market drivers
  • Market challenges
  • Market trends
  • Five forces analysis

Quantitative

  • Market size and forecast
  • Market segmentation
  • Geographical insights
  • Competitive landscape

Interested in this report?

Get your sample now to see our research methodology and insights!

Download Now

Frequently Asked Questions

Generative AI In Pharmaceutical Industry market growth will increase by USD 5380.8 million during 2025-2029.

The Generative AI In Pharmaceutical Industry market is expected to grow at a CAGR of 26.1% during 2025-2029.

Generative AI In Pharmaceutical Industry market is segmented by Method (Text generation, Image generation, Audio generation) Application (Commercial, Drug discovery, Clinical development, Research and development, Operations) Technology (Deep learning models, Natural language processing, Generative adversarial networks, Variational autoencoders, Others)

AstraZeneca Plc, Atomwise Inc., Bayer AG, BenevolentAI, BioXcel Therapeutics Inc., Deep Genomics Inc., Exscientia plc, Insilico Medicine, PathAI Inc., Recursion Pharmaceuticals Inc., Relay Therapeutics Inc., Sanofi SA, Schrodinger Inc., Shenzhen Jingtai Technology Co.Ltd, Valo Health are a few of the key vendors in the Generative AI In Pharmaceutical Industry market.

North America will register the highest growth rate of 44.1% among the other regions. Therefore, the Generative AI In Pharmaceutical Industry market in North America is expected to garner significant business opportunities for the vendors during the forecast period.

US, Canada, Mexico, Germany, France, UK, Italy, The Netherlands, Spain, China, India, Japan, South Korea, Australia, Indonesia, Saudi Arabia, UAE, South Africa, Israel, Turkey, Brazil, Argentina, Colombia

  • Accelerating drug discovery and development is the driving factor this market.

The Generative AI In Pharmaceutical Industry market vendors should focus on grabbing business opportunities from the Method segment as it accounted for the largest market share in the base year.