Fortified Wine Market Analysis Europe, North America, APAC, South America, Middle East and Africa - US, France, Italy, Germany, UK - Size and Forecast 2024-2028

Fortified Wine Market Analysis Europe, North America, APAC, South America, Middle East and Africa - US, France, Italy, Germany, UK - Size and Forecast 2024-2028

Published: Jul 2024 152 Pages SKU: IRTNTR75958

Market Overview at a Glance

$4.38 B
Market Opportunity
4.36%
CAGR
4.11
YoY growth 2023-2024(%)

Fortified Wine Market Size 2024-2028 

The fortified wine market size is forecast to increase by USD 4.38 billion at a CAGR of 4.36% between 2023 and 2028. 

  • The market is experiencing significant growth, driven by the increasing consumption rate of fortified wines and the rising popularity of natural ingredients in mixology and cocktail culture. This trend is particularly evident in the popularity of dessert wines and aperitifs, which are often used as base ingredients in cocktails. However, the market faces challenges, including the negative perception associated with fortified wines and the impact of lockdowns and social distancing measures on traditional sales channels.  Fortified wines, including sherry, port, vermouth, and dessert wines, offer consumers a premium experience, innovation in flavors, and social recognition. 
  • Fortified wine is considered a healthier choice compared to other alcoholic drinks due to its reduced alcohol consumption and level of antioxidants. Online wine auctions and sales platforms have emerged as key growth areas, offering consumers convenience and access to a wide range of fortified wines. As consumers continue to explore new ways to enjoy these unique and flavorful wines, the market is expected to continue its expansion.

What will be the Size of the Market During the Forecast Period?

Fortified Wine Market Size

 Request Free Sample

  • The alcoholic drinks industry continues to evolve, with fortified wines gaining significant attention due to their unique characteristics and various health benefits.  Amid economic uncertainty, the working population is seeking more sustainable and session-able choices in alcohol, prompting investment in R&D by companies focused on improving the quality of wine, enhancing production facilities, and optimizing distribution centers, while craft brands continue to thrive, especially in pubs where consumers increasingly prioritize both taste and sustainability. Social media promotions and the influence of mixologists have contributed to the growing popularity of fortified wines. These beverages are increasingly being used as mixers in cocktails, expanding their consumer base beyond traditional markets. Brand recognition plays a crucial role in the market.
  • Furthermore, alcohol Taxation and Regulations Increased taxation on alcoholic beverages, including fortified wines, may impact market growth. However, the implementation of strict regulations by authorities like the FSSAI ensures the production and sale of safe and authentic fortified wines, maintaining consumer trust. Segment Analysis The sherry segment holds a significant share of the market, with popular varieties like Amontillado, Fino, and Oloroso driving growth. The vermouth segment is also gaining popularity, particularly in the cocktail industry, due to its versatility and unique taste profile. Distribution Channels Fortified wines are available in various distribution channels, including liquor stores and single-spirit bars.

Market Segmentation

The market research report provides comprehensive data (region-wise segment analysis), with forecasts and estimates in "USD billion" for the period 2024-2028, as well as historical data from 2018-2022 for the following segments. 

  • Product Type
    • Sherry
    • Port
    • Vermouth
    • Others
  • Distribution Channel
    • Off-trade
    • On-trade
  • Body Type
    • Light bodied
    • Medium bodied
    • Full bodied
  • Sweetness Level
    • Dry
    • Semi Sweet
    • Sweet
  • Geography
    • Europe
      • Germany
      • UK
      • France
      • Italy
    • North America
      • US
    • APAC
    • South America
    • Middle East and Africa

By Product Type Insights

The sherry segment is estimated to witness significant growth during the forecast period. Fortified wines, including sherry, hold a distinguished place in the global market for alcoholic drinks due to their unique production methods and various health benefits. The sherry segment, in particular, is experiencing growth driven by its intricate production process and the premiumization trend. The solera system, a traditional method of aging sherry wines, sets it apart from other wines by blending young wines with older ones in a cascading manner. This results in a complex and desirable flavor profile that appeals to discerning consumers. For instance, a bottle of Amontillado Sherry may contain a small proportion of very old wine combined with a larger proportion of younger wine, creating a unique and sought-after taste.

Furthermore, the health benefits associated with fortified wines, such as potential heart health advantages, further add to their allure. However, increased taxation and regulations from organizations like the Food Safety and Standards Authority of India (FSSAI) may pose challenges to market growth. Despite these obstacles, innovation in flavors and social recognition continue to drive consumer interest in fortified wines.

Fortified Wine Market Size

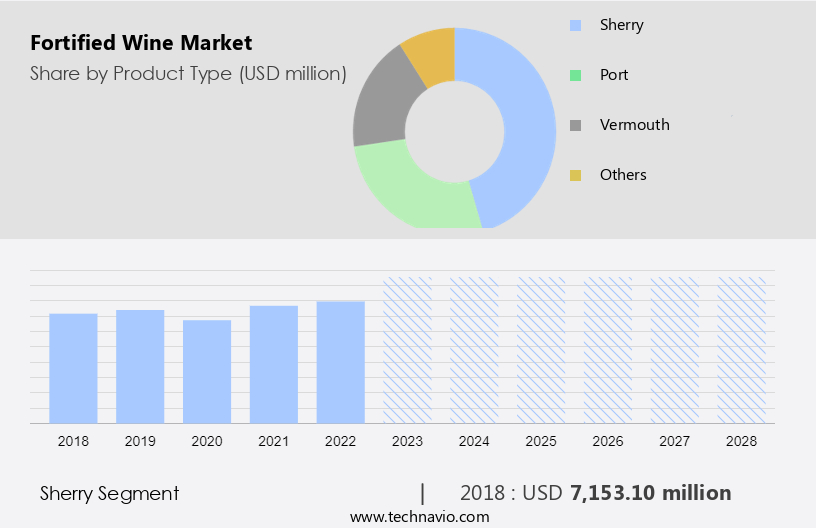
Get a glance at the share of various segments. Request Free Sample

The sherry segment was valued at USD 7.15 billion in 2018 and showed a gradual increase during the forecast period.

Regional Insights

APAC is estimated to contribute 38% to the growth of the global market during the forecast period. Technavio's analysts have elaborately explained the regional trends and drivers that shape the market during the forecast period.

Fortified Wine Market Share by Geography

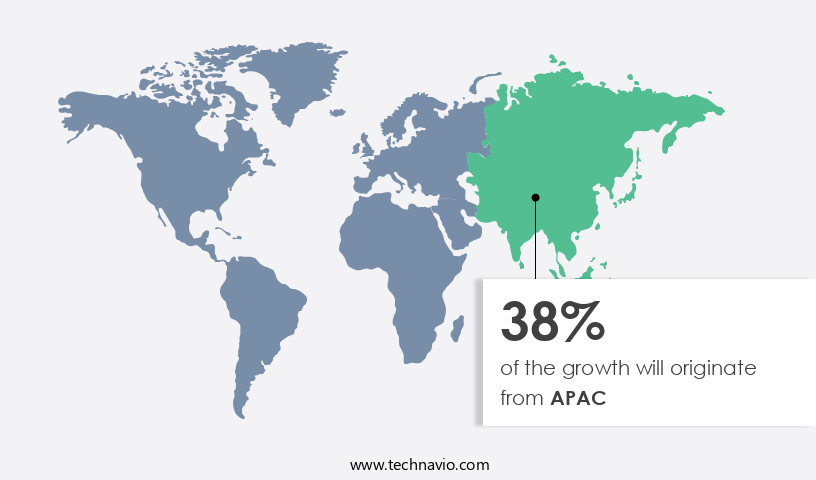
For more insights on the market share of various regions Request Free Sample

Europe holds a prominent position in the global wine market, recognized for its deep-rooted wine-making traditions and diverse regions. With a history spanning centuries, countries such as France, Italy, and Spain have honed their winemaking skills, resulting in exceptional wines that boast unparalleled taste and character. Notably, French wines like Bordeaux and Burgundy have gained global acclaim for their distinctive flavors. Europe's extensive wine regions enable the production of a vast array of grape varietals, catering to diverse consumer preferences. In the modern market landscape, fortified wines, including Sherry, Port, and Vermouth, have gained traction. Single-spirit bars have increasingly showcased these fortified wines, contributing to their growing popularity.

Furthermore, brands have capitalized on this trend through strategic marketing efforts and social media promotions. Europe's rich wine heritage, coupled with innovative marketing strategies, continues to strengthen brand recognition and drive growth in the market.

Our researchers analyzed the data with 2023 as the base year, along with the key drivers, trends, and challenges. A holistic analysis of drivers will help companies refine their marketing strategies to gain a competitive advantage.

Market Driver

The rising consumption rate of wine consumption is the key driver of the market. The consumption of fortified wine in the market has experienced notable growth in recent times. This trend can be linked to several factors, including altering consumer tastes, escalating disposable incomes, and the expansion of wine tourism. One significant factor contributing to this increase in consumption is the evolution of consumer preferences towards healthier and premium alcoholic beverages. Moreover, the diverse range of flavors and types offered by fortified wine caters to the varying taste preferences of consumers. Mixologists have been incorporating fortified wines, such as those aged in Amontillado Sherry casks, into their creations, adding a unique twist to classic cocktails.

Brands have gained popularity for their innovative approaches to fortified wine production. The antioxidant properties of fortified wine, coupled with its rich flavors, make it an attractive option for health-conscious consumers seeking a premium alcoholic beverage experience. The market is expected to continue its growth trajectory, driven by these factors and the increasing popularity of fortified wine among consumers.

Market Trends

The growing popularity of online wine auctions and sales platforms is the upcoming trend in the market. The market is experiencing a significant shift towards online wine auctions and sales platforms in the current economic climate. These digital marketplaces have gained prominence among wine connoisseurs and collectors due to their accessibility and convenience. One of the primary reasons for the rising preference for online platforms is the flexibility they offer. Buyers can effortlessly explore an extensive collection of fortified wines from their preferred locations, eliminating the need to visit physical auction houses or retail stores. This convenience is especially valuable for time-strapped individuals who cannot attend live auctions or travel to wine shops.

Furthermore, the increasing trend towards sustainable, organic production in the fortified wine industry is also driving demand for low-alcohol and session-able choices on these platforms. Consumers are increasingly seeking out wines produced using eco-friendly and sustainable methods, as well as those with lower alcohol content, making online sales platforms an ideal destination for these preferences. Additionally, the availability of extensive product information, customer reviews, and competitive pricing on these platforms further enhances their appeal. Overall, the future of the market looks promising, with online sales platforms poised to play a pivotal role in catering to the evolving preferences and needs of consumers.

Market Challenge

Negative perception associated with fortified wines is a key challenge affecting the market growth. Fortified wines, such as madeira, dessert wines, and aperitifs, have faced a negative reputation among consumers due to their historical association with abandoned or confiscated bottles. This perception is largely based on the belief that these wines have been fortified due to inferior quality or production issues. However, the fortification process itself is a unique and intriguing aspect of winemaking, which is gaining popularity in the mixology and cocktail culture scenes. With the rise of social distancing measures and lockdowns, consumers have been exploring new ways to enjoy their favorite beverages at home. Fortified wines offer an excellent solution for those seeking a complex and flavorful drinking experience.

Furthermore, their versatility in mixology makes them a staple ingredient for creating innovative and delicious cocktails. Despite the negative perception, the use of natural ingredients in the production of fortified wines ensures a high-quality and authentic taste. As consumers become more educated about the benefits and unique characteristics of these wines, the market is poised for growth. The trend towards healthier lifestyles and lower alcohol content may also contribute to the increasing popularity of fortified wines as a dessert wine alternative. In conclusion, the market presents a unique and exciting opportunity for both producers and consumers. By embracing the historical significance and unique production process, as well as the growing popularity in mixology and cocktail culture, fortified wines can shed their negative reputation and become a sought-after beverage choice for discerning consumers.

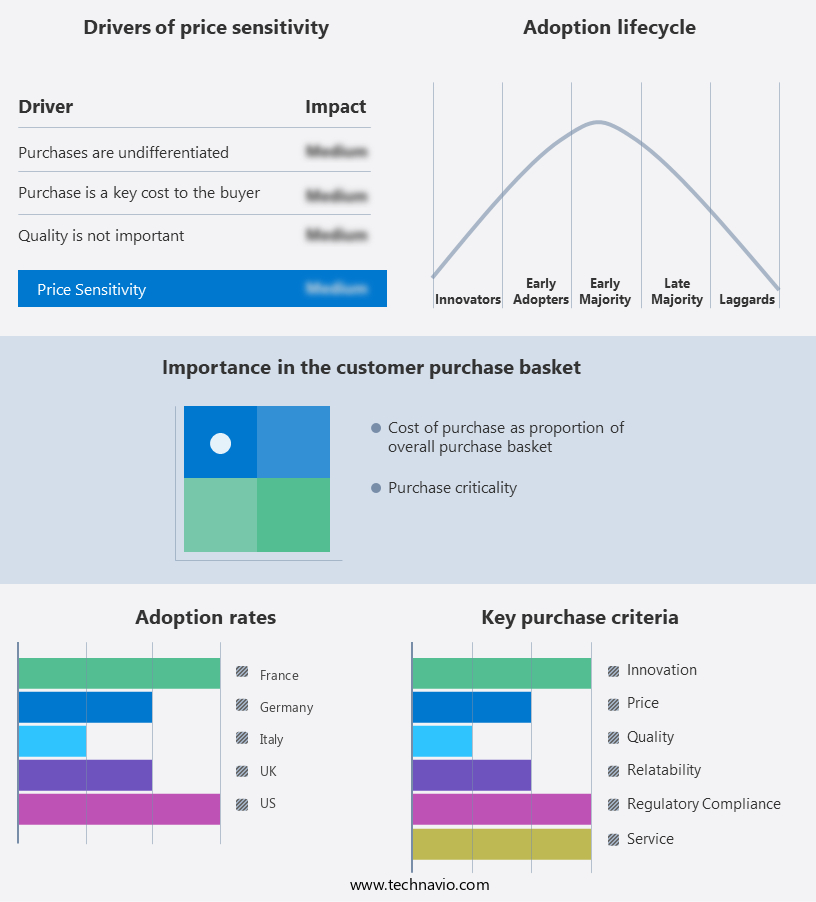
Exclusive Customer Landscape

The market forecasting report includes the adoption lifecycle of the market, covering from the innovator's stage to the laggard's stage. It focuses on adoption rates in different regions based on penetration. Furthermore, the report also includes key purchase criteria and drivers of price sensitivity to help companies evaluate and develop their market growth analysis strategies.

Fortified Wine Market Share by Geography

 Customer Landscape

Key Companies & Market Insights

Companies are implementing various strategies, such as strategic alliances, partnerships, mergers and acquisitions, geographical expansion, and product/service launches, to enhance their presence in the market.

Bacardi Ltd: The company offers fortified wine such as Bacardi Lemon.

The market research and growth report includes detailed analyses of the competitive landscape of the market and information about key companies, including:

  • Anchor Brewers and Distillers LLC
  • Bacardi Ltd.
  • Campari Group
  • Contratto srl
  • DOWS Port
  • E. and J. Gallo Winery
  • Emilio Lustau S.A.
  • Fonseca Port Wine
  • Fratelli Gancia and C. SpA
  • Mazurans Vineyards Ltd.
  • Precept Wine
  • Ramos Pinto
  • Rhys and Rylee LLC
  • SOGEVINUS FINE WINES SA
  • Sogrape SGPS SA
  • Symington Family Estates Vinhos S.A.
  • Taylors Port
  • The Great Wine Co.
  • Vinbros and Co.
  • Vinimark Trading Pty Ltd.

Qualitative and quantitative analysis of companies has been conducted to help clients understand the wider business environment as well as the strengths and weaknesses of key market players. Data is qualitatively analyzed to categorize companies as pure play, category-focused, industry-focused, and diversified; it is quantitatively analyzed to categorize companies as dominant, leading, strong, tentative, and weak.

Research Analyst Overview

Fortified wines, a category of alcoholic drinks known for their distinctive flavors and health benefits, have been gaining popularity among consumers worldwide. The premiumization trend in the alcoholic drinks market has led to innovation in flavors and product offerings, making fortified wines an attractive choice for social recognition. Various health benefits associated with fortified wines, including antioxidants and natural ingredients, have contributed to their growing appeal. However, increased taxation and regulatory bodies like FSSAI have imposed challenges on the market. The vermouth segment and dessert wine categories have seen significant growth due to consumer preferences for product innovations.

Furthermore, liquor stores and internet retailing have emerged as key distribution channels, while production facilities and distribution centers have become essential components of the supply chain. Seasonal variations and grapes are crucial factors influencing the production of fortified wines. The sherry and port segments have gained traction due to their unique flavors and brand recognition. Mixologists and cocktail culture have further fueled the demand for fortified wines in bars and restaurants. The cannabis industry's emergence has led to new opportunities for fortified wine producers, with some experimenting with cannabis-infused products. The working population's shifting preferences towards premium drinks, low-alcohol choices have also impacted the market dynamics. Sustainable and organic production methods have become essential for fortified wine producers seeking to cater to evolving consumer demands.

Market Scope

Report Coverage

Details

Page number

152

Base year

2023

Historic period

2018-2022

Forecast period

2024-2028

Growth momentum & CAGR

Accelerate at a CAGR of 4.36%

Market Growth 2024-2028

USD 4.38 billion

Market structure

Fragmented

YoY growth 2023-2024(%)

4.11

Regional analysis

Europe, North America, APAC, South America, and Middle East and Africa

Performing market contribution

APAC at 38%

Key countries

US, France, Italy, Germany, and UK

Competitive landscape

Leading Companies, Market Positioning of Companies, Competitive Strategies, and Industry Risks

Key companies profiled

Anchor Brewers and Distillers LLC, Bacardi Ltd., Campari Group, Contratto srl, DOWS Port, E. and J. Gallo Winery, Emilio Lustau S.A., Fonseca Port Wine, Fratelli Gancia and C. SpA, Mazurans Vineyards Ltd., Precept Wine, Ramos Pinto, Rhys and Rylee LLC, SOGEVINUS FINE WINES SA, Sogrape SGPS SA, Symington Family Estates Vinhos S.A., Taylors Port, The Great Wine Co., Vinbros and Co., and Vinimark Trading Pty Ltd.

Market dynamics

Parent market analysis, market growth inducers and obstacles, market forecast, fast-growing and slow-growing segment analysis, COVID-19 impact and recovery analysis and future consumer dynamics, market condition analysis for the forecast period

Customization purview

If our market report has not included the data that you are looking for, you can reach out to our analysts and get segments customized.

Request Free Sample

What are the Key Data Covered in this Market Research and Growth Report?

  • CAGR of the market during the forecast period
  • Detailed information on factors that will drive the market growth and forecasting between 2024 and 2028
  • Precise estimation of the size of the market  and its contribution of the market in focus to the parent market
  • Accurate predictions about upcoming market growth and trends and changes in consumer behaviour
  • Growth of the market across Europe, North America, APAC, South America, and Middle East and Africa
  • Thorough analysis of the market's competitive landscape and detailed information about companies
  • Comprehensive analysis of factors that will challenge the growth of market companies

We can help! Our analysts can customize this market research report to meet your requirements. Get in touch

1 Executive Summary

  • 1.1 Market overview
    • Executive Summary - Chart on Market Overview
    • Executive Summary - Data Table on Market Overview
    • Executive Summary - Chart on Global Market Characteristics
    • Executive Summary - Chart on Market by Geography
    • Executive Summary - Chart on Market Segmentation by Product Type
    • Executive Summary - Chart on Market Segmentation by Distribution Channel
    • Executive Summary - Chart on Incremental Growth
    • Executive Summary - Data Table on Incremental Growth
    • Executive Summary - Chart on Company Market Positioning

2 Market Landscape

  • 2.1 Market ecosystem
    • Parent Market
    • Data Table on - Parent Market
  • 2.2 Market characteristics
    • Market characteristics analysis
  • 2.3 Value chain analysis
    • Value Chain Analysis

3 Market Sizing

  • 3.1 Market definition
    • Offerings of companies included in the market definition
  • 3.2 Market segment analysis
    • Market segments
  • 3.3 Market size 2023
    • 3.4 Market outlook: Forecast for 2023-2028
      • Chart on Global - Market size and forecast 2023-2028 ($ million)
      • Data Table on Global - Market size and forecast 2023-2028 ($ million)
      • Chart on Global Market: Year-over-year growth 2023-2028 (%)
      • Data Table on Global Market: Year-over-year growth 2023-2028 (%)

    4 Historic Market Size

    • 4.1 Global Fortified Wine Market 2018 - 2022
      • Historic Market Size - Data Table on Global Fortified Wine Market 2018 - 2022 ($ million)
    • 4.2 Product Type segment analysis 2018 - 2022
      • Historic Market Size - Product Type Segment 2018 - 2022 ($ million)
    • 4.3 Distribution Channel segment analysis 2018 - 2022
      • Historic Market Size - Distribution Channel Segment 2018 - 2022 ($ million)
    • 4.4 Geography segment analysis 2018 - 2022
      • Historic Market Size - Geography Segment 2018 - 2022 ($ million)
    • 4.5 Country segment analysis 2018 - 2022
      • Historic Market Size - Country Segment 2018 - 2022 ($ million)

    5 Five Forces Analysis

    • 5.1 Five forces summary
      • Five forces analysis - Comparison between 2023 and 2028
    • 5.2 Bargaining power of buyers
      • Bargaining power of buyers - Impact of key factors 2023 and 2028
    • 5.3 Bargaining power of suppliers
      • Bargaining power of suppliers - Impact of key factors in 2023 and 2028
    • 5.4 Threat of new entrants
      • Threat of new entrants - Impact of key factors in 2023 and 2028
    • 5.5 Threat of substitutes
      • Threat of substitutes - Impact of key factors in 2023 and 2028
    • 5.6 Threat of rivalry
      • Threat of rivalry - Impact of key factors in 2023 and 2028
    • 5.7 Market condition
      • Chart on Market condition - Five forces 2023 and 2028

    6 Market Segmentation by Product Type

    • 6.1 Market segments
      • Chart on Product Type - Market share 2023-2028 (%)
      • Data Table on Product Type - Market share 2023-2028 (%)
    • 6.2 Comparison by Product Type
      • Chart on Comparison by Product Type
      • Data Table on Comparison by Product Type
    • 6.3 Sherry - Market size and forecast 2023-2028
      • Chart on Sherry - Market size and forecast 2023-2028 ($ million)
      • Data Table on Sherry - Market size and forecast 2023-2028 ($ million)
      • Chart on Sherry - Year-over-year growth 2023-2028 (%)
      • Data Table on Sherry - Year-over-year growth 2023-2028 (%)
    • 6.4 Port - Market size and forecast 2023-2028
      • Chart on Port - Market size and forecast 2023-2028 ($ million)
      • Data Table on Port - Market size and forecast 2023-2028 ($ million)
      • Chart on Port - Year-over-year growth 2023-2028 (%)
      • Data Table on Port - Year-over-year growth 2023-2028 (%)
    • 6.5 Vermouth - Market size and forecast 2023-2028
      • Chart on Vermouth - Market size and forecast 2023-2028 ($ million)
      • Data Table on Vermouth - Market size and forecast 2023-2028 ($ million)
      • Chart on Vermouth - Year-over-year growth 2023-2028 (%)
      • Data Table on Vermouth - Year-over-year growth 2023-2028 (%)
    • 6.6 Others - Market size and forecast 2023-2028
      • Chart on Others - Market size and forecast 2023-2028 ($ million)
      • Data Table on Others - Market size and forecast 2023-2028 ($ million)
      • Chart on Others - Year-over-year growth 2023-2028 (%)
      • Data Table on Others - Year-over-year growth 2023-2028 (%)
    • 6.7 Market opportunity by Product Type
      • Market opportunity by Product Type ($ million)
      • Data Table on Market opportunity by Product Type ($ million)

    7 Market Segmentation by Distribution Channel

    • 7.1 Market segments
      • Chart on Distribution Channel - Market share 2023-2028 (%)
      • Data Table on Distribution Channel - Market share 2023-2028 (%)
    • 7.2 Comparison by Distribution Channel
      • Chart on Comparison by Distribution Channel
      • Data Table on Comparison by Distribution Channel
    • 7.3 Off-trade - Market size and forecast 2023-2028
      • Chart on Off-trade - Market size and forecast 2023-2028 ($ million)
      • Data Table on Off-trade - Market size and forecast 2023-2028 ($ million)
      • Chart on Off-trade - Year-over-year growth 2023-2028 (%)
      • Data Table on Off-trade - Year-over-year growth 2023-2028 (%)
    • 7.4 On-trade - Market size and forecast 2023-2028
      • Chart on On-trade - Market size and forecast 2023-2028 ($ million)
      • Data Table on On-trade - Market size and forecast 2023-2028 ($ million)
      • Chart on On-trade - Year-over-year growth 2023-2028 (%)
      • Data Table on On-trade - Year-over-year growth 2023-2028 (%)
    • 7.5 Market opportunity by Distribution Channel
      • Market opportunity by Distribution Channel ($ million)
      • Data Table on Market opportunity by Distribution Channel ($ million)

    8 Market Segmentation by Body Type

    • 8.1 Market segments
      • Chart on Body Type - Market share (2023-2028) (%)
      • Data Table on Body Type - Market share (2023-2028) (%)
    • 8.2 Comparison by Body Type
      • Chart on Comparison by Body Type
      • Data Table on Comparison by Body Type
    • 8.3 Light bodied - Market size and forecast (2023-2028)
      • Chart on Light bodied - Market size and forecast (2023-2028) ($ million)
      • Data Table on Light bodied - Market size and forecast (2023-2028) ($ million)
      • Chart on Light bodied - Year-over-year growth (2023-2028) (%)
      • Data Table on Light bodied - Year-over-year growth (2023-2028) (%)
    • 8.4 Medium bodied - Market size and forecast (2023-2028)
      • Chart on Medium bodied - Market size and forecast (2023-2028) ($ million)
      • Data Table on Medium bodied - Market size and forecast (2023-2028) ($ million)
      • Chart on Medium bodied - Year-over-year growth (2023-2028) (%)
      • Data Table on Medium bodied - Year-over-year growth (2023-2028) (%)
    • 8.5 Full bodied - Market size and forecast (2023-2028)
      • Chart on Full bodied - Market size and forecast (2023-2028) ($ million)
      • Data Table on Full bodied - Market size and forecast (2023-2028) ($ million)
      • Chart on Full bodied - Year-over-year growth (2023-2028) (%)
      • Data Table on Full bodied - Year-over-year growth (2023-2028) (%)
    • 8.6 Market opportunity by Body Type
      • Market opportunity by $segment_name ($ million)
      • Data Table on Market opportunity by $segment_name ($ million)

    9 Market Segmentation by Sweetness Level

    • 9.1 Market segments
      • Chart on Sweetness Level - Market share (2023-2028) (%)
      • Data Table on Sweetness Level - Market share (2023-2028) (%)
    • 9.2 Comparison by Sweetness Level
      • Chart on Comparison by Sweetness Level
      • Data Table on Comparison by Sweetness Level
    • 9.3 Dry - Market size and forecast (2023-2028)
      • Chart on Dry - Market size and forecast (2023-2028) ($ million)
      • Data Table on Dry - Market size and forecast (2023-2028) ($ million)
      • Chart on Dry - Year-over-year growth (2023-2028) (%)
      • Data Table on Dry - Year-over-year growth (2023-2028) (%)
    • 9.4 Semi Sweet - Market size and forecast (2023-2028)
      • Chart on Semi Sweet - Market size and forecast (2023-2028) ($ million)
      • Data Table on Semi Sweet - Market size and forecast (2023-2028) ($ million)
      • Chart on Semi Sweet - Year-over-year growth (2023-2028) (%)
      • Data Table on Semi Sweet - Year-over-year growth (2023-2028) (%)
    • 9.5 Sweet - Market size and forecast (2023-2028)
      • Chart on Sweet - Market size and forecast (2023-2028) ($ million)
      • Data Table on Sweet - Market size and forecast (2023-2028) ($ million)
      • Chart on Sweet - Year-over-year growth (2023-2028) (%)
      • Data Table on Sweet - Year-over-year growth (2023-2028) (%)
    • 9.6 Market opportunity by Sweetness Level
      • Market opportunity by $segment_name ($ million)
      • Data Table on Market opportunity by $segment_name ($ million)

    10 Customer Landscape

    • 10.1 Customer landscape overview
      • Analysis of price sensitivity, lifecycle, customer purchase basket, adoption rates, and purchase criteria

    11 Geographic Landscape

    • 11.1 Geographic segmentation
      • Chart on Market share by geography 2023-2028 (%)
      • Data Table on Market share by geography 2023-2028 (%)
    • 11.2 Geographic comparison
      • Chart on Geographic comparison
      • Data Table on Geographic comparison
    • 11.3 Europe - Market size and forecast 2023-2028
      • Chart on Europe - Market size and forecast 2023-2028 ($ million)
      • Data Table on Europe - Market size and forecast 2023-2028 ($ million)
      • Chart on Europe - Year-over-year growth 2023-2028 (%)
      • Data Table on Europe - Year-over-year growth 2023-2028 (%)
    • 11.4 North America - Market size and forecast 2023-2028
      • Chart on North America - Market size and forecast 2023-2028 ($ million)
      • Data Table on North America - Market size and forecast 2023-2028 ($ million)
      • Chart on North America - Year-over-year growth 2023-2028 (%)
      • Data Table on North America - Year-over-year growth 2023-2028 (%)
    • 11.5 APAC - Market size and forecast 2023-2028
      • Chart on APAC - Market size and forecast 2023-2028 ($ million)
      • Data Table on APAC - Market size and forecast 2023-2028 ($ million)
      • Chart on APAC - Year-over-year growth 2023-2028 (%)
      • Data Table on APAC - Year-over-year growth 2023-2028 (%)
    • 11.6 South America - Market size and forecast 2023-2028
      • Chart on South America - Market size and forecast 2023-2028 ($ million)
      • Data Table on South America - Market size and forecast 2023-2028 ($ million)
      • Chart on South America - Year-over-year growth 2023-2028 (%)
      • Data Table on South America - Year-over-year growth 2023-2028 (%)
    • 11.7 Middle East and Africa - Market size and forecast 2023-2028
      • Chart on Middle East and Africa - Market size and forecast 2023-2028 ($ million)
      • Data Table on Middle East and Africa - Market size and forecast 2023-2028 ($ million)
      • Chart on Middle East and Africa - Year-over-year growth 2023-2028 (%)
      • Data Table on Middle East and Africa - Year-over-year growth 2023-2028 (%)
    • 11.8 US - Market size and forecast 2023-2028
      • Chart on US - Market size and forecast 2023-2028 ($ million)
      • Data Table on US - Market size and forecast 2023-2028 ($ million)
      • Chart on US - Year-over-year growth 2023-2028 (%)
      • Data Table on US - Year-over-year growth 2023-2028 (%)
    • 11.9 France - Market size and forecast 2023-2028
      • Chart on France - Market size and forecast 2023-2028 ($ million)
      • Data Table on France - Market size and forecast 2023-2028 ($ million)
      • Chart on France - Year-over-year growth 2023-2028 (%)
      • Data Table on France - Year-over-year growth 2023-2028 (%)
    • 11.10 Italy - Market size and forecast 2023-2028
      • Chart on Italy - Market size and forecast 2023-2028 ($ million)
      • Data Table on Italy - Market size and forecast 2023-2028 ($ million)
      • Chart on Italy - Year-over-year growth 2023-2028 (%)
      • Data Table on Italy - Year-over-year growth 2023-2028 (%)
    • 11.11 Germany - Market size and forecast 2023-2028
      • Chart on Germany - Market size and forecast 2023-2028 ($ million)
      • Data Table on Germany - Market size and forecast 2023-2028 ($ million)
      • Chart on Germany - Year-over-year growth 2023-2028 (%)
      • Data Table on Germany - Year-over-year growth 2023-2028 (%)
    • 11.12 UK - Market size and forecast 2023-2028
      • Chart on UK - Market size and forecast 2023-2028 ($ million)
      • Data Table on UK - Market size and forecast 2023-2028 ($ million)
      • Chart on UK - Year-over-year growth 2023-2028 (%)
      • Data Table on UK - Year-over-year growth 2023-2028 (%)
    • 11.13 Market opportunity by geography
      • Market opportunity by geography ($ million)
      • Data Tables on Market opportunity by geography ($ million)

    12 Drivers, Challenges, and Opportunity/Restraints

    • 12.1 Market drivers
      • 12.2 Market challenges
        • 12.3 Impact of drivers and challenges
          • Impact of drivers and challenges in 2023 and 2028
        • 12.4 Market opportunities/restraints

          13 Competitive Landscape

          • 13.1 Overview
            • 13.2 Competitive Landscape
              • Overview on criticality of inputs and factors of differentiation
            • 13.3 Landscape disruption
              • Overview on factors of disruption
            • 13.4 Industry risks
              • Impact of key risks on business

            14 Competitive Analysis

            • 14.1 Companies profiled
              • Companies covered
            • 14.2 Market positioning of companies
              • Matrix on companies position and classification
            • 14.3 Anchor Brewers and Distillers LLC
              • Anchor Brewers and Distillers LLC - Overview
              • Anchor Brewers and Distillers LLC - Product / Service
              • Anchor Brewers and Distillers LLC - Key offerings
            • 14.4 Bacardi Ltd.
              • Bacardi Ltd. - Overview
              • Bacardi Ltd. - Product / Service
              • Bacardi Ltd. - Key news
              • Bacardi Ltd. - Key offerings
            • 14.5 Campari Group
              • Campari Group - Overview
              • Campari Group - Business segments
              • Campari Group - Key offerings
              • Campari Group - Segment focus
            • 14.6 Contratto srl
              • Contratto srl - Overview
              • Contratto srl - Product / Service
              • Contratto srl - Key offerings
            • 14.7 DOWS Port
              • DOWS Port - Overview
              • DOWS Port - Product / Service
              • DOWS Port - Key offerings
            • 14.8 E. and J. Gallo Winery
              • E. and J. Gallo Winery - Overview
              • E. and J. Gallo Winery - Product / Service
              • E. and J. Gallo Winery - Key offerings
            • 14.9 Fonseca Port Wine
              • Fonseca Port Wine - Overview
              • Fonseca Port Wine - Product / Service
              • Fonseca Port Wine - Key offerings
            • 14.10 Fratelli Gancia and C. SpA
              • Fratelli Gancia and C. SpA - Overview
              • Fratelli Gancia and C. SpA - Product / Service
              • Fratelli Gancia and C. SpA - Key offerings
            • 14.11 Precept Wine
              • Precept Wine - Overview
              • Precept Wine - Product / Service
              • Precept Wine - Key offerings
            • 14.12 Ramos Pinto
              • Ramos Pinto - Overview
              • Ramos Pinto - Product / Service
              • Ramos Pinto - Key offerings
            • 14.13 Rhys and Rylee LLC
              • Rhys and Rylee LLC - Overview
              • Rhys and Rylee LLC - Product / Service
              • Rhys and Rylee LLC - Key offerings
            • 14.14 SOGEVINUS FINE WINES SA
              • SOGEVINUS FINE WINES SA - Overview
              • SOGEVINUS FINE WINES SA - Product / Service
              • SOGEVINUS FINE WINES SA - Key offerings
            • 14.15 Symington Family Estates Vinhos S.A.
              • Symington Family Estates Vinhos S.A. - Overview
              • Symington Family Estates Vinhos S.A. - Product / Service
              • Symington Family Estates Vinhos S.A. - Key offerings
            • 14.16 Taylors Port
              • Taylors Port - Overview
              • Taylors Port - Product / Service
              • Taylors Port - Key offerings
            • 14.17 Vinbros and Co.
              • Vinbros and Co. - Overview
              • Vinbros and Co. - Product / Service
              • Vinbros and Co. - Key offerings

            15 Appendix

            • 15.1 Scope of the report
              • 15.2 Inclusions and exclusions checklist
                • Inclusions checklist
                • Exclusions checklist
              • 15.3 Currency conversion rates for US$
                • Currency conversion rates for US$
              • 15.4 Research methodology
                • Research methodology
              • 15.5 Data procurement
                • Information sources
              • 15.6 Data validation
                • Data validation
              • 15.7 Validation techniques employed for market sizing
                • Validation techniques employed for market sizing
              • 15.8 Data synthesis
                • Data synthesis
              • 15.9 360 degree market analysis
                • 360 degree market analysis
              • 15.10 List of abbreviations
                • List of abbreviations

              Research Methodology

              Technavio presents a detailed picture of the market by way of study, synthesis, and summation of data from multiple sources. The analysts have presented the various facets of the market with a particular focus on identifying the key industry influencers. The data thus presented is comprehensive, reliable, and the result of extensive research, both primary and secondary.

              INFORMATION SOURCES

              Primary sources

              • Manufacturers and suppliers
              • Channel partners
              • Industry experts
              • Strategic decision makers

              Secondary sources

              • Industry journals and periodicals
              • Government data
              • Financial reports of key industry players
              • Historical data
              • Press releases

              DATA ANALYSIS

              Data Synthesis

              • Collation of data
              • Estimation of key figures
              • Analysis of derived insights

              Data Validation

              • Triangulation with data models
              • Reference against proprietary databases
              • Corroboration with industry experts

              REPORT WRITING

              Qualitative

              • Market drivers
              • Market challenges
              • Market trends
              • Five forces analysis

              Quantitative

              • Market size and forecast
              • Market segmentation
              • Geographical insights
              • Competitive landscape

              Interested in this report?

              Get your sample now to see our research methodology and insights!

              Download Now

              Frequently Asked Questions

              Fortified Wine market growth will increase by $ 4381.5 mn during 2024-2028.

              The Fortified Wine market is expected to grow at a CAGR of 4.36% during 2024-2028.

              Fortified Wine market is segmented by Product Type( Sherry, Port, Vermouth, Others) Distribution Channel( Off-trade, On-trade)

              Anchor Brewers and Distillers LLC, Bacardi Ltd., Campari Group, Contratto srl, DOWS Port, E. and J. Gallo Winery, Emilio Lustau S.A., Fonseca Port Wine, Fratelli Gancia and C. SpA, Mazurans Vineyards Ltd., Precept Wine, Ramos Pinto, Rhys and Rylee LLC, SOGEVINUS FINE WINES SA, Sogrape SGPS SA, Symington Family Estates Vinhos S.A., Taylors Port, The Great Wine Co., Vinbros and Co., Vinimark Trading Pty Ltd. are a few of the key vendors in the Fortified Wine market.

              APAC will register the highest growth rate of 38% among the other regions. Therefore, the Fortified Wine market in APAC is expected to garner significant business opportunities for the vendors during the forecast period.

              US, France, Italy, Germany, UK

              • Rising consumption rate of wine consumptionThe global fortified wine market has witnessed a significant rise in consumption rates in recent years. This growing trend can be attributed to various factors is the driving factor this market.
              • such as changing consumer preferences is the driving factor this market.
              • increasing disposable incomes is the driving factor this market.
              • and expanding wine tourism.One of the main reasons for the surge in wine consumption is the shift in consumer preferences towards healthier and premium alcoholic beverages. Wine is perceived as a healthier option compared to other alcoholic beverages due to its lower alcohol content and the presence of antioxidants. Additionally is the driving factor this market.
              • fortified wine offers a wide range of flavors and varieties is the driving factor this market.
              • catering to the diverse taste preferences of consumers. Moreover is the driving factor this market.
              • the increasing disposable incomes of consumers around the world have also played a major role in driving  the market growth. As people have more disposable income to spend on luxury items is the driving factor this market.
              • they are increasingly willing to invest in premium wines. This has led to an increased demand for high-quality fortified wines from renowned wine producers. Furthermore is the driving factor this market.
              • wine tourism has gained significant popularity in recent years is the driving factor this market.
              • leading to an increase in wine consumption. Many wine-producing regions have developed wine tourism destinations is the driving factor this market.
              • offering visitors the opportunity to explore vineyards is the driving factor this market.
              • participate in wine tastings is the driving factor this market.
              • and learn about the winemaking process. This has fueled the interest and curiosity of consumers is the driving factor this market.
              • encouraging them to try out different types of fortified wines. For example is the driving factor this market.
              • the consumption of Port wine is the driving factor this market.
              • a popular fortified wine is the driving factor this market.
              • has seen a steady rise in recent years. Port wine is produced in the Douro Valley region of Portugal and is known for its rich flavors and long aging process. The increasing global recognition of Port wine and its unique taste profile has attracted a growing number of consumers in various countries. Another example is Vermouth is the driving factor this market.
              • a fortified wine that has gained popularity in many cocktail recipes. Vermouth is often used as an essential ingredient in cocktails such as Martini and Negroni. Its versatile nature and distinct flavors have made it a preferred choice among mixologists and cocktail enthusiasts is the driving factor this market.
              • contributing to its increasing consumption worldwide. Thus is the driving factor this market.
              • the above-mentioned factors are expected to increase the demand for fortified wines is the driving factor this market.
              • which will propel the growth of the global fortified wine market during the forecast period. is the driving factor this market.

              The Fortified Wine market vendors should focus on grabbing business opportunities from the Sherry segment as it accounted for the largest market share in the base year.