Footwear Market Analysis, Size, and Forecast 2026-2030: APAC (China, Japan, and India), Europe (Germany, UK, and France), North America (US, Canada, and Mexico), South America (Brazil and Argentina), Middle East and Africa (Saudi Arabia, UAE, and South Africa), and Rest of World (ROW)

Footwear Market Analysis, Size, and Forecast 2026-2030:
APAC (China, Japan, and India), Europe (Germany, UK, and France), North America (US, Canada, and Mexico), South America (Brazil and Argentina), Middle East and Africa (Saudi Arabia, UAE, and South Africa), and Rest of World (ROW)

Published: Mar 2026 288 Pages SKU: IRTNTR40599

Market Overview at a Glance

$109.7 B
Market Opportunity
4.3%
CAGR 2025 - 2030
48%
APAC Growth
$337.5 B
Non-athletic footwear segment 2024

Footwear Market Size 2026-2030

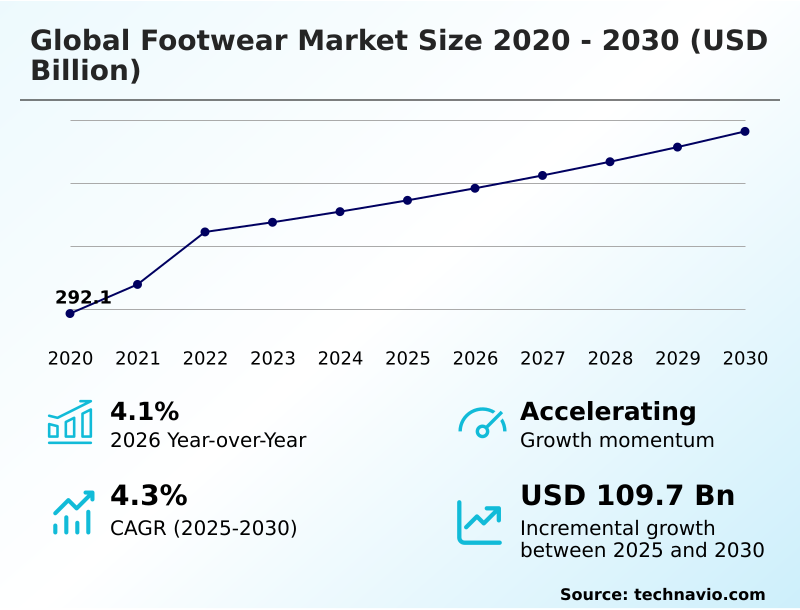
The footwear market size is valued to increase by USD 109.7 billion, at a CAGR of 4.3% from 2025 to 2030. Pervasive influence of athleisure and fusion of performance with style will drive the footwear market.

Major Market Trends & Insights

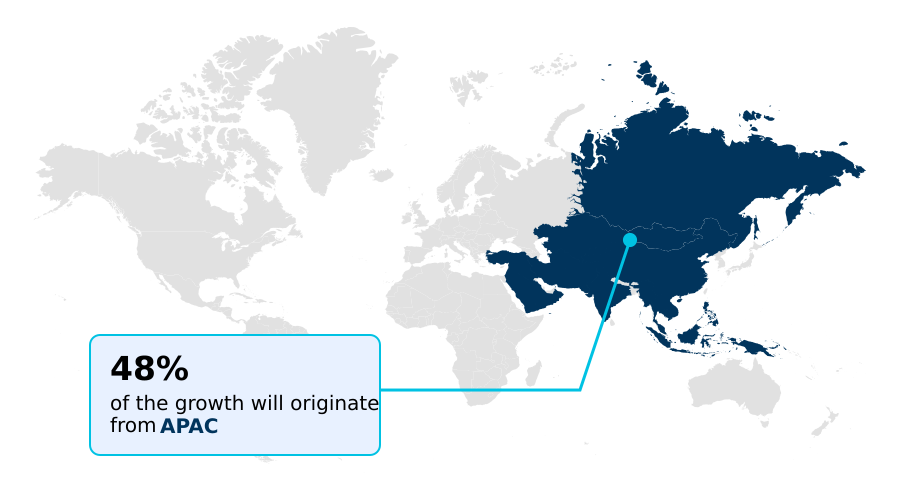
  • APAC dominated the market and accounted for a 48% growth during the forecast period.
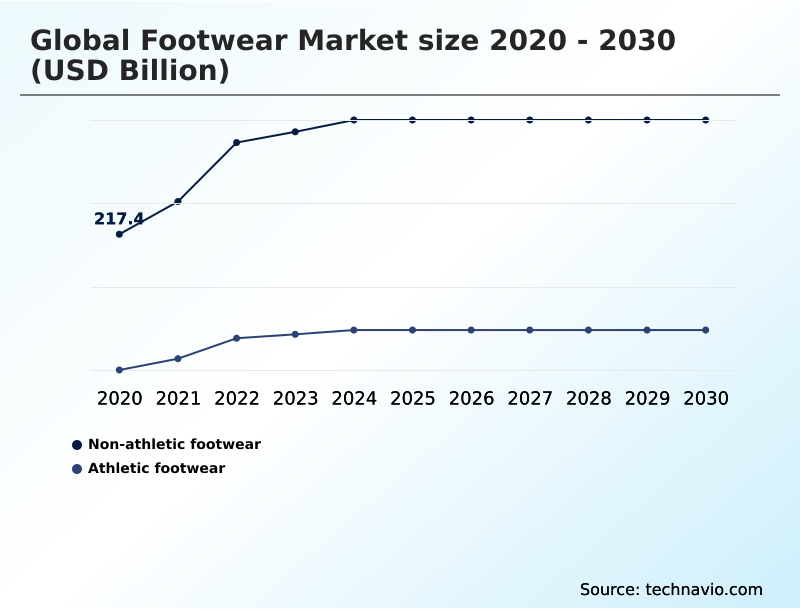
  • By Product - Non-athletic footwear segment was valued at USD 337.5 billion in 2024
  • By End-user - Men segment accounted for the largest market revenue share in 2024

Market Size & Forecast

  • Market Opportunities: USD 289.8 billion
  • Market Future Opportunities: USD 109.7 billion
  • CAGR from 2025 to 2030 : 4.3%

Market Summary

  • The footwear market is undergoing a significant transformation, driven by the convergence of fashion, technology, and sustainability. The deep influence of the athleisure movement continues to blur the lines between performance athletic footwear and casual lifestyle sneakers, creating strong demand for hybrid, multi-functional products.
  • This shift is mirrored by a growing consumer insistence on ethical production standards and sustainable raw materials, pushing brands toward circular economy models and greater supply chain transparency. For example, a brand leveraging a direct-to-consumer model can utilize sales data to inform on-demand manufacturing at regional micro-factories, effectively reducing waste and mitigating the risks of logistical bottlenecks.
  • This agile approach, powered by AI-driven recommendations and virtual try-on tools, allows for hyper-personalization at scale. However, the industry simultaneously grapples with challenges like production cost escalation and the need for robust intellectual property protection against sophisticated counterfeiting. Success hinges on balancing innovation with operational resilience and a genuine commitment to sustainability.

What will be the Size of the Footwear Market during the forecast period?

Get Key Insights on Market Forecast (PDF) Request Free Sample

How is the Footwear Market Segmented?

The footwear industry research report provides comprehensive data (region-wise segment analysis), with forecasts and estimates in "USD billion" for the period 2026-2030, as well as historical data from 2020-2024 for the following segments.

  • Product
    • Non-athletic footwear
    • Athletic footwear
  • End-user
    • Men
    • Women
    • Children
  • Distribution channel
    • Offline
    • Online
  • Geography
    • APAC
      • China
      • Japan
      • India
    • Europe
      • Germany
      • UK
      • France
    • North America
      • US
      • Canada
      • Mexico
    • South America
      • Brazil
      • Argentina
    • Middle East and Africa
      • Saudi Arabia
      • UAE
      • South Africa
    • Rest of World (ROW)

By Product Insights

The non-athletic footwear segment is estimated to witness significant growth during the forecast period.

The non-athletic footwear segment is evolving beyond traditional categories, heavily influenced by the athleisure movement.

A significant shift in consumer purchasing behavior is compelling brands to create hybrid multi-functional footwear that merges classic aesthetics with the ergonomic footwear design principles of casual lifestyle sneakers.

This has spurred sustainable material innovation, with a focus on plant-based leather alternatives and other sustainable raw materials. To meet this demand, companies are increasingly adopting a direct-to-consumer model, which improves supply chain transparency.

Surveys indicate over 60% of consumers now prioritize comfort-centric features in formal wear, reinforcing the move toward performance technology integration. This evolution demands agile responses to both style and substance.

Request Free Sample

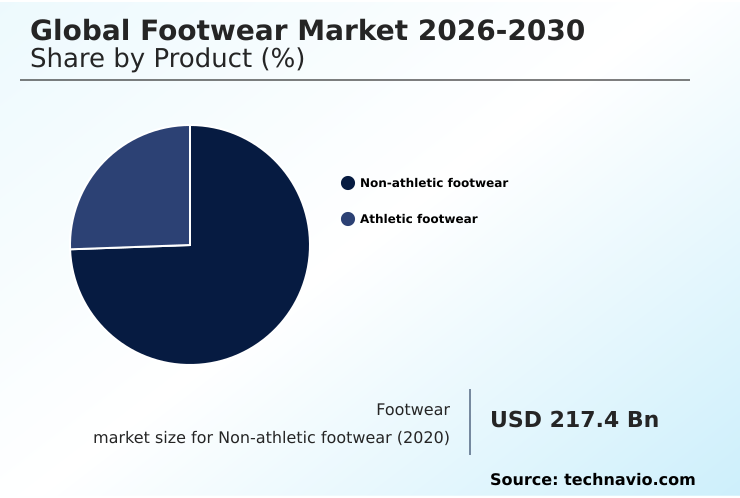
The Non-athletic footwear segment was valued at USD 337.5 billion in 2024 and showed a gradual increase during the forecast period.

Request Free Sample

Regional Analysis

APAC is estimated to contribute 48% to the growth of the global market during the forecast period.Technavio’s analysts have elaborately explained the regional trends and drivers that shape the market during the forecast period.

See How Footwear Market Demand is Rising in APAC Request Free Sample

The global landscape is led by APAC, which accounts for 48% of incremental growth, driven by rising disposable incomes and a mobile-first e-commerce ecosystem.

In North America, which represents 25% of the growth opportunity, the market is characterized by strong brand loyalty and a dominant sneaker culture influence, with a high demand for the luxury footwear segment.

Europe focuses on quality and ethical production standards, heavily influenced by regulations. Across these regions, a key challenge remains geopolitical instability risks, which can disrupt supply chains.

To counter this, some firms are exploring a nearshoring production strategy, with adoption of regional micro-factories in certain areas reducing logistical bottlenecks by up to 20%, showcasing a move towards more resilient operational models.

Market Dynamics

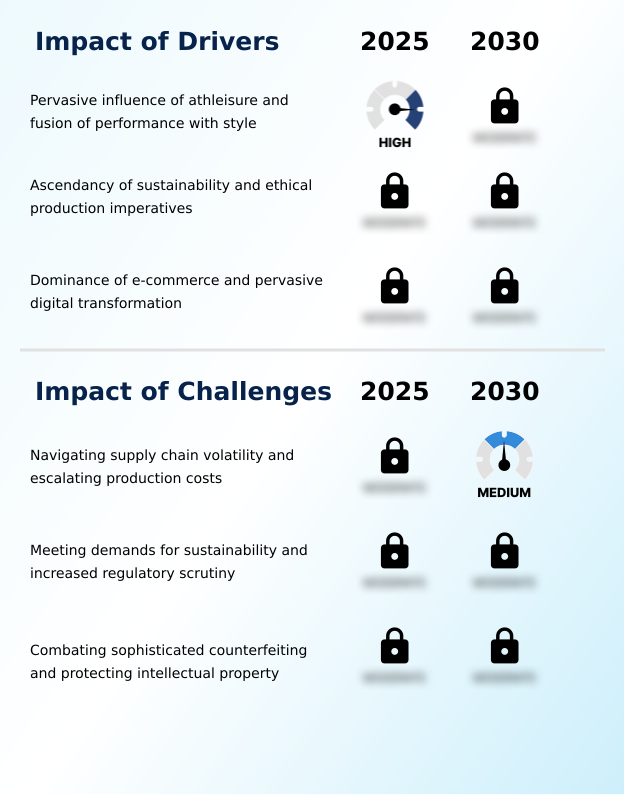
Our researchers analyzed the data with 2025 as the base year, along with the key drivers, trends, and challenges. A holistic analysis of drivers will help companies refine their marketing strategies to gain a competitive advantage.

  • The modern footwear market is defined by the profound impact of athleisure on footwear design, which necessitates advanced technology integration in lifestyle footwear and even influences ergonomic design for formal shoes.
  • This convergence is coupled with a strong consumer demand for ethical footwear, pushing the industry toward a circular economy in athletic footwear and the use of sustainable materials for non-athletic shoes. This shift is reinforced by strengthening sustainability regulations for footwear industry, including the rollout of digital product passports in fashion.
  • To meet these evolving expectations, brands are adopting hyper-personalization with 3d printing and exploring the role of ai in footwear retail. A successful dtc strategy for footwear brands is crucial, often supported by regional micro-factories for customization that cater to trends amplified by the impact of social media on sneaker culture.
  • Brands that have effectively implemented such localized production have reported a reduction in excess inventory by over 25% compared to traditional wholesale models. However, these opportunities are tempered by significant challenges of global footwear supply chains, including supply chain risks from geopolitical instability and the difficulty of managing rising production costs.
  • Furthermore, the industry is constantly engaged in combating counterfeit luxury sneakers and protecting ip in online marketplaces to preserve brand value.

What are the key market drivers leading to the rise in the adoption of Footwear Industry?

  • A key market driver is the pervasive influence of athleisure, which creates sustained demand for footwear that fuses high-performance functionality with sophisticated style.

  • Market growth is primarily propelled by the enduring athleisure movement and the widespread adoption of digital technologies.
  • The direct-to-consumer model has become a critical channel, enabling brands to control their narrative and margins, with some achieving profit improvements of up to 20%.
  • This digital shift is enhanced by tools that improve the online shopping experience; for instance, the use of AI-powered virtual try-on tools has reduced online return rates by a reported 35% in pilot programs.
  • These technologies not only boost consumer confidence but also provide valuable data that informs product development, from performance athletic footwear to casual lifestyle sneakers, making the digital ecosystem a core driver of innovation and sales.

What are the market trends shaping the Footwear Industry?

  • A key market trend is the imperative for a circular economy, which is driving significant advancements in material innovation. This includes the development and adoption of sustainable inputs and end-of-life solutions.

  • Key trends are reshaping the market, moving it toward a more sustainable and personalized future. The push for a circular economy is driving significant sustainable material innovation, with brands exploring advanced materials like bio-fabricated leathers. This shift is supported by on-demand manufacturing, which allows for greater customization and waste reduction.
  • Brands using hyper-personalization manufacturing report a 25% increase in customer loyalty. Furthermore, the integration of advanced material science into both athletic and casual footwear has led to products with 15% greater durability, meeting consumer demand for both style and longevity. These trends indicate a move away from mass production toward more agile, responsible, and consumer-centric models.

What challenges does the Footwear Industry face during its growth?

  • A primary challenge affecting industry growth is the need to navigate significant supply chain volatility and escalating production costs.

  • The industry faces significant operational and reputational challenges. Supply chain volatility remains a primary concern, with unpredictable logistical bottlenecks and rising production cost escalation straining margins. Transportation costs in key trade lanes have increased by over 40%, directly impacting profitability. Concurrently, the threat from sophisticated counterfeiting and the prevalence of high-quality replicas requires constant investment in intellectual property rights protection.
  • The fight against fakes costs the industry an estimated 10% of its annual revenue. Navigating these complexities, alongside rising consumer expectations for sustainability and transparency, defines the current competitive landscape and demands strategic resilience from all market participants.

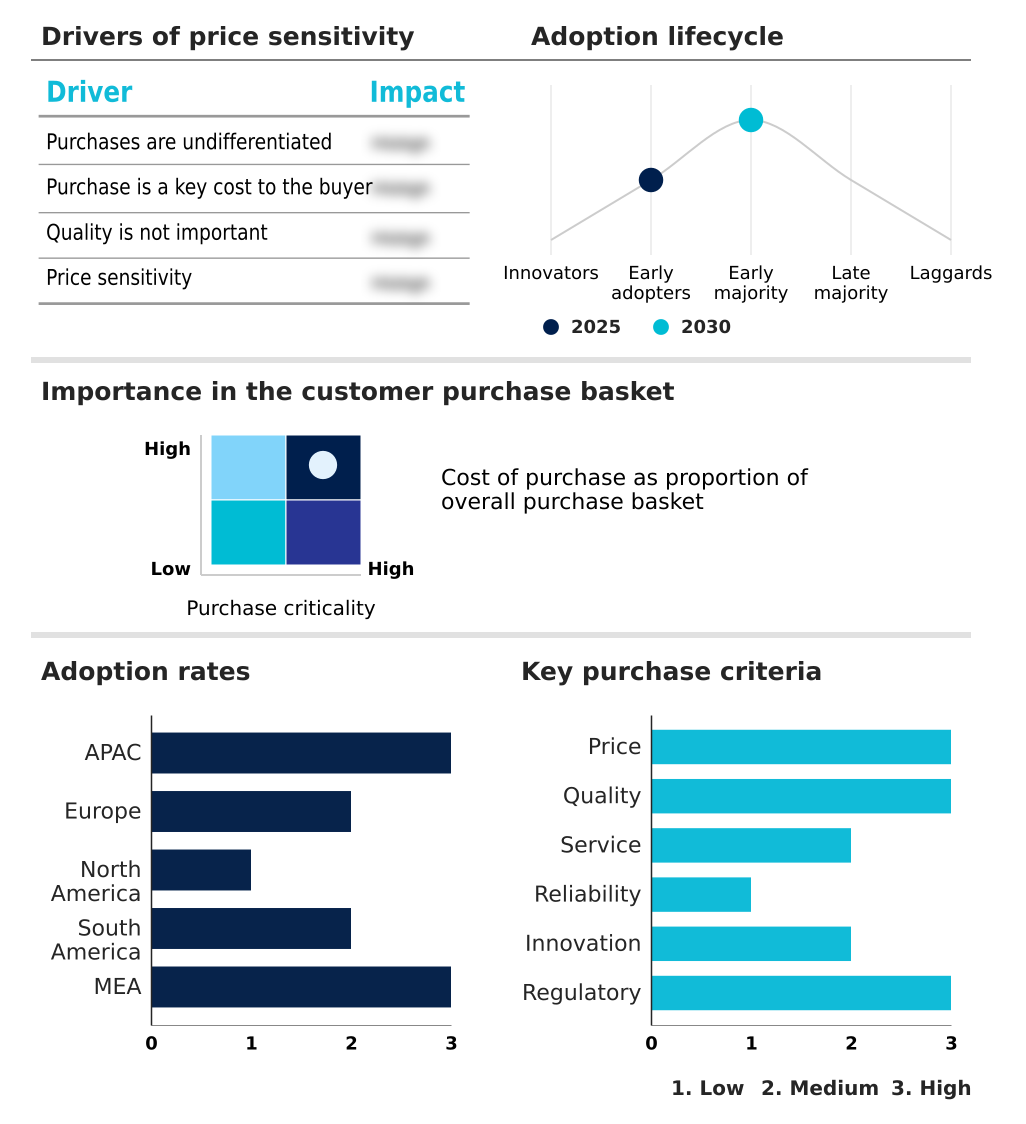
Exclusive Technavio Analysis on Customer Landscape

The footwear market forecasting report includes the adoption lifecycle of the market, covering from the innovator’s stage to the laggard’s stage. It focuses on adoption rates in different regions based on penetration. Furthermore, the footwear market report also includes key purchase criteria and drivers of price sensitivity to help companies evaluate and develop their market growth analysis strategies.

Customer Landscape of Footwear Industry

Competitive Landscape

Companies are implementing various strategies, such as strategic alliances, footwear market forecast, partnerships, mergers and acquisitions, geographical expansion, and product/service launches, to enhance their presence in the industry.

Adidas AG - The vendor portfolio is centered on performance sports shoes and lifestyle sneakers, driven by innovation and global brand appeal to capture diverse consumer preferences.

The industry research and growth report includes detailed analyses of the competitive landscape of the market and information about key companies, including:

  • Adidas AG
  • ASICS Corp.
  • Brooks Sports Inc.
  • Burberry Group Plc
  • Dolce and Gabbana Srl
  • FILA Holdings Corp.
  • Geox S.p.A
  • Hermes International SA
  • Kering SA
  • LVMH Moet Hennessy
  • New Balance Athletics Inc.
  • Nike Inc.
  • PUMA SE
  • Skechers USA Inc.
  • Under Armour Inc.
  • VALENTINO Spa
  • VF Corp.
  • Wolverine World Wide Inc.

Qualitative and quantitative analysis of companies has been conducted to help clients understand the wider business environment as well as the strengths and weaknesses of key industry players. Data is qualitatively analyzed to categorize companies as pure play, category-focused, industry-focused, and diversified; it is quantitatively analyzed to categorize companies as dominant, leading, strong, tentative, and weak.

Recent Development and News in Footwear market

  • In May, 2025, VF Corp. announced the rollout of a new unified e-commerce platform designed to create a seamless cross-brand shopping experience and leverage shared data analytics for improved personalization.
  • In May, 2025, New Balance launched its NB Custom Fit program in flagship stores, featuring in-store 3D foot scanners to create biomechanical profiles for 3D-printing custom midsoles.
  • In April, 2025, Kering announced a long-term partnership with a German biomechanics research institute to co-develop a new line of haute couture footwear engineered for optimal ergonomic support.
  • In March, 2025, Adidas launched its Nomad Pro collection, featuring a modular design with independently replaceable soles and uppers, crafted from advanced lab-grown leather and recycled ocean plastics.

Dive into Technavio’s robust research methodology, blending expert interviews, extensive data synthesis, and validated models for unparalleled Footwear Market insights. See full methodology.

Market Scope
Page number 288
Base year 2025
Historic period 2020-2024
Forecast period 2026-2030
Growth momentum & CAGR Accelerate at a CAGR of 4.3%
Market growth 2026-2030 USD 109.7 billion
Market structure Fragmented
YoY growth 2025-2026(%) 4.1%
Key countries China, Japan, India, South Korea, Australia, Indonesia, Germany, UK, France, Italy, Spain, The Netherlands, US, Canada, Mexico, Brazil, Argentina, Chile, Saudi Arabia, UAE, South Africa, Israel and Turkey
Competitive landscape Leading Companies, Market Positioning of Companies, Competitive Strategies, and Industry Risks

Request Free Sample

Research Analyst Overview

  • The footwear market is characterized by rapid innovation, driven by the persistent athleisure movement and the corresponding need for performance technology integration. A critical boardroom-level concern is aligning with emerging regulations, such as the digital product passport, which compels a strategic shift toward circular economy models and sustainable material innovation, including bio-fabricated leathers and algae-based foams.
  • This is reshaping supply chains, where volatility and production cost escalation remain significant risks. In response, companies are leveraging a direct-to-consumer model, enhanced by virtual try-on tools and ai-powered recommendations, to enable hyper-personalization manufacturing. Adoption of additive manufacturing in regional micro-factories has enabled some firms to reduce lead times by over 40% for customized orders.
  • This move toward on-demand production also addresses geopolitical instability risks and logistical bottlenecks. Simultaneously, the industry continues to invest in advanced material science and counterfeiting protection to safeguard intellectual property rights against high-quality replicas and mitigate e-commerce marketplace liability.

What are the Key Data Covered in this Footwear Market Research and Growth Report?

  • What is the expected growth of the Footwear Market between 2026 and 2030?

    • USD 109.7 billion, at a CAGR of 4.3%

  • What segmentation does the market report cover?

    • The report is segmented by Product (Non-athletic footwear, and Athletic footwear), End-user (Men, Women, and Children), Distribution Channel (Offline, and Online) and Geography (APAC, Europe, North America, South America, Middle East and Africa)

  • Which regions are analyzed in the report?

    • APAC, Europe, North America, South America and Middle East and Africa

  • What are the key growth drivers and market challenges?

    • Pervasive influence of athleisure and fusion of performance with style, Navigating supply chain volatility and escalating production costs

  • Who are the major players in the Footwear Market?

    • Adidas AG, ASICS Corp., Brooks Sports Inc., Burberry Group Plc, Dolce and Gabbana Srl, FILA Holdings Corp., Geox S.p.A, Hermes International SA, Kering SA, LVMH Moet Hennessy, New Balance Athletics Inc., Nike Inc., PUMA SE, Skechers USA Inc., Under Armour Inc., VALENTINO Spa, VF Corp. and Wolverine World Wide Inc.

Market Research Insights

  • The market's dynamics are shaped by the powerful sneaker culture influence and the resulting demand for hybrid multi-functional footwear. This has pushed brands toward an omnichannel retail strategy that combines experiential retail concepts with seamless online experiences. Firms leveraging data-driven footwear customization have seen return rates drop by up to 30%, a significant improvement in operational efficiency.
  • This personalization is increasingly achieved through bespoke shoe manufacturing and advancements like smart running shoes with integrated biometric sensors. Furthermore, implementing eco-friendly product lifecycle management and supply chain transparency has been linked to a 15% improvement in brand trust metrics, highlighting the growing importance of ethical production standards in consumer decisions.

We can help! Our analysts can customize this footwear market research report to meet your requirements.

Get in touch

1. Executive Summary

1.1 Market overview

Executive Summary - Chart on Market Overview
Executive Summary - Data Table on Market Overview
Executive Summary - Chart on Global Market Characteristics
Executive Summary - Chart on Market by Geography
Executive Summary - Chart on Market Segmentation by Product
Executive Summary - Chart on Market Segmentation by End-user
Executive Summary - Chart on Market Segmentation by Distribution Channel
Executive Summary - Chart on Incremental Growth
Executive Summary - Data Table on Incremental Growth
Executive Summary - Chart on Company Market Positioning

2. Technavio Analysis

2.1 Analysis of price sensitivity, lifecycle, customer purchase basket, adoption rates, and purchase criteria

2.2 Criticality of inputs and Factors of differentiation

Chart on Overview on criticality of inputs and factors of differentiation

2.3 Factors of disruption

Chart on Overview on factors of disruption

2.4 Impact of drivers and challenges

Chart on Impact of drivers and challenges in 2025 and 2030

3. Market Landscape

3.1 Market ecosystem

Chart on Parent Market
Data Table on - Parent Market

3.2 Market characteristics

Chart on Market characteristics analysis

3.3 Value chain analysis

Chart on Value chain analysis

4. Market Sizing

4.1 Market definition

Data Table on Offerings of companies included in the market definition

4.2 Market segment analysis

Market segments

4.3 Market size 2025

4.4 Market outlook: Forecast for 2025-2030

Chart on Global - Market size and forecast 2025-2030 ($ billion)
Data Table on Global - Market size and forecast 2025-2030 ($ billion)
Chart on Global Market: Year-over-year growth 2025-2030 (%)
Data Table on Global Market: Year-over-year growth 2025-2030 (%)

5. Historic Market Size

5.1 Global Footwear Market 2020 - 2024

Historic Market Size - Data Table on Global Footwear Market 2020 - 2024 ($ billion)

5.2 Product segment analysis 2020 - 2024

Historic Market Size - Product Segment 2020 - 2024 ($ billion)

5.3 End-user segment analysis 2020 - 2024

Historic Market Size - End-user Segment 2020 - 2024 ($ billion)

5.4 Distribution Channel segment analysis 2020 - 2024

Historic Market Size - Distribution Channel Segment 2020 - 2024 ($ billion)

5.5 Geography segment analysis 2020 - 2024

Historic Market Size - Geography Segment 2020 - 2024 ($ billion)

5.6 Country segment analysis 2020 - 2024

Historic Market Size - Country Segment 2020 - 2024 ($ billion)

6. Qualitative Analysis

6.1 Impact of AI in Global Footwear Market

7. Five Forces Analysis

7.1 Five forces summary

Five forces analysis - Comparison between 2025 and 2030

7.2 Bargaining power of buyers

Bargaining power of buyers - Impact of key factors 2025 and 2030

7.3 Bargaining power of suppliers

Bargaining power of suppliers - Impact of key factors in 2025 and 2030

7.4 Threat of new entrants

Threat of new entrants - Impact of key factors in 2025 and 2030

7.5 Threat of substitutes

Threat of substitutes - Impact of key factors in 2025 and 2030

7.6 Threat of rivalry

Threat of rivalry - Impact of key factors in 2025 and 2030

7.7 Market condition

Chart on Market condition - Five forces 2025 and 2030

8. Market Segmentation by Product

8.1 Market segments

Chart on Product - Market share 2025-2030 (%)
Data Table on Product - Market share 2025-2030 (%)

8.2 Comparison by Product

Chart on Comparison by Product
Data Table on Comparison by Product

8.3 Non-athletic footwear - Market size and forecast 2025-2030

Chart on Non-athletic footwear - Market size and forecast 2025-2030 ($ billion)
Data Table on Non-athletic footwear - Market size and forecast 2025-2030 ($ billion)
Chart on Non-athletic footwear - Year-over-year growth 2025-2030 (%)
Data Table on Non-athletic footwear - Year-over-year growth 2025-2030 (%)

8.4 Athletic footwear - Market size and forecast 2025-2030

Chart on Athletic footwear - Market size and forecast 2025-2030 ($ billion)
Data Table on Athletic footwear - Market size and forecast 2025-2030 ($ billion)
Chart on Athletic footwear - Year-over-year growth 2025-2030 (%)
Data Table on Athletic footwear - Year-over-year growth 2025-2030 (%)

8.5 Market opportunity by Product

Market opportunity by Product ($ billion)
Data Table on Market opportunity by Product ($ billion)

9. Market Segmentation by End-user

9.1 Market segments

Chart on End-user - Market share 2025-2030 (%)
Data Table on End-user - Market share 2025-2030 (%)

9.2 Comparison by End-user

Chart on Comparison by End-user
Data Table on Comparison by End-user

9.3 Men - Market size and forecast 2025-2030

Chart on Men - Market size and forecast 2025-2030 ($ billion)
Data Table on Men - Market size and forecast 2025-2030 ($ billion)
Chart on Men - Year-over-year growth 2025-2030 (%)
Data Table on Men - Year-over-year growth 2025-2030 (%)

9.4 Women - Market size and forecast 2025-2030

Chart on Women - Market size and forecast 2025-2030 ($ billion)
Data Table on Women - Market size and forecast 2025-2030 ($ billion)
Chart on Women - Year-over-year growth 2025-2030 (%)
Data Table on Women - Year-over-year growth 2025-2030 (%)

9.5 Children - Market size and forecast 2025-2030

Chart on Children - Market size and forecast 2025-2030 ($ billion)
Data Table on Children - Market size and forecast 2025-2030 ($ billion)
Chart on Children - Year-over-year growth 2025-2030 (%)
Data Table on Children - Year-over-year growth 2025-2030 (%)

9.6 Market opportunity by End-user

Market opportunity by End-user ($ billion)
Data Table on Market opportunity by End-user ($ billion)

10. Market Segmentation by Distribution Channel

10.1 Market segments

Chart on Distribution Channel - Market share 2025-2030 (%)
Data Table on Distribution Channel - Market share 2025-2030 (%)

10.2 Comparison by Distribution Channel

Chart on Comparison by Distribution Channel
Data Table on Comparison by Distribution Channel

10.3 Offline - Market size and forecast 2025-2030

Chart on Offline - Market size and forecast 2025-2030 ($ billion)
Data Table on Offline - Market size and forecast 2025-2030 ($ billion)
Chart on Offline - Year-over-year growth 2025-2030 (%)
Data Table on Offline - Year-over-year growth 2025-2030 (%)

10.4 Online - Market size and forecast 2025-2030

Chart on Online - Market size and forecast 2025-2030 ($ billion)
Data Table on Online - Market size and forecast 2025-2030 ($ billion)
Chart on Online - Year-over-year growth 2025-2030 (%)
Data Table on Online - Year-over-year growth 2025-2030 (%)

10.5 Market opportunity by Distribution Channel

Market opportunity by Distribution Channel ($ billion)
Data Table on Market opportunity by Distribution Channel ($ billion)

11. Customer Landscape

11.1 Customer landscape overview

Analysis of price sensitivity, lifecycle, customer purchase basket, adoption rates, and purchase criteria

12. Geographic Landscape

12.1 Geographic segmentation

Chart on Market share by geography 2025-2030 (%)
Data Table on Market share by geography 2025-2030 (%)

12.2 Geographic comparison

Chart on Geographic comparison
Data Table on Geographic comparison

12.3 APAC - Market size and forecast 2025-2030

Chart on APAC - Market size and forecast 2025-2030 ($ billion)
Data Table on APAC - Market size and forecast 2025-2030 ($ billion)
Chart on APAC - Year-over-year growth 2025-2030 (%)
Data Table on APAC - Year-over-year growth 2025-2030 (%)
Chart on Regional Comparison - APAC
Data Table on Regional Comparison - APAC

12.3.1 China - Market size and forecast 2025-2030

Chart on China - Market size and forecast 2025-2030 ($ billion)
Data Table on China - Market size and forecast 2025-2030 ($ billion)
Chart on China - Year-over-year growth 2025-2030 (%)
Data Table on China - Year-over-year growth 2025-2030 (%)

12.3.2 Japan - Market size and forecast 2025-2030

Chart on Japan - Market size and forecast 2025-2030 ($ billion)
Data Table on Japan - Market size and forecast 2025-2030 ($ billion)
Chart on Japan - Year-over-year growth 2025-2030 (%)
Data Table on Japan - Year-over-year growth 2025-2030 (%)

12.3.3 India - Market size and forecast 2025-2030

Chart on India - Market size and forecast 2025-2030 ($ billion)
Data Table on India - Market size and forecast 2025-2030 ($ billion)
Chart on India - Year-over-year growth 2025-2030 (%)
Data Table on India - Year-over-year growth 2025-2030 (%)

12.3.4 South Korea - Market size and forecast 2025-2030

Chart on South Korea - Market size and forecast 2025-2030 ($ billion)
Data Table on South Korea - Market size and forecast 2025-2030 ($ billion)
Chart on South Korea - Year-over-year growth 2025-2030 (%)
Data Table on South Korea - Year-over-year growth 2025-2030 (%)

12.3.5 Australia - Market size and forecast 2025-2030

Chart on Australia - Market size and forecast 2025-2030 ($ billion)
Data Table on Australia - Market size and forecast 2025-2030 ($ billion)
Chart on Australia - Year-over-year growth 2025-2030 (%)
Data Table on Australia - Year-over-year growth 2025-2030 (%)

12.3.6 Indonesia - Market size and forecast 2025-2030

Chart on Indonesia - Market size and forecast 2025-2030 ($ billion)
Data Table on Indonesia - Market size and forecast 2025-2030 ($ billion)
Chart on Indonesia - Year-over-year growth 2025-2030 (%)
Data Table on Indonesia - Year-over-year growth 2025-2030 (%)

12.4 Europe - Market size and forecast 2025-2030

Chart on Europe - Market size and forecast 2025-2030 ($ billion)
Data Table on Europe - Market size and forecast 2025-2030 ($ billion)
Chart on Europe - Year-over-year growth 2025-2030 (%)
Data Table on Europe - Year-over-year growth 2025-2030 (%)
Chart on Regional Comparison - Europe
Data Table on Regional Comparison - Europe

12.4.1 Germany - Market size and forecast 2025-2030

Chart on Germany - Market size and forecast 2025-2030 ($ billion)
Data Table on Germany - Market size and forecast 2025-2030 ($ billion)
Chart on Germany - Year-over-year growth 2025-2030 (%)
Data Table on Germany - Year-over-year growth 2025-2030 (%)

12.4.2 UK - Market size and forecast 2025-2030

Chart on UK - Market size and forecast 2025-2030 ($ billion)
Data Table on UK - Market size and forecast 2025-2030 ($ billion)
Chart on UK - Year-over-year growth 2025-2030 (%)
Data Table on UK - Year-over-year growth 2025-2030 (%)

12.4.3 France - Market size and forecast 2025-2030

Chart on France - Market size and forecast 2025-2030 ($ billion)
Data Table on France - Market size and forecast 2025-2030 ($ billion)
Chart on France - Year-over-year growth 2025-2030 (%)
Data Table on France - Year-over-year growth 2025-2030 (%)

12.4.4 Italy - Market size and forecast 2025-2030

Chart on Italy - Market size and forecast 2025-2030 ($ billion)
Data Table on Italy - Market size and forecast 2025-2030 ($ billion)
Chart on Italy - Year-over-year growth 2025-2030 (%)
Data Table on Italy - Year-over-year growth 2025-2030 (%)

12.4.5 Spain - Market size and forecast 2025-2030

Chart on Spain - Market size and forecast 2025-2030 ($ billion)
Data Table on Spain - Market size and forecast 2025-2030 ($ billion)
Chart on Spain - Year-over-year growth 2025-2030 (%)
Data Table on Spain - Year-over-year growth 2025-2030 (%)

12.4.6 The Netherlands - Market size and forecast 2025-2030

Chart on The Netherlands - Market size and forecast 2025-2030 ($ billion)
Data Table on The Netherlands - Market size and forecast 2025-2030 ($ billion)
Chart on The Netherlands - Year-over-year growth 2025-2030 (%)
Data Table on The Netherlands - Year-over-year growth 2025-2030 (%)

12.5 North America - Market size and forecast 2025-2030

Chart on North America - Market size and forecast 2025-2030 ($ billion)
Data Table on North America - Market size and forecast 2025-2030 ($ billion)
Chart on North America - Year-over-year growth 2025-2030 (%)
Data Table on North America - Year-over-year growth 2025-2030 (%)
Chart on Regional Comparison - North America
Data Table on Regional Comparison - North America

12.5.1 US - Market size and forecast 2025-2030

Chart on US - Market size and forecast 2025-2030 ($ billion)
Data Table on US - Market size and forecast 2025-2030 ($ billion)
Chart on US - Year-over-year growth 2025-2030 (%)
Data Table on US - Year-over-year growth 2025-2030 (%)

12.5.2 Canada - Market size and forecast 2025-2030

Chart on Canada - Market size and forecast 2025-2030 ($ billion)
Data Table on Canada - Market size and forecast 2025-2030 ($ billion)
Chart on Canada - Year-over-year growth 2025-2030 (%)
Data Table on Canada - Year-over-year growth 2025-2030 (%)

12.5.3 Mexico - Market size and forecast 2025-2030

Chart on Mexico - Market size and forecast 2025-2030 ($ billion)
Data Table on Mexico - Market size and forecast 2025-2030 ($ billion)
Chart on Mexico - Year-over-year growth 2025-2030 (%)
Data Table on Mexico - Year-over-year growth 2025-2030 (%)

12.6 South America - Market size and forecast 2025-2030

Chart on South America - Market size and forecast 2025-2030 ($ billion)
Data Table on South America - Market size and forecast 2025-2030 ($ billion)
Chart on South America - Year-over-year growth 2025-2030 (%)
Data Table on South America - Year-over-year growth 2025-2030 (%)
Chart on Regional Comparison - South America
Data Table on Regional Comparison - South America

12.6.1 Brazil - Market size and forecast 2025-2030

Chart on Brazil - Market size and forecast 2025-2030 ($ billion)
Data Table on Brazil - Market size and forecast 2025-2030 ($ billion)
Chart on Brazil - Year-over-year growth 2025-2030 (%)
Data Table on Brazil - Year-over-year growth 2025-2030 (%)

12.6.2 Argentina - Market size and forecast 2025-2030

Chart on Argentina - Market size and forecast 2025-2030 ($ billion)
Data Table on Argentina - Market size and forecast 2025-2030 ($ billion)
Chart on Argentina - Year-over-year growth 2025-2030 (%)
Data Table on Argentina - Year-over-year growth 2025-2030 (%)

12.6.3 Chile - Market size and forecast 2025-2030

Chart on Chile - Market size and forecast 2025-2030 ($ billion)
Data Table on Chile - Market size and forecast 2025-2030 ($ billion)
Chart on Chile - Year-over-year growth 2025-2030 (%)
Data Table on Chile - Year-over-year growth 2025-2030 (%)

12.7 Middle East and Africa - Market size and forecast 2025-2030

Chart on Middle East and Africa - Market size and forecast 2025-2030 ($ billion)
Data Table on Middle East and Africa - Market size and forecast 2025-2030 ($ billion)
Chart on Middle East and Africa - Year-over-year growth 2025-2030 (%)
Data Table on Middle East and Africa - Year-over-year growth 2025-2030 (%)
Chart on Regional Comparison - Middle East and Africa
Data Table on Regional Comparison - Middle East and Africa

12.7.1 Saudi Arabia - Market size and forecast 2025-2030

Chart on Saudi Arabia - Market size and forecast 2025-2030 ($ billion)
Data Table on Saudi Arabia - Market size and forecast 2025-2030 ($ billion)
Chart on Saudi Arabia - Year-over-year growth 2025-2030 (%)
Data Table on Saudi Arabia - Year-over-year growth 2025-2030 (%)

12.7.2 UAE - Market size and forecast 2025-2030

Chart on UAE - Market size and forecast 2025-2030 ($ billion)
Data Table on UAE - Market size and forecast 2025-2030 ($ billion)
Chart on UAE - Year-over-year growth 2025-2030 (%)
Data Table on UAE - Year-over-year growth 2025-2030 (%)

12.7.3 South Africa - Market size and forecast 2025-2030

Chart on South Africa - Market size and forecast 2025-2030 ($ billion)
Data Table on South Africa - Market size and forecast 2025-2030 ($ billion)
Chart on South Africa - Year-over-year growth 2025-2030 (%)
Data Table on South Africa - Year-over-year growth 2025-2030 (%)

12.7.4 Israel - Market size and forecast 2025-2030

Chart on Israel - Market size and forecast 2025-2030 ($ billion)
Data Table on Israel - Market size and forecast 2025-2030 ($ billion)
Chart on Israel - Year-over-year growth 2025-2030 (%)
Data Table on Israel - Year-over-year growth 2025-2030 (%)

12.7.5 Turkey - Market size and forecast 2025-2030

Chart on Turkey - Market size and forecast 2025-2030 ($ billion)
Data Table on Turkey - Market size and forecast 2025-2030 ($ billion)
Chart on Turkey - Year-over-year growth 2025-2030 (%)
Data Table on Turkey - Year-over-year growth 2025-2030 (%)

12.8 Market opportunity by geography

Market opportunity by geography ($ billion)
Data Tables on Market opportunity by geography ($ billion)

13. Drivers, Challenges, and Opportunity

13.1 Market drivers

Pervasive influence of athleisure and fusion of performance with style
Ascendancy of sustainability and ethical production imperatives
Dominance of e-commerce and pervasive digital transformation

13.2 Market challenges

Navigating supply chain volatility and escalating production costs
Meeting demands for sustainability and increased regulatory scrutiny
Combating sophisticated counterfeiting and protecting intellectual property

13.3 Impact of drivers and challenges

Impact of drivers and challenges in 2025 and 2030

13.4 Market opportunities

Imperative of circular economy and advanced material innovation
Deep integration of performance technology into lifestyle footwear
Hyper-personalization enabled by digitalization and on-demand manufacturing

14. Competitive Landscape

14.1 Overview

14.2

Overview on criticality of inputs and factors of differentiation

14.3 Landscape disruption

Overview on factors of disruption

14.4 Industry risks

Impact of key risks on business

15. Competitive Analysis

15.1 Companies profiled

Companies covered

15.2 Company ranking index

15.3 Market positioning of companies

Matrix on companies position and classification

15.4 Adidas AG

Adidas AG - Overview
Adidas AG - Business segments
Adidas AG - Key news
Adidas AG - Key offerings
Adidas AG - Segment focus
SWOT

15.5 ASICS Corp.

ASICS Corp. - Overview
ASICS Corp. - Product / Service
ASICS Corp. - Key offerings
SWOT

15.6 Brooks Sports Inc.

Brooks Sports Inc. - Overview
Brooks Sports Inc. - Product / Service
Brooks Sports Inc. - Key offerings
SWOT

15.7 Burberry Group Plc

Burberry Group Plc - Overview
Burberry Group Plc - Business segments
Burberry Group Plc - Key offerings
Burberry Group Plc - Segment focus
SWOT

15.8 Dolce and Gabbana Srl

Dolce and Gabbana Srl - Overview
Dolce and Gabbana Srl - Product / Service
Dolce and Gabbana Srl - Key offerings
SWOT

15.9 FILA Holdings Corp.

FILA Holdings Corp. - Overview
FILA Holdings Corp. - Product / Service
FILA Holdings Corp. - Key offerings
SWOT

15.10 Geox S.p.A

Geox S.p.A - Overview
Geox S.p.A - Business segments
Geox S.p.A - Key offerings
Geox S.p.A - Segment focus
SWOT

15.11 Hermes International SA

Hermes International SA - Overview
Hermes International SA - Business segments
Hermes International SA - Key news
Hermes International SA - Key offerings
Hermes International SA - Segment focus
SWOT

15.12 Kering SA

Kering SA - Overview
Kering SA - Business segments
Kering SA - Key news
Kering SA - Key offerings
Kering SA - Segment focus
SWOT

15.13 LVMH Moet Hennessy

LVMH Moet Hennessy - Overview
LVMH Moet Hennessy - Business segments
LVMH Moet Hennessy - Key news
LVMH Moet Hennessy - Key offerings
LVMH Moet Hennessy - Segment focus
SWOT

15.14 New Balance Athletics Inc.

New Balance Athletics Inc. - Overview
New Balance Athletics Inc. - Product / Service
New Balance Athletics Inc. - Key news
New Balance Athletics Inc. - Key offerings
SWOT

15.15 Nike Inc.

Nike Inc. - Overview
Nike Inc. - Business segments
Nike Inc. - Key news
Nike Inc. - Key offerings
Nike Inc. - Segment focus
SWOT

15.16 PUMA SE

PUMA SE - Overview
PUMA SE - Business segments
PUMA SE - Key news
PUMA SE - Key offerings
PUMA SE - Segment focus
SWOT

15.17 Skechers USA Inc.

Skechers USA Inc. - Overview
Skechers USA Inc. - Business segments
Skechers USA Inc. - Key offerings
Skechers USA Inc. - Segment focus
SWOT

15.18 Under Armour Inc.

Under Armour Inc. - Overview
Under Armour Inc. - Business segments
Under Armour Inc. - Key news
Under Armour Inc. - Key offerings
Under Armour Inc. - Segment focus
SWOT

16. Appendix

16.1 Scope of the report

Market definition
Objectives
Notes and caveats

16.2 Inclusions and exclusions checklist

Inclusions checklist
Exclusions checklist

16.3 Currency conversion rates for US$

16.4 Research methodology

16.5 Data procurement

Information sources

16.6 Data validation

16.7 Validation techniques employed for market sizing

16.8 Data synthesis

16.9 360 degree market analysis

16.10 List of abbreviations

Research Methodology

Technavio presents a detailed picture of the market by way of study, synthesis, and summation of data from multiple sources. The analysts have presented the various facets of the market with a particular focus on identifying the key industry influencers. The data thus presented is comprehensive, reliable, and the result of extensive research, both primary and secondary.

INFORMATION SOURCES

Primary sources

  • Manufacturers and suppliers
  • Channel partners
  • Industry experts
  • Strategic decision makers

Secondary sources

  • Industry journals and periodicals
  • Government data
  • Financial reports of key industry players
  • Historical data
  • Press releases

DATA ANALYSIS

Data Synthesis

  • Collation of data
  • Estimation of key figures
  • Analysis of derived insights

Data Validation

  • Triangulation with data models
  • Reference against proprietary databases
  • Corroboration with industry experts

REPORT WRITING

Qualitative

  • Market drivers
  • Market challenges
  • Market trends
  • Five forces analysis

Quantitative

  • Market size and forecast
  • Market segmentation
  • Geographical insights
  • Competitive landscape

Interested in this report?

Get your sample now to see our research methodology and insights!

Download Now

Frequently Asked Questions

Footwear market growth will increase by USD 109.7 billion during 2026-2030.

The Footwear market is expected to grow at a CAGR of 4.3% during 2026-2030.

Footwear market is segmented by Product (Non-athletic footwear, Athletic footwear) End-user (Men, Women, Children) Distribution channel (Offline, Online)

Adidas AG, ASICS Corp., Brooks Sports Inc., Burberry Group Plc, Dolce and Gabbana Srl, FILA Holdings Corp., Geox S.p.A, Hermes International SA, Kering SA, LVMH Moet Hennessy, New Balance Athletics Inc., Nike Inc., PUMA SE, Skechers USA Inc., Under Armour Inc., VALENTINO Spa, VF Corp., Wolverine World Wide Inc. are a few of the key vendors in the Footwear market.

APAC will register the highest growth rate of 48% among the other regions. Therefore, the Footwear market in APAC is expected to garner significant business opportunities for the vendors during the forecast period.

China, Japan, India, South Korea, Australia, Indonesia, Germany, UK, France, Italy, Spain, The Netherlands, US, Canada, Mexico, Brazil, Argentina, Chile, Saudi Arabia, UAE, South Africa, Israel, Turkey

  • Pervasive influence of athleisure and fusion of performance with style is the driving factor this market.

The Footwear market vendors should focus on grabbing business opportunities from the Product segment as it accounted for the largest market share in the base year.
RIA - Research AI Assistant
Ask RIA